

Key Insights
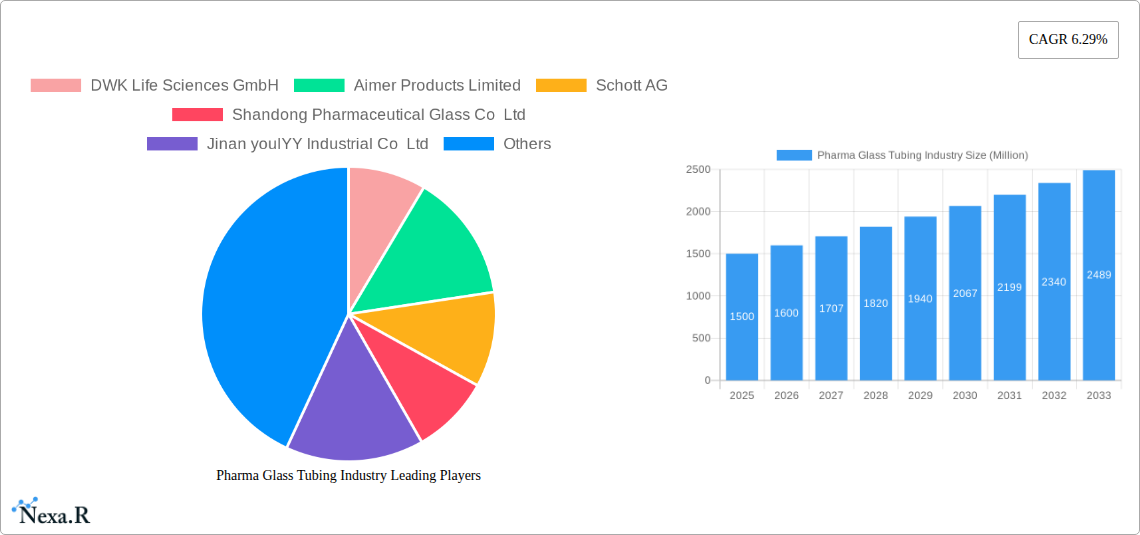
The global pharma glass tubing market, valued at approximately $XX million in 2025, is projected to experience robust growth, exhibiting a Compound Annual Growth Rate (CAGR) of 6.29% from 2025 to 2033. This expansion is driven by several key factors. The increasing demand for injectable pharmaceuticals, particularly biologics and vaccines, fuels the need for high-quality glass tubing for vial, ampoule, cartridge, and syringe manufacturing. Stringent regulatory requirements regarding product safety and sterility further necessitate the use of pharma-grade glass, bolstering market growth. Technological advancements in glass manufacturing, including the development of more durable and chemically resistant materials, are also contributing to market expansion. Furthermore, the rise of contract manufacturing organizations (CMOs) in the pharmaceutical industry is increasing the demand for reliable glass tubing suppliers. Geographical expansion, particularly in emerging markets with growing healthcare infrastructure and pharmaceutical industries, is another significant driver.
However, the market faces certain challenges. Fluctuations in raw material prices, primarily silica sand and other energy costs, can impact production costs and profitability. Competition from alternative packaging materials, such as polymers, presents a significant restraint, though glass maintains its dominance due to its inherent inertness and barrier properties crucial for drug stability. Environmental concerns related to glass manufacturing and disposal also need addressing through sustainable practices. The market segmentation by application reveals that vials remain the largest segment, followed by ampoules, cartridges, and syringes, each possessing unique growth trajectories influenced by the specific pharmaceutical products they contain. Major players, such as DWK Life Sciences GmbH, Schott AG, and Corning Incorporated, are strategically investing in R&D and capacity expansion to meet the growing demand, driving market consolidation and innovation.
Pharma Glass Tubing Industry Market Report: 2019-2033
This comprehensive report provides an in-depth analysis of the global Pharma Glass Tubing industry, encompassing market dynamics, growth trends, regional analysis, competitive landscape, and future outlook. The report covers the period from 2019 to 2033, with a focus on the forecast period 2025-2033, and leverages extensive primary and secondary research to deliver actionable insights for industry professionals. The parent market is the Pharmaceutical Packaging market, and the child market is specifically Pharma Glass Tubing, encompassing segments like vials, ampoules, cartridges, and syringes.
Pharma Glass Tubing Industry Market Dynamics & Structure
The Pharma Glass Tubing market is characterized by moderate concentration, with key players holding significant market share. Technological innovation, driven by increasing demand for specialized tubing and improved production efficiency, is a major driver. Stringent regulatory frameworks, particularly concerning material purity and manufacturing processes, significantly impact market dynamics. Competitive pressure from alternative packaging materials (e.g., plastics) necessitates continuous innovation. End-user demographics, primarily driven by pharmaceutical manufacturers and contract packaging organizations (CPOs), shape market demand. Mergers and acquisitions (M&A) activity has been moderate in recent years (xx M&A deals between 2019-2024, representing a xx% market share change).
- Market Concentration: Moderately concentrated, with top 5 players holding approximately xx% market share in 2024.
- Technological Innovation: Focus on improved purity, barrier properties, and sustainable manufacturing processes.
- Regulatory Framework: Stringent regulations regarding USP/EP compliance and environmental impact.
- Competitive Substitutes: Growing competition from alternative packaging materials, primarily plastics.
- End-User Demographics: Primarily pharmaceutical manufacturers and contract packaging organizations (CPOs).
- M&A Trends: Moderate activity in recent years, driven by consolidation and expansion strategies. Innovation barriers include high R&D costs and regulatory approval complexities.
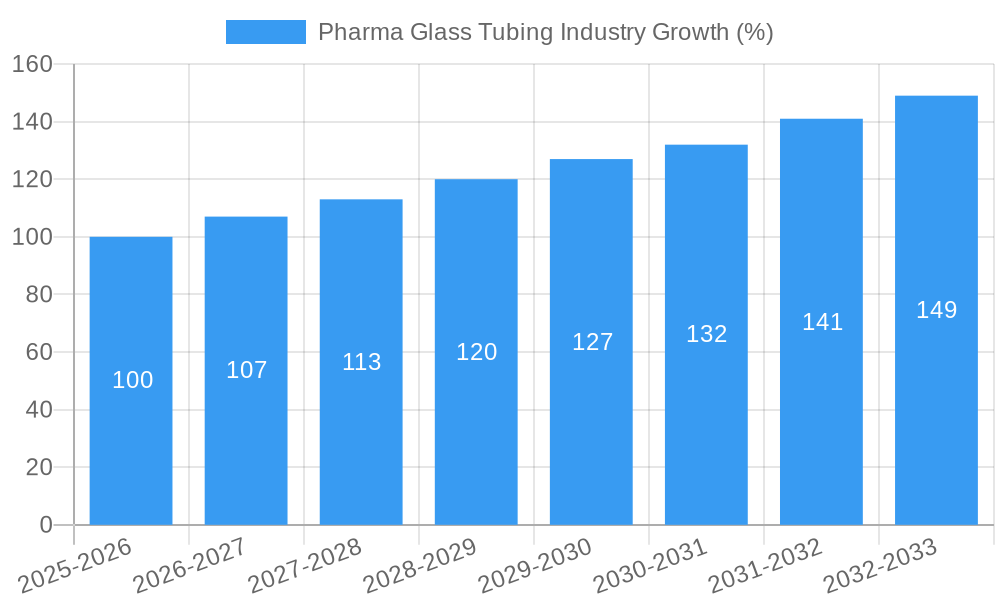
Pharma Glass Tubing Industry Growth Trends & Insights
The global Pharma Glass Tubing market experienced steady growth between 2019 and 2024, reaching a value of xx million units in 2024. This growth is primarily attributed to increasing pharmaceutical production, expanding global healthcare spending, and the preference for glass tubing due to its inert properties and suitability for sensitive drug formulations. The market is expected to maintain a CAGR of xx% during the forecast period (2025-2033), driven by technological advancements and the growing demand for pre-filled syringes and other advanced drug delivery systems. Market penetration is expected to increase significantly in emerging markets due to rising healthcare infrastructure development. Technological disruptions, such as the development of innovative glass compositions with enhanced barrier properties and the adoption of advanced manufacturing techniques, are influencing market growth. Shifts in consumer preferences towards more sustainable and eco-friendly packaging solutions are also expected to influence future growth.
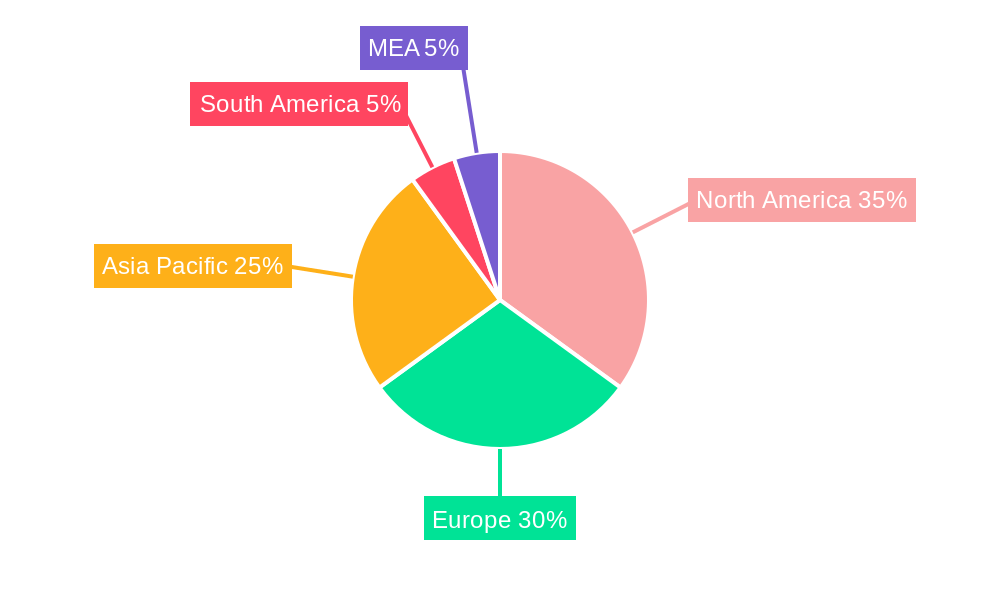
Dominant Regions, Countries, or Segments in Pharma Glass Tubing Industry
North America currently holds the largest market share in the Pharma Glass Tubing industry, followed by Europe and Asia Pacific. The dominance of North America stems from strong pharmaceutical production and regulatory frameworks supporting innovation. Within the application segments, vials and ampoules currently dominate the market, followed by cartridges and syringes. Growth in the pre-filled syringe segment is driving significant market expansion.
- Key Drivers (North America): Strong pharmaceutical industry, robust R&D investment, and stringent regulatory compliance.
- Key Drivers (Europe): Well-established pharmaceutical infrastructure, focus on innovative drug delivery systems.
- Key Drivers (Asia Pacific): Rising healthcare expenditure, increasing pharmaceutical production, and a growing middle class.
- Segment Dominance: Vials and ampoules hold the largest market share due to their widespread use in injectable drug packaging. However, the syringe segment shows the highest growth potential.
Pharma Glass Tubing Industry Product Landscape
The Pharma Glass Tubing market offers a diverse range of products tailored to specific pharmaceutical applications. Innovations focus on enhanced barrier properties to prevent drug degradation, improved chemical inertness, and the development of specialized tubing for advanced drug delivery systems like pre-filled syringes and auto-injectors. Unique selling propositions include superior chemical resistance, precise dimensions for automated filling, and compatibility with various sterilization techniques.
Key Drivers, Barriers & Challenges in Pharma Glass Tubing Industry
Key Drivers:
- Rising demand for injectable pharmaceuticals.
- Increased adoption of advanced drug delivery systems.
- Technological advancements in glass composition and manufacturing processes.
- Stringent regulatory compliance driving quality improvement.
Key Challenges:
- Fluctuations in raw material prices (e.g., silica sand).
- Supply chain disruptions impacting production and delivery timelines.
- Intense competition from alternative packaging materials (e.g., plastics). This competition accounts for approximately xx% loss in market share annually.
- Regulatory hurdles and compliance costs, increasing production expenses by approximately xx%.
Emerging Opportunities in Pharma Glass Tubing Industry
Emerging opportunities lie in the development of sustainable and eco-friendly glass tubing, expansion into emerging markets with growing healthcare expenditure, and the increasing demand for specialized tubing for personalized medicine and advanced drug delivery systems. The market for recyclable and reusable glass tubing is experiencing substantial growth.
Growth Accelerators in the Pharma Glass Tubing Industry
Long-term growth will be fueled by technological breakthroughs in glass composition and manufacturing processes leading to higher-performance tubing with enhanced barrier properties and greater sustainability. Strategic partnerships between glass manufacturers and pharmaceutical companies will streamline supply chains and accelerate innovation. Expansion into new therapeutic areas and emerging markets will create further growth opportunities.
Key Players Shaping the Pharma Glass Tubing Industry Market
- DWK Life Sciences GmbH
- Aimer Products Limited
- Schott AG
- Shandong Pharmaceutical Glass Co Ltd
- Jinan youlYY Industrial Co Ltd
- Puyang New Harmony Industrial Development Co Ltd
- Cangzhou Four-star Glass Co Ltd
- Jinan Snail International Co Ltd
- Nippon Electric Glass Co Ltd
- LINUO Group
- Nipro Pharma Corporation
- Accu-Glass LLC
- Corning Incorporated
Notable Milestones in Pharma Glass Tubing Industry Sector
- 2021: Schott AG launched a new type of high-purity glass tubing optimized for pre-filled syringes.
- 2022: DWK Life Sciences GmbH announced a strategic partnership with a major pharmaceutical company to develop sustainable glass packaging solutions.
- 2023: Several mergers and acquisitions occurred within the industry, consolidating market share among key players. (Specific details unavailable, but xx acquisitions reported).
In-Depth Pharma Glass Tubing Industry Market Outlook
The Pharma Glass Tubing market is poised for sustained growth, driven by the factors outlined above. Strategic opportunities exist for companies to invest in R&D, expand into new markets, and develop sustainable and innovative products to meet the growing demand for high-quality pharmaceutical packaging. The long-term outlook remains positive, with substantial potential for market expansion in emerging economies and the continued development of advanced drug delivery systems.
Pharma Glass Tubing Industry Segmentation
-
1. Application
- 1.1. Vials
- 1.2. Ampoules
- 1.3. Cartridges
- 1.4. Syringes
Pharma Glass Tubing Industry Segmentation By Geography
-
1. North America
- 1.1. United States
- 1.2. Canada
-
2. Europe
- 2.1. Germany
- 2.2. United Kingdom
- 2.3. France
- 2.4. Rest of Europe
-
3. Asia Pacific
- 3.1. China
- 3.2. India
- 3.3. Japan
- 3.4. Rest of Asia Pacific
- 4. Latin America
- 5. Middle East and Africa
Pharma Glass Tubing Industry REPORT HIGHLIGHTS
| Aspects | Details |
|---|---|
| Study Period | 2019-2033 |
| Base Year | 2024 |
| Estimated Year | 2025 |
| Forecast Period | 2025-2033 |
| Historical Period | 2019-2024 |
| Growth Rate | CAGR of 6.29% from 2019-2033 |
| Segmentation |
|
Table of Contents
- 1. Introduction
- 1.1. Research Scope
- 1.2. Market Segmentation
- 1.3. Research Methodology
- 1.4. Definitions and Assumptions
- 2. Executive Summary
- 2.1. Introduction
- 3. Market Dynamics
- 3.1. Introduction
- 3.2. Market Drivers
- 3.2.1. ; Growth of the Pharmaceutical Industry in Emerging Economies; Commodity Value of Glass Increased with Recyclability
- 3.3. Market Restrains
- 3.3.1. ; Increased Relevance of Alternate Sources
- 3.4. Market Trends
- 3.4.1. Vials is Expected to Witness Significant Growth in Pharmaceutical sector
- 4. Market Factor Analysis
- 4.1. Porters Five Forces
- 4.2. Supply/Value Chain
- 4.3. PESTEL analysis
- 4.4. Market Entropy
- 4.5. Patent/Trademark Analysis
- 5. Global Pharma Glass Tubing Industry Analysis, Insights and Forecast, 2019-2031
- 5.1. Market Analysis, Insights and Forecast - by Application
- 5.1.1. Vials
- 5.1.2. Ampoules
- 5.1.3. Cartridges
- 5.1.4. Syringes
- 5.2. Market Analysis, Insights and Forecast - by Region
- 5.2.1. North America
- 5.2.2. Europe
- 5.2.3. Asia Pacific
- 5.2.4. Latin America
- 5.2.5. Middle East and Africa
- 5.1. Market Analysis, Insights and Forecast - by Application
- 6. North America Pharma Glass Tubing Industry Analysis, Insights and Forecast, 2019-2031
- 6.1. Market Analysis, Insights and Forecast - by Application
- 6.1.1. Vials
- 6.1.2. Ampoules
- 6.1.3. Cartridges
- 6.1.4. Syringes
- 6.1. Market Analysis, Insights and Forecast - by Application
- 7. Europe Pharma Glass Tubing Industry Analysis, Insights and Forecast, 2019-2031
- 7.1. Market Analysis, Insights and Forecast - by Application
- 7.1.1. Vials
- 7.1.2. Ampoules
- 7.1.3. Cartridges
- 7.1.4. Syringes
- 7.1. Market Analysis, Insights and Forecast - by Application
- 8. Asia Pacific Pharma Glass Tubing Industry Analysis, Insights and Forecast, 2019-2031
- 8.1. Market Analysis, Insights and Forecast - by Application
- 8.1.1. Vials
- 8.1.2. Ampoules
- 8.1.3. Cartridges
- 8.1.4. Syringes
- 8.1. Market Analysis, Insights and Forecast - by Application
- 9. Latin America Pharma Glass Tubing Industry Analysis, Insights and Forecast, 2019-2031
- 9.1. Market Analysis, Insights and Forecast - by Application
- 9.1.1. Vials
- 9.1.2. Ampoules
- 9.1.3. Cartridges
- 9.1.4. Syringes
- 9.1. Market Analysis, Insights and Forecast - by Application
- 10. Middle East and Africa Pharma Glass Tubing Industry Analysis, Insights and Forecast, 2019-2031
- 10.1. Market Analysis, Insights and Forecast - by Application
- 10.1.1. Vials
- 10.1.2. Ampoules
- 10.1.3. Cartridges
- 10.1.4. Syringes
- 10.1. Market Analysis, Insights and Forecast - by Application
- 11. North America Pharma Glass Tubing Industry Analysis, Insights and Forecast, 2019-2031
- 11.1. Market Analysis, Insights and Forecast - By Country/Sub-region
- 11.1.1 United States
- 11.1.2 Canada
- 11.1.3 Mexico
- 12. Europe Pharma Glass Tubing Industry Analysis, Insights and Forecast, 2019-2031
- 12.1. Market Analysis, Insights and Forecast - By Country/Sub-region
- 12.1.1 Germany
- 12.1.2 United Kingdom
- 12.1.3 France
- 12.1.4 Spain
- 12.1.5 Italy
- 12.1.6 Spain
- 12.1.7 Belgium
- 12.1.8 Netherland
- 12.1.9 Nordics
- 12.1.10 Rest of Europe
- 13. Asia Pacific Pharma Glass Tubing Industry Analysis, Insights and Forecast, 2019-2031
- 13.1. Market Analysis, Insights and Forecast - By Country/Sub-region
- 13.1.1 China
- 13.1.2 Japan
- 13.1.3 India
- 13.1.4 South Korea
- 13.1.5 Southeast Asia
- 13.1.6 Australia
- 13.1.7 Indonesia
- 13.1.8 Phillipes
- 13.1.9 Singapore
- 13.1.10 Thailandc
- 13.1.11 Rest of Asia Pacific
- 14. South America Pharma Glass Tubing Industry Analysis, Insights and Forecast, 2019-2031
- 14.1. Market Analysis, Insights and Forecast - By Country/Sub-region
- 14.1.1 Brazil
- 14.1.2 Argentina
- 14.1.3 Peru
- 14.1.4 Chile
- 14.1.5 Colombia
- 14.1.6 Ecuador
- 14.1.7 Venezuela
- 14.1.8 Rest of South America
- 15. North America Pharma Glass Tubing Industry Analysis, Insights and Forecast, 2019-2031
- 15.1. Market Analysis, Insights and Forecast - By Country/Sub-region
- 15.1.1 United States
- 15.1.2 Canada
- 15.1.3 Mexico
- 16. MEA Pharma Glass Tubing Industry Analysis, Insights and Forecast, 2019-2031
- 16.1. Market Analysis, Insights and Forecast - By Country/Sub-region
- 16.1.1 United Arab Emirates
- 16.1.2 Saudi Arabia
- 16.1.3 South Africa
- 16.1.4 Rest of Middle East and Africa
- 17. Competitive Analysis
- 17.1. Global Market Share Analysis 2024
- 17.2. Company Profiles
- 17.2.1 DWK Life Sciences GmbH
- 17.2.1.1. Overview
- 17.2.1.2. Products
- 17.2.1.3. SWOT Analysis
- 17.2.1.4. Recent Developments
- 17.2.1.5. Financials (Based on Availability)
- 17.2.2 Aimer Products Limited
- 17.2.2.1. Overview
- 17.2.2.2. Products
- 17.2.2.3. SWOT Analysis
- 17.2.2.4. Recent Developments
- 17.2.2.5. Financials (Based on Availability)
- 17.2.3 Schott AG
- 17.2.3.1. Overview
- 17.2.3.2. Products
- 17.2.3.3. SWOT Analysis
- 17.2.3.4. Recent Developments
- 17.2.3.5. Financials (Based on Availability)
- 17.2.4 Shandong Pharmaceutical Glass Co Ltd
- 17.2.4.1. Overview
- 17.2.4.2. Products
- 17.2.4.3. SWOT Analysis
- 17.2.4.4. Recent Developments
- 17.2.4.5. Financials (Based on Availability)
- 17.2.5 Jinan youlYY Industrial Co Ltd
- 17.2.5.1. Overview
- 17.2.5.2. Products
- 17.2.5.3. SWOT Analysis
- 17.2.5.4. Recent Developments
- 17.2.5.5. Financials (Based on Availability)
- 17.2.6 Puyang New Harmony Industrial Development Co Ltd
- 17.2.6.1. Overview
- 17.2.6.2. Products
- 17.2.6.3. SWOT Analysis
- 17.2.6.4. Recent Developments
- 17.2.6.5. Financials (Based on Availability)
- 17.2.7 Cangzhou Four-star Glass Co Ltd
- 17.2.7.1. Overview
- 17.2.7.2. Products
- 17.2.7.3. SWOT Analysis
- 17.2.7.4. Recent Developments
- 17.2.7.5. Financials (Based on Availability)
- 17.2.8 Jinan Snail International Co Ltd*List Not Exhaustive
- 17.2.8.1. Overview
- 17.2.8.2. Products
- 17.2.8.3. SWOT Analysis
- 17.2.8.4. Recent Developments
- 17.2.8.5. Financials (Based on Availability)
- 17.2.9 Nippon Electric Glass Co Ltd
- 17.2.9.1. Overview
- 17.2.9.2. Products
- 17.2.9.3. SWOT Analysis
- 17.2.9.4. Recent Developments
- 17.2.9.5. Financials (Based on Availability)
- 17.2.10 LINUO Group
- 17.2.10.1. Overview
- 17.2.10.2. Products
- 17.2.10.3. SWOT Analysis
- 17.2.10.4. Recent Developments
- 17.2.10.5. Financials (Based on Availability)
- 17.2.11 Nipro Pharma Corporation
- 17.2.11.1. Overview
- 17.2.11.2. Products
- 17.2.11.3. SWOT Analysis
- 17.2.11.4. Recent Developments
- 17.2.11.5. Financials (Based on Availability)
- 17.2.12 Accu-Glass LLC
- 17.2.12.1. Overview
- 17.2.12.2. Products
- 17.2.12.3. SWOT Analysis
- 17.2.12.4. Recent Developments
- 17.2.12.5. Financials (Based on Availability)
- 17.2.13 Corning Incorporated
- 17.2.13.1. Overview
- 17.2.13.2. Products
- 17.2.13.3. SWOT Analysis
- 17.2.13.4. Recent Developments
- 17.2.13.5. Financials (Based on Availability)
- 17.2.1 DWK Life Sciences GmbH
List of Figures
- Figure 1: Global Pharma Glass Tubing Industry Revenue Breakdown (Million, %) by Region 2024 & 2032
- Figure 2: North America Pharma Glass Tubing Industry Revenue (Million), by Country 2024 & 2032
- Figure 3: North America Pharma Glass Tubing Industry Revenue Share (%), by Country 2024 & 2032
- Figure 4: Europe Pharma Glass Tubing Industry Revenue (Million), by Country 2024 & 2032
- Figure 5: Europe Pharma Glass Tubing Industry Revenue Share (%), by Country 2024 & 2032
- Figure 6: Asia Pacific Pharma Glass Tubing Industry Revenue (Million), by Country 2024 & 2032
- Figure 7: Asia Pacific Pharma Glass Tubing Industry Revenue Share (%), by Country 2024 & 2032
- Figure 8: South America Pharma Glass Tubing Industry Revenue (Million), by Country 2024 & 2032
- Figure 9: South America Pharma Glass Tubing Industry Revenue Share (%), by Country 2024 & 2032
- Figure 10: North America Pharma Glass Tubing Industry Revenue (Million), by Country 2024 & 2032
- Figure 11: North America Pharma Glass Tubing Industry Revenue Share (%), by Country 2024 & 2032
- Figure 12: MEA Pharma Glass Tubing Industry Revenue (Million), by Country 2024 & 2032
- Figure 13: MEA Pharma Glass Tubing Industry Revenue Share (%), by Country 2024 & 2032
- Figure 14: North America Pharma Glass Tubing Industry Revenue (Million), by Application 2024 & 2032
- Figure 15: North America Pharma Glass Tubing Industry Revenue Share (%), by Application 2024 & 2032
- Figure 16: North America Pharma Glass Tubing Industry Revenue (Million), by Country 2024 & 2032
- Figure 17: North America Pharma Glass Tubing Industry Revenue Share (%), by Country 2024 & 2032
- Figure 18: Europe Pharma Glass Tubing Industry Revenue (Million), by Application 2024 & 2032
- Figure 19: Europe Pharma Glass Tubing Industry Revenue Share (%), by Application 2024 & 2032
- Figure 20: Europe Pharma Glass Tubing Industry Revenue (Million), by Country 2024 & 2032
- Figure 21: Europe Pharma Glass Tubing Industry Revenue Share (%), by Country 2024 & 2032
- Figure 22: Asia Pacific Pharma Glass Tubing Industry Revenue (Million), by Application 2024 & 2032
- Figure 23: Asia Pacific Pharma Glass Tubing Industry Revenue Share (%), by Application 2024 & 2032
- Figure 24: Asia Pacific Pharma Glass Tubing Industry Revenue (Million), by Country 2024 & 2032
- Figure 25: Asia Pacific Pharma Glass Tubing Industry Revenue Share (%), by Country 2024 & 2032
- Figure 26: Latin America Pharma Glass Tubing Industry Revenue (Million), by Application 2024 & 2032
- Figure 27: Latin America Pharma Glass Tubing Industry Revenue Share (%), by Application 2024 & 2032
- Figure 28: Latin America Pharma Glass Tubing Industry Revenue (Million), by Country 2024 & 2032
- Figure 29: Latin America Pharma Glass Tubing Industry Revenue Share (%), by Country 2024 & 2032
- Figure 30: Middle East and Africa Pharma Glass Tubing Industry Revenue (Million), by Application 2024 & 2032
- Figure 31: Middle East and Africa Pharma Glass Tubing Industry Revenue Share (%), by Application 2024 & 2032
- Figure 32: Middle East and Africa Pharma Glass Tubing Industry Revenue (Million), by Country 2024 & 2032
- Figure 33: Middle East and Africa Pharma Glass Tubing Industry Revenue Share (%), by Country 2024 & 2032
List of Tables
- Table 1: Global Pharma Glass Tubing Industry Revenue Million Forecast, by Region 2019 & 2032
- Table 2: Global Pharma Glass Tubing Industry Revenue Million Forecast, by Application 2019 & 2032
- Table 3: Global Pharma Glass Tubing Industry Revenue Million Forecast, by Region 2019 & 2032
- Table 4: Global Pharma Glass Tubing Industry Revenue Million Forecast, by Country 2019 & 2032
- Table 5: United States Pharma Glass Tubing Industry Revenue (Million) Forecast, by Application 2019 & 2032
- Table 6: Canada Pharma Glass Tubing Industry Revenue (Million) Forecast, by Application 2019 & 2032
- Table 7: Mexico Pharma Glass Tubing Industry Revenue (Million) Forecast, by Application 2019 & 2032
- Table 8: Global Pharma Glass Tubing Industry Revenue Million Forecast, by Country 2019 & 2032
- Table 9: Germany Pharma Glass Tubing Industry Revenue (Million) Forecast, by Application 2019 & 2032
- Table 10: United Kingdom Pharma Glass Tubing Industry Revenue (Million) Forecast, by Application 2019 & 2032
- Table 11: France Pharma Glass Tubing Industry Revenue (Million) Forecast, by Application 2019 & 2032
- Table 12: Spain Pharma Glass Tubing Industry Revenue (Million) Forecast, by Application 2019 & 2032
- Table 13: Italy Pharma Glass Tubing Industry Revenue (Million) Forecast, by Application 2019 & 2032
- Table 14: Spain Pharma Glass Tubing Industry Revenue (Million) Forecast, by Application 2019 & 2032
- Table 15: Belgium Pharma Glass Tubing Industry Revenue (Million) Forecast, by Application 2019 & 2032
- Table 16: Netherland Pharma Glass Tubing Industry Revenue (Million) Forecast, by Application 2019 & 2032
- Table 17: Nordics Pharma Glass Tubing Industry Revenue (Million) Forecast, by Application 2019 & 2032
- Table 18: Rest of Europe Pharma Glass Tubing Industry Revenue (Million) Forecast, by Application 2019 & 2032
- Table 19: Global Pharma Glass Tubing Industry Revenue Million Forecast, by Country 2019 & 2032
- Table 20: China Pharma Glass Tubing Industry Revenue (Million) Forecast, by Application 2019 & 2032
- Table 21: Japan Pharma Glass Tubing Industry Revenue (Million) Forecast, by Application 2019 & 2032
- Table 22: India Pharma Glass Tubing Industry Revenue (Million) Forecast, by Application 2019 & 2032
- Table 23: South Korea Pharma Glass Tubing Industry Revenue (Million) Forecast, by Application 2019 & 2032
- Table 24: Southeast Asia Pharma Glass Tubing Industry Revenue (Million) Forecast, by Application 2019 & 2032
- Table 25: Australia Pharma Glass Tubing Industry Revenue (Million) Forecast, by Application 2019 & 2032
- Table 26: Indonesia Pharma Glass Tubing Industry Revenue (Million) Forecast, by Application 2019 & 2032
- Table 27: Phillipes Pharma Glass Tubing Industry Revenue (Million) Forecast, by Application 2019 & 2032
- Table 28: Singapore Pharma Glass Tubing Industry Revenue (Million) Forecast, by Application 2019 & 2032
- Table 29: Thailandc Pharma Glass Tubing Industry Revenue (Million) Forecast, by Application 2019 & 2032
- Table 30: Rest of Asia Pacific Pharma Glass Tubing Industry Revenue (Million) Forecast, by Application 2019 & 2032
- Table 31: Global Pharma Glass Tubing Industry Revenue Million Forecast, by Country 2019 & 2032
- Table 32: Brazil Pharma Glass Tubing Industry Revenue (Million) Forecast, by Application 2019 & 2032
- Table 33: Argentina Pharma Glass Tubing Industry Revenue (Million) Forecast, by Application 2019 & 2032
- Table 34: Peru Pharma Glass Tubing Industry Revenue (Million) Forecast, by Application 2019 & 2032
- Table 35: Chile Pharma Glass Tubing Industry Revenue (Million) Forecast, by Application 2019 & 2032
- Table 36: Colombia Pharma Glass Tubing Industry Revenue (Million) Forecast, by Application 2019 & 2032
- Table 37: Ecuador Pharma Glass Tubing Industry Revenue (Million) Forecast, by Application 2019 & 2032
- Table 38: Venezuela Pharma Glass Tubing Industry Revenue (Million) Forecast, by Application 2019 & 2032
- Table 39: Rest of South America Pharma Glass Tubing Industry Revenue (Million) Forecast, by Application 2019 & 2032
- Table 40: Global Pharma Glass Tubing Industry Revenue Million Forecast, by Country 2019 & 2032
- Table 41: United States Pharma Glass Tubing Industry Revenue (Million) Forecast, by Application 2019 & 2032
- Table 42: Canada Pharma Glass Tubing Industry Revenue (Million) Forecast, by Application 2019 & 2032
- Table 43: Mexico Pharma Glass Tubing Industry Revenue (Million) Forecast, by Application 2019 & 2032
- Table 44: Global Pharma Glass Tubing Industry Revenue Million Forecast, by Country 2019 & 2032
- Table 45: United Arab Emirates Pharma Glass Tubing Industry Revenue (Million) Forecast, by Application 2019 & 2032
- Table 46: Saudi Arabia Pharma Glass Tubing Industry Revenue (Million) Forecast, by Application 2019 & 2032
- Table 47: South Africa Pharma Glass Tubing Industry Revenue (Million) Forecast, by Application 2019 & 2032
- Table 48: Rest of Middle East and Africa Pharma Glass Tubing Industry Revenue (Million) Forecast, by Application 2019 & 2032
- Table 49: Global Pharma Glass Tubing Industry Revenue Million Forecast, by Application 2019 & 2032
- Table 50: Global Pharma Glass Tubing Industry Revenue Million Forecast, by Country 2019 & 2032
- Table 51: United States Pharma Glass Tubing Industry Revenue (Million) Forecast, by Application 2019 & 2032
- Table 52: Canada Pharma Glass Tubing Industry Revenue (Million) Forecast, by Application 2019 & 2032
- Table 53: Global Pharma Glass Tubing Industry Revenue Million Forecast, by Application 2019 & 2032
- Table 54: Global Pharma Glass Tubing Industry Revenue Million Forecast, by Country 2019 & 2032
- Table 55: Germany Pharma Glass Tubing Industry Revenue (Million) Forecast, by Application 2019 & 2032
- Table 56: United Kingdom Pharma Glass Tubing Industry Revenue (Million) Forecast, by Application 2019 & 2032
- Table 57: France Pharma Glass Tubing Industry Revenue (Million) Forecast, by Application 2019 & 2032
- Table 58: Rest of Europe Pharma Glass Tubing Industry Revenue (Million) Forecast, by Application 2019 & 2032
- Table 59: Global Pharma Glass Tubing Industry Revenue Million Forecast, by Application 2019 & 2032
- Table 60: Global Pharma Glass Tubing Industry Revenue Million Forecast, by Country 2019 & 2032
- Table 61: China Pharma Glass Tubing Industry Revenue (Million) Forecast, by Application 2019 & 2032
- Table 62: India Pharma Glass Tubing Industry Revenue (Million) Forecast, by Application 2019 & 2032
- Table 63: Japan Pharma Glass Tubing Industry Revenue (Million) Forecast, by Application 2019 & 2032
- Table 64: Rest of Asia Pacific Pharma Glass Tubing Industry Revenue (Million) Forecast, by Application 2019 & 2032
- Table 65: Global Pharma Glass Tubing Industry Revenue Million Forecast, by Application 2019 & 2032
- Table 66: Global Pharma Glass Tubing Industry Revenue Million Forecast, by Country 2019 & 2032
- Table 67: Global Pharma Glass Tubing Industry Revenue Million Forecast, by Application 2019 & 2032
- Table 68: Global Pharma Glass Tubing Industry Revenue Million Forecast, by Country 2019 & 2032
Frequently Asked Questions
1. What is the projected Compound Annual Growth Rate (CAGR) of the Pharma Glass Tubing Industry?
The projected CAGR is approximately 6.29%.
2. Which companies are prominent players in the Pharma Glass Tubing Industry?
Key companies in the market include DWK Life Sciences GmbH, Aimer Products Limited, Schott AG, Shandong Pharmaceutical Glass Co Ltd, Jinan youlYY Industrial Co Ltd, Puyang New Harmony Industrial Development Co Ltd, Cangzhou Four-star Glass Co Ltd, Jinan Snail International Co Ltd*List Not Exhaustive, Nippon Electric Glass Co Ltd, LINUO Group, Nipro Pharma Corporation, Accu-Glass LLC, Corning Incorporated.
3. What are the main segments of the Pharma Glass Tubing Industry?
The market segments include Application.
4. Can you provide details about the market size?
The market size is estimated to be USD XX Million as of 2022.
5. What are some drivers contributing to market growth?
; Growth of the Pharmaceutical Industry in Emerging Economies; Commodity Value of Glass Increased with Recyclability.
6. What are the notable trends driving market growth?
Vials is Expected to Witness Significant Growth in Pharmaceutical sector.
7. Are there any restraints impacting market growth?
; Increased Relevance of Alternate Sources.
8. Can you provide examples of recent developments in the market?
N/A
9. What pricing options are available for accessing the report?
Pricing options include single-user, multi-user, and enterprise licenses priced at USD 4750, USD 5250, and USD 8750 respectively.
10. Is the market size provided in terms of value or volume?
The market size is provided in terms of value, measured in Million.
11. Are there any specific market keywords associated with the report?
Yes, the market keyword associated with the report is "Pharma Glass Tubing Industry," which aids in identifying and referencing the specific market segment covered.
12. How do I determine which pricing option suits my needs best?
The pricing options vary based on user requirements and access needs. Individual users may opt for single-user licenses, while businesses requiring broader access may choose multi-user or enterprise licenses for cost-effective access to the report.
13. Are there any additional resources or data provided in the Pharma Glass Tubing Industry report?
While the report offers comprehensive insights, it's advisable to review the specific contents or supplementary materials provided to ascertain if additional resources or data are available.
14. How can I stay updated on further developments or reports in the Pharma Glass Tubing Industry?
To stay informed about further developments, trends, and reports in the Pharma Glass Tubing Industry, consider subscribing to industry newsletters, following relevant companies and organizations, or regularly checking reputable industry news sources and publications.
Methodology
Step 1 - Identification of Relevant Samples Size from Population Database


Step 2 - Approaches for Defining Global Market Size (Value, Volume* & Price*)

Note*: In applicable scenarios
Step 3 - Data Sources
Primary Research
- Web Analytics
- Survey Reports
- Research Institute
- Latest Research Reports
- Opinion Leaders
Secondary Research
- Annual Reports
- White Paper
- Latest Press Release
- Industry Association
- Paid Database
- Investor Presentations

Step 4 - Data Triangulation
Involves using different sources of information in order to increase the validity of a study
These sources are likely to be stakeholders in a program - participants, other researchers, program staff, other community members, and so on.
Then we put all data in single framework & apply various statistical tools to find out the dynamic on the market.
During the analysis stage, feedback from the stakeholder groups would be compared to determine areas of agreement as well as areas of divergence
