

Key Insights
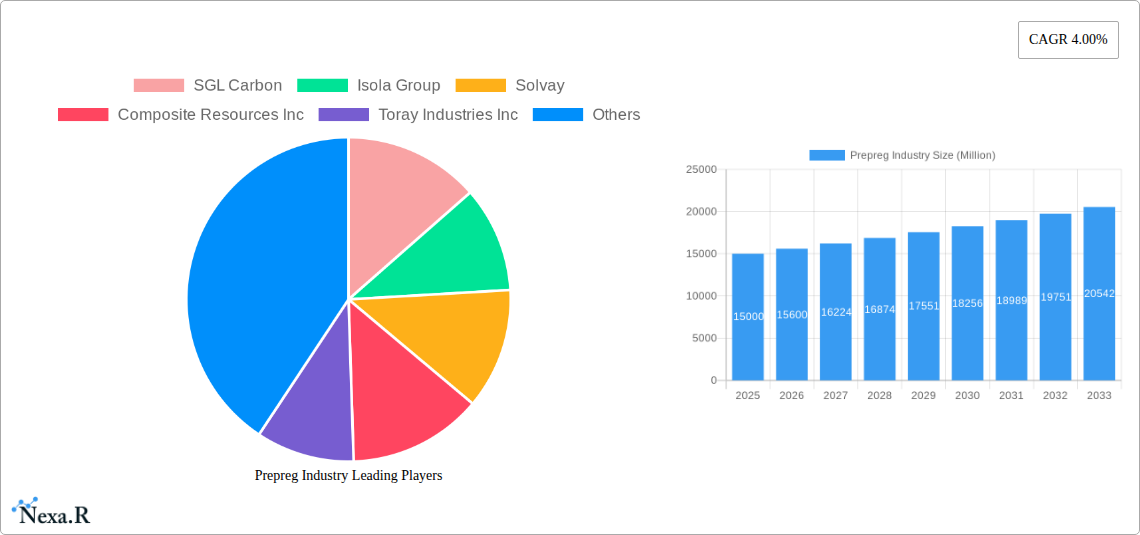
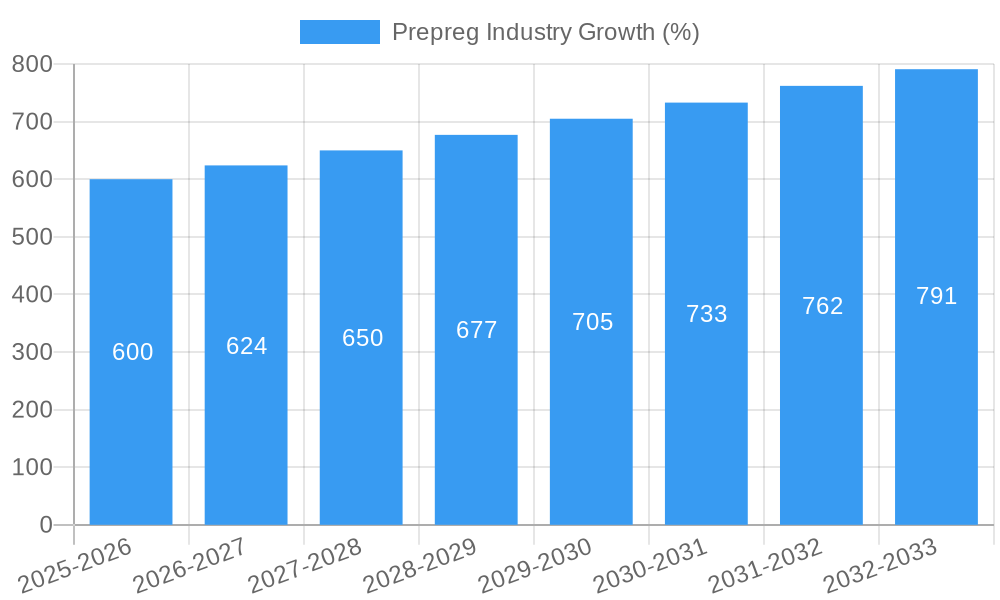
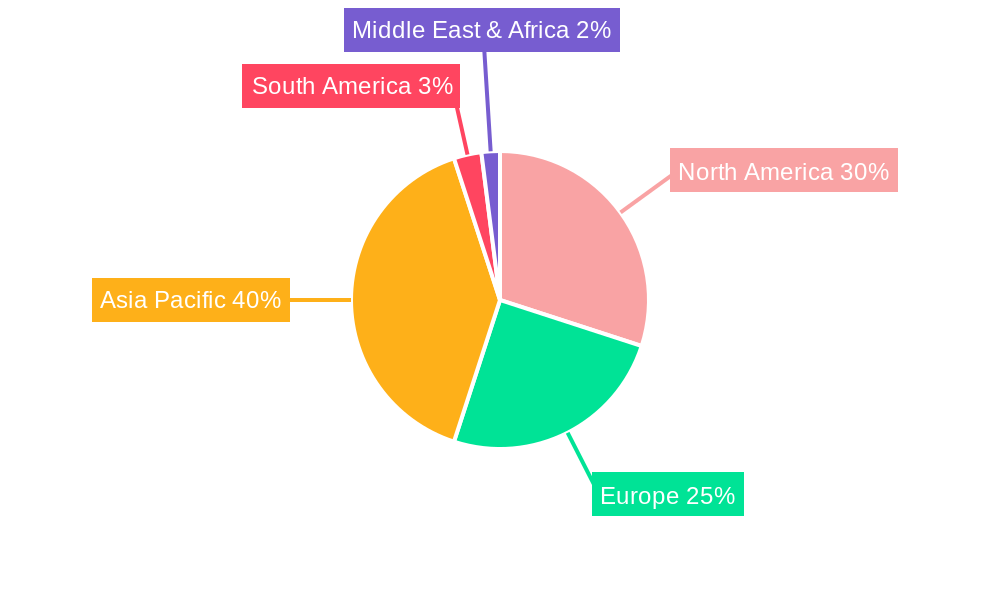
The global prepreg market, valued at approximately $XX million in 2025, is projected to experience steady growth, exhibiting a compound annual growth rate (CAGR) of 4.00% from 2025 to 2033. This expansion is driven by several key factors. The increasing demand for lightweight yet high-strength materials in the aerospace and defense sectors fuels significant prepreg adoption. Simultaneously, the automotive industry's push towards fuel efficiency and electric vehicles is bolstering the demand for composite materials, a key application area for prepregs. Further growth is anticipated from the expanding wind turbine industry, which leverages prepregs for blade manufacturing to enhance efficiency and durability. Technological advancements leading to improved prepreg resin systems with enhanced performance characteristics, such as higher strength-to-weight ratios and improved processability, also contribute to market growth. While the market faces certain restraints, such as the relatively high cost of prepreg materials and the specialized skills required for processing, these are being offset by the aforementioned drivers, ensuring continued market expansion. The market is segmented by resin type (thermoset and thermoplastic), fiber type (carbon, glass, and aramid), and end-user industry. Thermoset resins currently dominate the market, but thermoplastic prepregs are expected to witness significant growth due to their recyclability and superior performance in certain applications. The carbon fiber segment holds the largest market share owing to its superior mechanical properties. Geographically, Asia Pacific, particularly China and India, are expected to lead the market growth, driven by robust infrastructure development and increasing manufacturing activities. North America and Europe also contribute significantly to the market, primarily fueled by the aerospace and automotive industries.
The competitive landscape of the prepreg market is characterized by the presence of both established global players and regional manufacturers. Companies like SGL Carbon, Isola Group, Solvay, and Toray Industries Inc. are key players, constantly innovating to offer advanced prepreg solutions. The competitive environment is dynamic, with companies focusing on strategic partnerships, mergers and acquisitions, and product development to gain a competitive edge. The future of the prepreg market hinges on ongoing technological advancements, particularly in the development of more sustainable and cost-effective materials, as well as the expansion of its applications across various industries. Furthermore, the adoption of Industry 4.0 technologies, such as automation and digitalization in manufacturing, will be crucial for optimizing prepreg production and improving efficiency. Overall, the prepreg market is poised for considerable growth, driven by a confluence of technological advancements and increasing demand across multiple sectors.
Prepreg Industry Market Report: 2019-2033
This comprehensive report provides a detailed analysis of the Prepreg industry, encompassing market dynamics, growth trends, regional segmentation, product landscape, and key players. The study period spans from 2019 to 2033, with a base year of 2025 and a forecast period from 2025 to 2033. This in-depth analysis is crucial for businesses operating within the parent market of advanced composites and the child market of prepreg materials, providing valuable insights for strategic decision-making. The report utilizes high-traffic keywords to maximize search engine visibility and engage industry professionals. Market values are presented in million units.
Prepreg Industry Market Dynamics & Structure
The Prepreg industry is characterized by moderate market concentration, with key players holding significant market share. Technological innovation, driven by advancements in fiber and resin technologies, is a major driver of market growth. Stringent regulatory frameworks, particularly concerning environmental impact and safety, influence manufacturing processes and product development. Competitive product substitutes, such as alternative composite materials, pose challenges. End-user demographics, skewed towards sectors like aerospace and automotive, significantly impact demand. Mergers and acquisitions (M&A) activity remains a prominent feature, with xx deals recorded in the historical period (2019-2024), resulting in a market consolidation rate of xx%.
- Market Concentration: Moderately concentrated, with top 5 players holding xx% market share in 2024.
- Technological Innovation: Focus on lightweighting, improved mechanical properties, and sustainable materials.
- Regulatory Landscape: Stringent environmental and safety regulations impacting manufacturing.
- Competitive Substitutes: Increased competition from alternative composite materials.
- M&A Activity: xx deals between 2019-2024, driving consolidation and market share changes.
- Innovation Barriers: High R&D costs, lengthy testing procedures, and regulatory approvals.
Prepreg Industry Growth Trends & Insights
The Prepreg market exhibited a CAGR of xx% during the historical period (2019-2024), reaching a market size of xx million units in 2024. Driven by increasing demand from the aerospace and automotive industries, the market is projected to continue its growth trajectory, reaching xx million units by 2033 with a forecast CAGR of xx%. Technological disruptions, such as the introduction of new resin systems and fiber architectures, are influencing adoption rates and shifting consumer preferences toward higher-performance and cost-effective materials. Market penetration in emerging applications, like wind energy and electrical vehicles, is steadily increasing.
- Market Size: xx million units in 2024, projected to reach xx million units by 2033.
- CAGR (2019-2024): xx%
- CAGR (2025-2033): xx%
- Market Penetration: xx% in 2024, projected to reach xx% by 2033 in key end-user segments.
- Technological Disruptions: Adoption of advanced materials like carbon nanotubes and bio-based resins.
Dominant Regions, Countries, or Segments in Prepreg Industry
North America currently holds the largest market share in the prepreg industry, driven by strong demand from the aerospace and defense sector and a well-established manufacturing base. Asia Pacific, particularly China, is experiencing rapid growth, fueled by the booming automotive and wind energy sectors. Within segments, carbon fiber prepregs dominate the market due to their high strength-to-weight ratio and superior mechanical properties. The aerospace and defense industry remains the largest end-user sector, followed by the automotive industry.
- Leading Region: North America (xx% market share in 2024)
- Fastest-Growing Region: Asia Pacific (xx% CAGR projected for 2025-2033)
- Dominant Resin Type: Thermoset (xx% market share in 2024)
- Dominant Fiber Type: Carbon Fiber (xx% market share in 2024)
- Largest End-User Sector: Aerospace & Defense (xx% market share in 2024)
- Key Drivers: Government initiatives promoting lightweighting and renewable energy.
Prepreg Industry Product Landscape
Prepreg products are constantly evolving, with advancements in resin chemistry and fiber technology leading to improved mechanical properties, thermal stability, and processability. Unique selling propositions include tailored material properties to meet specific application requirements, as well as enhanced durability and reduced manufacturing time. Technological advancements focus on developing lighter, stronger, and more cost-effective materials for a wide range of applications.
Key Drivers, Barriers & Challenges in Prepreg Industry
Key Drivers: The increasing demand for lightweight materials in aerospace, automotive, and wind energy applications is a key driver. Government regulations promoting fuel efficiency and emission reduction are also significant. Advances in materials science, particularly in resin and fiber technology, lead to improved performance and cost-effectiveness.
Key Challenges: High raw material costs, particularly for carbon fiber, pose a major challenge. Supply chain disruptions can significantly impact production and delivery timelines. Stringent regulatory compliance requirements can increase manufacturing costs and complexity. Intense competition from established players and new entrants creates pressure on pricing and profitability.
Emerging Opportunities in Prepreg Industry
Emerging opportunities lie in expanding into new applications, such as electric vehicles, robotics, and medical devices. The development of sustainable and recyclable prepreg materials presents a significant opportunity. The increasing demand for customized prepreg solutions for niche applications offers opportunities for specialized manufacturers.
Growth Accelerators in the Prepreg Industry
Technological breakthroughs in resin and fiber technology, such as the development of high-performance thermoplastic prepregs and the use of bio-based materials, will be key growth accelerators. Strategic partnerships and collaborations among manufacturers, material suppliers, and end-users will facilitate the development and adoption of new technologies. Market expansion into emerging economies, particularly in Asia and South America, will drive long-term growth.
Key Players Shaping the Prepreg Industry Market
- SGL Carbon
- Isola Group
- Solvay
- Composite Resources Inc
- Toray Industries Inc
- Sunrez Corporation
- Ventec International Group
- Axiom Materials
- Yokohama Aerospace America Inc
- Renegade Materials Corporation
- Park Eletrochemical Corp
- Mitsubishi Chemical Carbon Fiber and Composites Inc
- Hexcel Corporation
- Koninklijke Ten Cate BV
- Gurit
- TEIJIN LIMITED
- Zoltek
Notable Milestones in Prepreg Industry Sector
- 2020: Introduction of a new high-strength, lightweight carbon fiber prepreg by Toray Industries.
- 2021: Acquisition of a smaller prepreg manufacturer by Hexcel Corporation.
- 2022: Launch of a sustainable, bio-based resin prepreg by a smaller company.
- 2023: Significant investment in R&D for thermoplastic prepregs by several major players.
- 2024: Several new regulatory guidelines for prepreg manufacturing implemented in Europe.
In-Depth Prepreg Industry Market Outlook
The Prepreg industry is poised for continued growth, driven by strong demand from key end-user sectors and ongoing technological advancements. Strategic opportunities lie in focusing on sustainable material development, expanding into emerging markets, and forging strategic alliances to strengthen supply chains and leverage technological synergies. The market is expected to experience significant consolidation through mergers and acquisitions, leading to a more concentrated industry landscape.
Prepreg Industry Segmentation
-
1. Resin Type
- 1.1. Thermoset
- 1.2. Thermoplastic
-
2. Fiber Type
- 2.1. Carbon
- 2.2. Glass
- 2.3. Aramid
-
3. End-user Industry
- 3.1. Aerospace and Defense
- 3.2. Automotive
- 3.3. Electrical and Electronics
- 3.4. Wind Turbine
- 3.5. Leisure
- 3.6. Other End-user Industries
Prepreg Industry Segmentation By Geography
-
1. Asia Pacific
- 1.1. China
- 1.2. India
- 1.3. Japan
- 1.4. South Korea
- 1.5. Rest of Asia Pacific
-
2. North America
- 2.1. United States
- 2.2. Canada
- 2.3. Mexico
-
3. Europe
- 3.1. Germany
- 3.2. United Kingdom
- 3.3. Italy
- 3.4. France
- 3.5. Rest of Europe
-
4. South America
- 4.1. Brazil
- 4.2. Argentina
- 4.3. Rest of South America
- 5. Middle East
-
6. Saudi Arabia
- 6.1. South Africa
- 6.2. Rest of Middle East
Prepreg Industry REPORT HIGHLIGHTS
| Aspects | Details |
|---|---|
| Study Period | 2019-2033 |
| Base Year | 2024 |
| Estimated Year | 2025 |
| Forecast Period | 2025-2033 |
| Historical Period | 2019-2024 |
| Growth Rate | CAGR of 4.00% from 2019-2033 |
| Segmentation |
|
Table of Contents
- 1. Introduction
- 1.1. Research Scope
- 1.2. Market Segmentation
- 1.3. Research Methodology
- 1.4. Definitions and Assumptions
- 2. Executive Summary
- 2.1. Introduction
- 3. Market Dynamics
- 3.1. Introduction
- 3.2. Market Drivers
- 3.2.1. Growing Demand from the Aerospace and Defense Sector; Growing Demand from the Wind Sector; Increased Adoption of Carbon Prepreg
- 3.3. Market Restrains
- 3.3.1. Autoclave and Maintenance Constraints
- 3.4. Market Trends
- 3.4.1. Aerospace and Defense Industry to Drive the Market
- 4. Market Factor Analysis
- 4.1. Porters Five Forces
- 4.2. Supply/Value Chain
- 4.3. PESTEL analysis
- 4.4. Market Entropy
- 4.5. Patent/Trademark Analysis
- 5. Global Prepreg Industry Analysis, Insights and Forecast, 2019-2031
- 5.1. Market Analysis, Insights and Forecast - by Resin Type
- 5.1.1. Thermoset
- 5.1.2. Thermoplastic
- 5.2. Market Analysis, Insights and Forecast - by Fiber Type
- 5.2.1. Carbon
- 5.2.2. Glass
- 5.2.3. Aramid
- 5.3. Market Analysis, Insights and Forecast - by End-user Industry
- 5.3.1. Aerospace and Defense
- 5.3.2. Automotive
- 5.3.3. Electrical and Electronics
- 5.3.4. Wind Turbine
- 5.3.5. Leisure
- 5.3.6. Other End-user Industries
- 5.4. Market Analysis, Insights and Forecast - by Region
- 5.4.1. Asia Pacific
- 5.4.2. North America
- 5.4.3. Europe
- 5.4.4. South America
- 5.4.5. Middle East
- 5.4.6. Saudi Arabia
- 5.1. Market Analysis, Insights and Forecast - by Resin Type
- 6. Asia Pacific Prepreg Industry Analysis, Insights and Forecast, 2019-2031
- 6.1. Market Analysis, Insights and Forecast - by Resin Type
- 6.1.1. Thermoset
- 6.1.2. Thermoplastic
- 6.2. Market Analysis, Insights and Forecast - by Fiber Type
- 6.2.1. Carbon
- 6.2.2. Glass
- 6.2.3. Aramid
- 6.3. Market Analysis, Insights and Forecast - by End-user Industry
- 6.3.1. Aerospace and Defense
- 6.3.2. Automotive
- 6.3.3. Electrical and Electronics
- 6.3.4. Wind Turbine
- 6.3.5. Leisure
- 6.3.6. Other End-user Industries
- 6.1. Market Analysis, Insights and Forecast - by Resin Type
- 7. North America Prepreg Industry Analysis, Insights and Forecast, 2019-2031
- 7.1. Market Analysis, Insights and Forecast - by Resin Type
- 7.1.1. Thermoset
- 7.1.2. Thermoplastic
- 7.2. Market Analysis, Insights and Forecast - by Fiber Type
- 7.2.1. Carbon
- 7.2.2. Glass
- 7.2.3. Aramid
- 7.3. Market Analysis, Insights and Forecast - by End-user Industry
- 7.3.1. Aerospace and Defense
- 7.3.2. Automotive
- 7.3.3. Electrical and Electronics
- 7.3.4. Wind Turbine
- 7.3.5. Leisure
- 7.3.6. Other End-user Industries
- 7.1. Market Analysis, Insights and Forecast - by Resin Type
- 8. Europe Prepreg Industry Analysis, Insights and Forecast, 2019-2031
- 8.1. Market Analysis, Insights and Forecast - by Resin Type
- 8.1.1. Thermoset
- 8.1.2. Thermoplastic
- 8.2. Market Analysis, Insights and Forecast - by Fiber Type
- 8.2.1. Carbon
- 8.2.2. Glass
- 8.2.3. Aramid
- 8.3. Market Analysis, Insights and Forecast - by End-user Industry
- 8.3.1. Aerospace and Defense
- 8.3.2. Automotive
- 8.3.3. Electrical and Electronics
- 8.3.4. Wind Turbine
- 8.3.5. Leisure
- 8.3.6. Other End-user Industries
- 8.1. Market Analysis, Insights and Forecast - by Resin Type
- 9. South America Prepreg Industry Analysis, Insights and Forecast, 2019-2031
- 9.1. Market Analysis, Insights and Forecast - by Resin Type
- 9.1.1. Thermoset
- 9.1.2. Thermoplastic
- 9.2. Market Analysis, Insights and Forecast - by Fiber Type
- 9.2.1. Carbon
- 9.2.2. Glass
- 9.2.3. Aramid
- 9.3. Market Analysis, Insights and Forecast - by End-user Industry
- 9.3.1. Aerospace and Defense
- 9.3.2. Automotive
- 9.3.3. Electrical and Electronics
- 9.3.4. Wind Turbine
- 9.3.5. Leisure
- 9.3.6. Other End-user Industries
- 9.1. Market Analysis, Insights and Forecast - by Resin Type
- 10. Middle East Prepreg Industry Analysis, Insights and Forecast, 2019-2031
- 10.1. Market Analysis, Insights and Forecast - by Resin Type
- 10.1.1. Thermoset
- 10.1.2. Thermoplastic
- 10.2. Market Analysis, Insights and Forecast - by Fiber Type
- 10.2.1. Carbon
- 10.2.2. Glass
- 10.2.3. Aramid
- 10.3. Market Analysis, Insights and Forecast - by End-user Industry
- 10.3.1. Aerospace and Defense
- 10.3.2. Automotive
- 10.3.3. Electrical and Electronics
- 10.3.4. Wind Turbine
- 10.3.5. Leisure
- 10.3.6. Other End-user Industries
- 10.1. Market Analysis, Insights and Forecast - by Resin Type
- 11. Saudi Arabia Prepreg Industry Analysis, Insights and Forecast, 2019-2031
- 11.1. Market Analysis, Insights and Forecast - by Resin Type
- 11.1.1. Thermoset
- 11.1.2. Thermoplastic
- 11.2. Market Analysis, Insights and Forecast - by Fiber Type
- 11.2.1. Carbon
- 11.2.2. Glass
- 11.2.3. Aramid
- 11.3. Market Analysis, Insights and Forecast - by End-user Industry
- 11.3.1. Aerospace and Defense
- 11.3.2. Automotive
- 11.3.3. Electrical and Electronics
- 11.3.4. Wind Turbine
- 11.3.5. Leisure
- 11.3.6. Other End-user Industries
- 11.1. Market Analysis, Insights and Forecast - by Resin Type
- 12. Asia Pacific Prepreg Industry Analysis, Insights and Forecast, 2019-2031
- 12.1. Market Analysis, Insights and Forecast - By Country/Sub-region
- 12.1.1 China
- 12.1.2 India
- 12.1.3 Japan
- 12.1.4 South Korea
- 12.1.5 Rest of Asia Pacific
- 13. North America Prepreg Industry Analysis, Insights and Forecast, 2019-2031
- 13.1. Market Analysis, Insights and Forecast - By Country/Sub-region
- 13.1.1 United States
- 13.1.2 Canada
- 13.1.3 Mexico
- 14. Europe Prepreg Industry Analysis, Insights and Forecast, 2019-2031
- 14.1. Market Analysis, Insights and Forecast - By Country/Sub-region
- 14.1.1 Germany
- 14.1.2 United Kingdom
- 14.1.3 Italy
- 14.1.4 France
- 14.1.5 Rest of Europe
- 15. South America Prepreg Industry Analysis, Insights and Forecast, 2019-2031
- 15.1. Market Analysis, Insights and Forecast - By Country/Sub-region
- 15.1.1 Brazil
- 15.1.2 Argentina
- 15.1.3 Rest of South America
- 16. Middle East Prepreg Industry Analysis, Insights and Forecast, 2019-2031
- 16.1. Market Analysis, Insights and Forecast - By Country/Sub-region
- 16.1.1.
- 17. Saudi Arabia Prepreg Industry Analysis, Insights and Forecast, 2019-2031
- 17.1. Market Analysis, Insights and Forecast - By Country/Sub-region
- 17.1.1 South Africa
- 17.1.2 Rest of Middle East
- 18. Competitive Analysis
- 18.1. Global Market Share Analysis 2024
- 18.2. Company Profiles
- 18.2.1 SGL Carbon
- 18.2.1.1. Overview
- 18.2.1.2. Products
- 18.2.1.3. SWOT Analysis
- 18.2.1.4. Recent Developments
- 18.2.1.5. Financials (Based on Availability)
- 18.2.2 Isola Group
- 18.2.2.1. Overview
- 18.2.2.2. Products
- 18.2.2.3. SWOT Analysis
- 18.2.2.4. Recent Developments
- 18.2.2.5. Financials (Based on Availability)
- 18.2.3 Solvay
- 18.2.3.1. Overview
- 18.2.3.2. Products
- 18.2.3.3. SWOT Analysis
- 18.2.3.4. Recent Developments
- 18.2.3.5. Financials (Based on Availability)
- 18.2.4 Composite Resources Inc
- 18.2.4.1. Overview
- 18.2.4.2. Products
- 18.2.4.3. SWOT Analysis
- 18.2.4.4. Recent Developments
- 18.2.4.5. Financials (Based on Availability)
- 18.2.5 Toray Industries Inc
- 18.2.5.1. Overview
- 18.2.5.2. Products
- 18.2.5.3. SWOT Analysis
- 18.2.5.4. Recent Developments
- 18.2.5.5. Financials (Based on Availability)
- 18.2.6 Sunrez Corporation
- 18.2.6.1. Overview
- 18.2.6.2. Products
- 18.2.6.3. SWOT Analysis
- 18.2.6.4. Recent Developments
- 18.2.6.5. Financials (Based on Availability)
- 18.2.7 Ventec International Group
- 18.2.7.1. Overview
- 18.2.7.2. Products
- 18.2.7.3. SWOT Analysis
- 18.2.7.4. Recent Developments
- 18.2.7.5. Financials (Based on Availability)
- 18.2.8 Axiom Materials
- 18.2.8.1. Overview
- 18.2.8.2. Products
- 18.2.8.3. SWOT Analysis
- 18.2.8.4. Recent Developments
- 18.2.8.5. Financials (Based on Availability)
- 18.2.9 Yokohama Aerospace America Inc
- 18.2.9.1. Overview
- 18.2.9.2. Products
- 18.2.9.3. SWOT Analysis
- 18.2.9.4. Recent Developments
- 18.2.9.5. Financials (Based on Availability)
- 18.2.10 Renegade Materials Corporation
- 18.2.10.1. Overview
- 18.2.10.2. Products
- 18.2.10.3. SWOT Analysis
- 18.2.10.4. Recent Developments
- 18.2.10.5. Financials (Based on Availability)
- 18.2.11 Park Eletrochemical Corp
- 18.2.11.1. Overview
- 18.2.11.2. Products
- 18.2.11.3. SWOT Analysis
- 18.2.11.4. Recent Developments
- 18.2.11.5. Financials (Based on Availability)
- 18.2.12 Mitsubishi Chemical Carbon Fiber and Composites Inc
- 18.2.12.1. Overview
- 18.2.12.2. Products
- 18.2.12.3. SWOT Analysis
- 18.2.12.4. Recent Developments
- 18.2.12.5. Financials (Based on Availability)
- 18.2.13 Hexcel Corporation
- 18.2.13.1. Overview
- 18.2.13.2. Products
- 18.2.13.3. SWOT Analysis
- 18.2.13.4. Recent Developments
- 18.2.13.5. Financials (Based on Availability)
- 18.2.14 Koninklijke Ten Cate BV
- 18.2.14.1. Overview
- 18.2.14.2. Products
- 18.2.14.3. SWOT Analysis
- 18.2.14.4. Recent Developments
- 18.2.14.5. Financials (Based on Availability)
- 18.2.15 Gurit
- 18.2.15.1. Overview
- 18.2.15.2. Products
- 18.2.15.3. SWOT Analysis
- 18.2.15.4. Recent Developments
- 18.2.15.5. Financials (Based on Availability)
- 18.2.16 TEIJIN LIMITED
- 18.2.16.1. Overview
- 18.2.16.2. Products
- 18.2.16.3. SWOT Analysis
- 18.2.16.4. Recent Developments
- 18.2.16.5. Financials (Based on Availability)
- 18.2.17 Zoltek*List Not Exhaustive
- 18.2.17.1. Overview
- 18.2.17.2. Products
- 18.2.17.3. SWOT Analysis
- 18.2.17.4. Recent Developments
- 18.2.17.5. Financials (Based on Availability)
- 18.2.1 SGL Carbon
List of Figures
- Figure 1: Global Prepreg Industry Revenue Breakdown (Million, %) by Region 2024 & 2032
- Figure 2: Global Prepreg Industry Volume Breakdown (K Tons, %) by Region 2024 & 2032
- Figure 3: Asia Pacific Prepreg Industry Revenue (Million), by Country 2024 & 2032
- Figure 4: Asia Pacific Prepreg Industry Volume (K Tons), by Country 2024 & 2032
- Figure 5: Asia Pacific Prepreg Industry Revenue Share (%), by Country 2024 & 2032
- Figure 6: Asia Pacific Prepreg Industry Volume Share (%), by Country 2024 & 2032
- Figure 7: North America Prepreg Industry Revenue (Million), by Country 2024 & 2032
- Figure 8: North America Prepreg Industry Volume (K Tons), by Country 2024 & 2032
- Figure 9: North America Prepreg Industry Revenue Share (%), by Country 2024 & 2032
- Figure 10: North America Prepreg Industry Volume Share (%), by Country 2024 & 2032
- Figure 11: Europe Prepreg Industry Revenue (Million), by Country 2024 & 2032
- Figure 12: Europe Prepreg Industry Volume (K Tons), by Country 2024 & 2032
- Figure 13: Europe Prepreg Industry Revenue Share (%), by Country 2024 & 2032
- Figure 14: Europe Prepreg Industry Volume Share (%), by Country 2024 & 2032
- Figure 15: South America Prepreg Industry Revenue (Million), by Country 2024 & 2032
- Figure 16: South America Prepreg Industry Volume (K Tons), by Country 2024 & 2032
- Figure 17: South America Prepreg Industry Revenue Share (%), by Country 2024 & 2032
- Figure 18: South America Prepreg Industry Volume Share (%), by Country 2024 & 2032
- Figure 19: Middle East Prepreg Industry Revenue (Million), by Country 2024 & 2032
- Figure 20: Middle East Prepreg Industry Volume (K Tons), by Country 2024 & 2032
- Figure 21: Middle East Prepreg Industry Revenue Share (%), by Country 2024 & 2032
- Figure 22: Middle East Prepreg Industry Volume Share (%), by Country 2024 & 2032
- Figure 23: Saudi Arabia Prepreg Industry Revenue (Million), by Country 2024 & 2032
- Figure 24: Saudi Arabia Prepreg Industry Volume (K Tons), by Country 2024 & 2032
- Figure 25: Saudi Arabia Prepreg Industry Revenue Share (%), by Country 2024 & 2032
- Figure 26: Saudi Arabia Prepreg Industry Volume Share (%), by Country 2024 & 2032
- Figure 27: Asia Pacific Prepreg Industry Revenue (Million), by Resin Type 2024 & 2032
- Figure 28: Asia Pacific Prepreg Industry Volume (K Tons), by Resin Type 2024 & 2032
- Figure 29: Asia Pacific Prepreg Industry Revenue Share (%), by Resin Type 2024 & 2032
- Figure 30: Asia Pacific Prepreg Industry Volume Share (%), by Resin Type 2024 & 2032
- Figure 31: Asia Pacific Prepreg Industry Revenue (Million), by Fiber Type 2024 & 2032
- Figure 32: Asia Pacific Prepreg Industry Volume (K Tons), by Fiber Type 2024 & 2032
- Figure 33: Asia Pacific Prepreg Industry Revenue Share (%), by Fiber Type 2024 & 2032
- Figure 34: Asia Pacific Prepreg Industry Volume Share (%), by Fiber Type 2024 & 2032
- Figure 35: Asia Pacific Prepreg Industry Revenue (Million), by End-user Industry 2024 & 2032
- Figure 36: Asia Pacific Prepreg Industry Volume (K Tons), by End-user Industry 2024 & 2032
- Figure 37: Asia Pacific Prepreg Industry Revenue Share (%), by End-user Industry 2024 & 2032
- Figure 38: Asia Pacific Prepreg Industry Volume Share (%), by End-user Industry 2024 & 2032
- Figure 39: Asia Pacific Prepreg Industry Revenue (Million), by Country 2024 & 2032
- Figure 40: Asia Pacific Prepreg Industry Volume (K Tons), by Country 2024 & 2032
- Figure 41: Asia Pacific Prepreg Industry Revenue Share (%), by Country 2024 & 2032
- Figure 42: Asia Pacific Prepreg Industry Volume Share (%), by Country 2024 & 2032
- Figure 43: North America Prepreg Industry Revenue (Million), by Resin Type 2024 & 2032
- Figure 44: North America Prepreg Industry Volume (K Tons), by Resin Type 2024 & 2032
- Figure 45: North America Prepreg Industry Revenue Share (%), by Resin Type 2024 & 2032
- Figure 46: North America Prepreg Industry Volume Share (%), by Resin Type 2024 & 2032
- Figure 47: North America Prepreg Industry Revenue (Million), by Fiber Type 2024 & 2032
- Figure 48: North America Prepreg Industry Volume (K Tons), by Fiber Type 2024 & 2032
- Figure 49: North America Prepreg Industry Revenue Share (%), by Fiber Type 2024 & 2032
- Figure 50: North America Prepreg Industry Volume Share (%), by Fiber Type 2024 & 2032
- Figure 51: North America Prepreg Industry Revenue (Million), by End-user Industry 2024 & 2032
- Figure 52: North America Prepreg Industry Volume (K Tons), by End-user Industry 2024 & 2032
- Figure 53: North America Prepreg Industry Revenue Share (%), by End-user Industry 2024 & 2032
- Figure 54: North America Prepreg Industry Volume Share (%), by End-user Industry 2024 & 2032
- Figure 55: North America Prepreg Industry Revenue (Million), by Country 2024 & 2032
- Figure 56: North America Prepreg Industry Volume (K Tons), by Country 2024 & 2032
- Figure 57: North America Prepreg Industry Revenue Share (%), by Country 2024 & 2032
- Figure 58: North America Prepreg Industry Volume Share (%), by Country 2024 & 2032
- Figure 59: Europe Prepreg Industry Revenue (Million), by Resin Type 2024 & 2032
- Figure 60: Europe Prepreg Industry Volume (K Tons), by Resin Type 2024 & 2032
- Figure 61: Europe Prepreg Industry Revenue Share (%), by Resin Type 2024 & 2032
- Figure 62: Europe Prepreg Industry Volume Share (%), by Resin Type 2024 & 2032
- Figure 63: Europe Prepreg Industry Revenue (Million), by Fiber Type 2024 & 2032
- Figure 64: Europe Prepreg Industry Volume (K Tons), by Fiber Type 2024 & 2032
- Figure 65: Europe Prepreg Industry Revenue Share (%), by Fiber Type 2024 & 2032
- Figure 66: Europe Prepreg Industry Volume Share (%), by Fiber Type 2024 & 2032
- Figure 67: Europe Prepreg Industry Revenue (Million), by End-user Industry 2024 & 2032
- Figure 68: Europe Prepreg Industry Volume (K Tons), by End-user Industry 2024 & 2032
- Figure 69: Europe Prepreg Industry Revenue Share (%), by End-user Industry 2024 & 2032
- Figure 70: Europe Prepreg Industry Volume Share (%), by End-user Industry 2024 & 2032
- Figure 71: Europe Prepreg Industry Revenue (Million), by Country 2024 & 2032
- Figure 72: Europe Prepreg Industry Volume (K Tons), by Country 2024 & 2032
- Figure 73: Europe Prepreg Industry Revenue Share (%), by Country 2024 & 2032
- Figure 74: Europe Prepreg Industry Volume Share (%), by Country 2024 & 2032
- Figure 75: South America Prepreg Industry Revenue (Million), by Resin Type 2024 & 2032
- Figure 76: South America Prepreg Industry Volume (K Tons), by Resin Type 2024 & 2032
- Figure 77: South America Prepreg Industry Revenue Share (%), by Resin Type 2024 & 2032
- Figure 78: South America Prepreg Industry Volume Share (%), by Resin Type 2024 & 2032
- Figure 79: South America Prepreg Industry Revenue (Million), by Fiber Type 2024 & 2032
- Figure 80: South America Prepreg Industry Volume (K Tons), by Fiber Type 2024 & 2032
- Figure 81: South America Prepreg Industry Revenue Share (%), by Fiber Type 2024 & 2032
- Figure 82: South America Prepreg Industry Volume Share (%), by Fiber Type 2024 & 2032
- Figure 83: South America Prepreg Industry Revenue (Million), by End-user Industry 2024 & 2032
- Figure 84: South America Prepreg Industry Volume (K Tons), by End-user Industry 2024 & 2032
- Figure 85: South America Prepreg Industry Revenue Share (%), by End-user Industry 2024 & 2032
- Figure 86: South America Prepreg Industry Volume Share (%), by End-user Industry 2024 & 2032
- Figure 87: South America Prepreg Industry Revenue (Million), by Country 2024 & 2032
- Figure 88: South America Prepreg Industry Volume (K Tons), by Country 2024 & 2032
- Figure 89: South America Prepreg Industry Revenue Share (%), by Country 2024 & 2032
- Figure 90: South America Prepreg Industry Volume Share (%), by Country 2024 & 2032
- Figure 91: Middle East Prepreg Industry Revenue (Million), by Resin Type 2024 & 2032
- Figure 92: Middle East Prepreg Industry Volume (K Tons), by Resin Type 2024 & 2032
- Figure 93: Middle East Prepreg Industry Revenue Share (%), by Resin Type 2024 & 2032
- Figure 94: Middle East Prepreg Industry Volume Share (%), by Resin Type 2024 & 2032
- Figure 95: Middle East Prepreg Industry Revenue (Million), by Fiber Type 2024 & 2032
- Figure 96: Middle East Prepreg Industry Volume (K Tons), by Fiber Type 2024 & 2032
- Figure 97: Middle East Prepreg Industry Revenue Share (%), by Fiber Type 2024 & 2032
- Figure 98: Middle East Prepreg Industry Volume Share (%), by Fiber Type 2024 & 2032
- Figure 99: Middle East Prepreg Industry Revenue (Million), by End-user Industry 2024 & 2032
- Figure 100: Middle East Prepreg Industry Volume (K Tons), by End-user Industry 2024 & 2032
- Figure 101: Middle East Prepreg Industry Revenue Share (%), by End-user Industry 2024 & 2032
- Figure 102: Middle East Prepreg Industry Volume Share (%), by End-user Industry 2024 & 2032
- Figure 103: Middle East Prepreg Industry Revenue (Million), by Country 2024 & 2032
- Figure 104: Middle East Prepreg Industry Volume (K Tons), by Country 2024 & 2032
- Figure 105: Middle East Prepreg Industry Revenue Share (%), by Country 2024 & 2032
- Figure 106: Middle East Prepreg Industry Volume Share (%), by Country 2024 & 2032
- Figure 107: Saudi Arabia Prepreg Industry Revenue (Million), by Resin Type 2024 & 2032
- Figure 108: Saudi Arabia Prepreg Industry Volume (K Tons), by Resin Type 2024 & 2032
- Figure 109: Saudi Arabia Prepreg Industry Revenue Share (%), by Resin Type 2024 & 2032
- Figure 110: Saudi Arabia Prepreg Industry Volume Share (%), by Resin Type 2024 & 2032
- Figure 111: Saudi Arabia Prepreg Industry Revenue (Million), by Fiber Type 2024 & 2032
- Figure 112: Saudi Arabia Prepreg Industry Volume (K Tons), by Fiber Type 2024 & 2032
- Figure 113: Saudi Arabia Prepreg Industry Revenue Share (%), by Fiber Type 2024 & 2032
- Figure 114: Saudi Arabia Prepreg Industry Volume Share (%), by Fiber Type 2024 & 2032
- Figure 115: Saudi Arabia Prepreg Industry Revenue (Million), by End-user Industry 2024 & 2032
- Figure 116: Saudi Arabia Prepreg Industry Volume (K Tons), by End-user Industry 2024 & 2032
- Figure 117: Saudi Arabia Prepreg Industry Revenue Share (%), by End-user Industry 2024 & 2032
- Figure 118: Saudi Arabia Prepreg Industry Volume Share (%), by End-user Industry 2024 & 2032
- Figure 119: Saudi Arabia Prepreg Industry Revenue (Million), by Country 2024 & 2032
- Figure 120: Saudi Arabia Prepreg Industry Volume (K Tons), by Country 2024 & 2032
- Figure 121: Saudi Arabia Prepreg Industry Revenue Share (%), by Country 2024 & 2032
- Figure 122: Saudi Arabia Prepreg Industry Volume Share (%), by Country 2024 & 2032
List of Tables
- Table 1: Global Prepreg Industry Revenue Million Forecast, by Region 2019 & 2032
- Table 2: Global Prepreg Industry Volume K Tons Forecast, by Region 2019 & 2032
- Table 3: Global Prepreg Industry Revenue Million Forecast, by Resin Type 2019 & 2032
- Table 4: Global Prepreg Industry Volume K Tons Forecast, by Resin Type 2019 & 2032
- Table 5: Global Prepreg Industry Revenue Million Forecast, by Fiber Type 2019 & 2032
- Table 6: Global Prepreg Industry Volume K Tons Forecast, by Fiber Type 2019 & 2032
- Table 7: Global Prepreg Industry Revenue Million Forecast, by End-user Industry 2019 & 2032
- Table 8: Global Prepreg Industry Volume K Tons Forecast, by End-user Industry 2019 & 2032
- Table 9: Global Prepreg Industry Revenue Million Forecast, by Region 2019 & 2032
- Table 10: Global Prepreg Industry Volume K Tons Forecast, by Region 2019 & 2032
- Table 11: Global Prepreg Industry Revenue Million Forecast, by Country 2019 & 2032
- Table 12: Global Prepreg Industry Volume K Tons Forecast, by Country 2019 & 2032
- Table 13: China Prepreg Industry Revenue (Million) Forecast, by Application 2019 & 2032
- Table 14: China Prepreg Industry Volume (K Tons) Forecast, by Application 2019 & 2032
- Table 15: India Prepreg Industry Revenue (Million) Forecast, by Application 2019 & 2032
- Table 16: India Prepreg Industry Volume (K Tons) Forecast, by Application 2019 & 2032
- Table 17: Japan Prepreg Industry Revenue (Million) Forecast, by Application 2019 & 2032
- Table 18: Japan Prepreg Industry Volume (K Tons) Forecast, by Application 2019 & 2032
- Table 19: South Korea Prepreg Industry Revenue (Million) Forecast, by Application 2019 & 2032
- Table 20: South Korea Prepreg Industry Volume (K Tons) Forecast, by Application 2019 & 2032
- Table 21: Rest of Asia Pacific Prepreg Industry Revenue (Million) Forecast, by Application 2019 & 2032
- Table 22: Rest of Asia Pacific Prepreg Industry Volume (K Tons) Forecast, by Application 2019 & 2032
- Table 23: Global Prepreg Industry Revenue Million Forecast, by Country 2019 & 2032
- Table 24: Global Prepreg Industry Volume K Tons Forecast, by Country 2019 & 2032
- Table 25: United States Prepreg Industry Revenue (Million) Forecast, by Application 2019 & 2032
- Table 26: United States Prepreg Industry Volume (K Tons) Forecast, by Application 2019 & 2032
- Table 27: Canada Prepreg Industry Revenue (Million) Forecast, by Application 2019 & 2032
- Table 28: Canada Prepreg Industry Volume (K Tons) Forecast, by Application 2019 & 2032
- Table 29: Mexico Prepreg Industry Revenue (Million) Forecast, by Application 2019 & 2032
- Table 30: Mexico Prepreg Industry Volume (K Tons) Forecast, by Application 2019 & 2032
- Table 31: Global Prepreg Industry Revenue Million Forecast, by Country 2019 & 2032
- Table 32: Global Prepreg Industry Volume K Tons Forecast, by Country 2019 & 2032
- Table 33: Germany Prepreg Industry Revenue (Million) Forecast, by Application 2019 & 2032
- Table 34: Germany Prepreg Industry Volume (K Tons) Forecast, by Application 2019 & 2032
- Table 35: United Kingdom Prepreg Industry Revenue (Million) Forecast, by Application 2019 & 2032
- Table 36: United Kingdom Prepreg Industry Volume (K Tons) Forecast, by Application 2019 & 2032
- Table 37: Italy Prepreg Industry Revenue (Million) Forecast, by Application 2019 & 2032
- Table 38: Italy Prepreg Industry Volume (K Tons) Forecast, by Application 2019 & 2032
- Table 39: France Prepreg Industry Revenue (Million) Forecast, by Application 2019 & 2032
- Table 40: France Prepreg Industry Volume (K Tons) Forecast, by Application 2019 & 2032
- Table 41: Rest of Europe Prepreg Industry Revenue (Million) Forecast, by Application 2019 & 2032
- Table 42: Rest of Europe Prepreg Industry Volume (K Tons) Forecast, by Application 2019 & 2032
- Table 43: Global Prepreg Industry Revenue Million Forecast, by Country 2019 & 2032
- Table 44: Global Prepreg Industry Volume K Tons Forecast, by Country 2019 & 2032
- Table 45: Brazil Prepreg Industry Revenue (Million) Forecast, by Application 2019 & 2032
- Table 46: Brazil Prepreg Industry Volume (K Tons) Forecast, by Application 2019 & 2032
- Table 47: Argentina Prepreg Industry Revenue (Million) Forecast, by Application 2019 & 2032
- Table 48: Argentina Prepreg Industry Volume (K Tons) Forecast, by Application 2019 & 2032
- Table 49: Rest of South America Prepreg Industry Revenue (Million) Forecast, by Application 2019 & 2032
- Table 50: Rest of South America Prepreg Industry Volume (K Tons) Forecast, by Application 2019 & 2032
- Table 51: Global Prepreg Industry Revenue Million Forecast, by Country 2019 & 2032
- Table 52: Global Prepreg Industry Volume K Tons Forecast, by Country 2019 & 2032
- Table 53: Prepreg Industry Revenue (Million) Forecast, by Application 2019 & 2032
- Table 54: Prepreg Industry Volume (K Tons) Forecast, by Application 2019 & 2032
- Table 55: Global Prepreg Industry Revenue Million Forecast, by Country 2019 & 2032
- Table 56: Global Prepreg Industry Volume K Tons Forecast, by Country 2019 & 2032
- Table 57: South Africa Prepreg Industry Revenue (Million) Forecast, by Application 2019 & 2032
- Table 58: South Africa Prepreg Industry Volume (K Tons) Forecast, by Application 2019 & 2032
- Table 59: Rest of Middle East Prepreg Industry Revenue (Million) Forecast, by Application 2019 & 2032
- Table 60: Rest of Middle East Prepreg Industry Volume (K Tons) Forecast, by Application 2019 & 2032
- Table 61: Global Prepreg Industry Revenue Million Forecast, by Resin Type 2019 & 2032
- Table 62: Global Prepreg Industry Volume K Tons Forecast, by Resin Type 2019 & 2032
- Table 63: Global Prepreg Industry Revenue Million Forecast, by Fiber Type 2019 & 2032
- Table 64: Global Prepreg Industry Volume K Tons Forecast, by Fiber Type 2019 & 2032
- Table 65: Global Prepreg Industry Revenue Million Forecast, by End-user Industry 2019 & 2032
- Table 66: Global Prepreg Industry Volume K Tons Forecast, by End-user Industry 2019 & 2032
- Table 67: Global Prepreg Industry Revenue Million Forecast, by Country 2019 & 2032
- Table 68: Global Prepreg Industry Volume K Tons Forecast, by Country 2019 & 2032
- Table 69: China Prepreg Industry Revenue (Million) Forecast, by Application 2019 & 2032
- Table 70: China Prepreg Industry Volume (K Tons) Forecast, by Application 2019 & 2032
- Table 71: India Prepreg Industry Revenue (Million) Forecast, by Application 2019 & 2032
- Table 72: India Prepreg Industry Volume (K Tons) Forecast, by Application 2019 & 2032
- Table 73: Japan Prepreg Industry Revenue (Million) Forecast, by Application 2019 & 2032
- Table 74: Japan Prepreg Industry Volume (K Tons) Forecast, by Application 2019 & 2032
- Table 75: South Korea Prepreg Industry Revenue (Million) Forecast, by Application 2019 & 2032
- Table 76: South Korea Prepreg Industry Volume (K Tons) Forecast, by Application 2019 & 2032
- Table 77: Rest of Asia Pacific Prepreg Industry Revenue (Million) Forecast, by Application 2019 & 2032
- Table 78: Rest of Asia Pacific Prepreg Industry Volume (K Tons) Forecast, by Application 2019 & 2032
- Table 79: Global Prepreg Industry Revenue Million Forecast, by Resin Type 2019 & 2032
- Table 80: Global Prepreg Industry Volume K Tons Forecast, by Resin Type 2019 & 2032
- Table 81: Global Prepreg Industry Revenue Million Forecast, by Fiber Type 2019 & 2032
- Table 82: Global Prepreg Industry Volume K Tons Forecast, by Fiber Type 2019 & 2032
- Table 83: Global Prepreg Industry Revenue Million Forecast, by End-user Industry 2019 & 2032
- Table 84: Global Prepreg Industry Volume K Tons Forecast, by End-user Industry 2019 & 2032
- Table 85: Global Prepreg Industry Revenue Million Forecast, by Country 2019 & 2032
- Table 86: Global Prepreg Industry Volume K Tons Forecast, by Country 2019 & 2032
- Table 87: United States Prepreg Industry Revenue (Million) Forecast, by Application 2019 & 2032
- Table 88: United States Prepreg Industry Volume (K Tons) Forecast, by Application 2019 & 2032
- Table 89: Canada Prepreg Industry Revenue (Million) Forecast, by Application 2019 & 2032
- Table 90: Canada Prepreg Industry Volume (K Tons) Forecast, by Application 2019 & 2032
- Table 91: Mexico Prepreg Industry Revenue (Million) Forecast, by Application 2019 & 2032
- Table 92: Mexico Prepreg Industry Volume (K Tons) Forecast, by Application 2019 & 2032
- Table 93: Global Prepreg Industry Revenue Million Forecast, by Resin Type 2019 & 2032
- Table 94: Global Prepreg Industry Volume K Tons Forecast, by Resin Type 2019 & 2032
- Table 95: Global Prepreg Industry Revenue Million Forecast, by Fiber Type 2019 & 2032
- Table 96: Global Prepreg Industry Volume K Tons Forecast, by Fiber Type 2019 & 2032
- Table 97: Global Prepreg Industry Revenue Million Forecast, by End-user Industry 2019 & 2032
- Table 98: Global Prepreg Industry Volume K Tons Forecast, by End-user Industry 2019 & 2032
- Table 99: Global Prepreg Industry Revenue Million Forecast, by Country 2019 & 2032
- Table 100: Global Prepreg Industry Volume K Tons Forecast, by Country 2019 & 2032
- Table 101: Germany Prepreg Industry Revenue (Million) Forecast, by Application 2019 & 2032
- Table 102: Germany Prepreg Industry Volume (K Tons) Forecast, by Application 2019 & 2032
- Table 103: United Kingdom Prepreg Industry Revenue (Million) Forecast, by Application 2019 & 2032
- Table 104: United Kingdom Prepreg Industry Volume (K Tons) Forecast, by Application 2019 & 2032
- Table 105: Italy Prepreg Industry Revenue (Million) Forecast, by Application 2019 & 2032
- Table 106: Italy Prepreg Industry Volume (K Tons) Forecast, by Application 2019 & 2032
- Table 107: France Prepreg Industry Revenue (Million) Forecast, by Application 2019 & 2032
- Table 108: France Prepreg Industry Volume (K Tons) Forecast, by Application 2019 & 2032
- Table 109: Rest of Europe Prepreg Industry Revenue (Million) Forecast, by Application 2019 & 2032
- Table 110: Rest of Europe Prepreg Industry Volume (K Tons) Forecast, by Application 2019 & 2032
- Table 111: Global Prepreg Industry Revenue Million Forecast, by Resin Type 2019 & 2032
- Table 112: Global Prepreg Industry Volume K Tons Forecast, by Resin Type 2019 & 2032
- Table 113: Global Prepreg Industry Revenue Million Forecast, by Fiber Type 2019 & 2032
- Table 114: Global Prepreg Industry Volume K Tons Forecast, by Fiber Type 2019 & 2032
- Table 115: Global Prepreg Industry Revenue Million Forecast, by End-user Industry 2019 & 2032
- Table 116: Global Prepreg Industry Volume K Tons Forecast, by End-user Industry 2019 & 2032
- Table 117: Global Prepreg Industry Revenue Million Forecast, by Country 2019 & 2032
- Table 118: Global Prepreg Industry Volume K Tons Forecast, by Country 2019 & 2032
- Table 119: Brazil Prepreg Industry Revenue (Million) Forecast, by Application 2019 & 2032
- Table 120: Brazil Prepreg Industry Volume (K Tons) Forecast, by Application 2019 & 2032
- Table 121: Argentina Prepreg Industry Revenue (Million) Forecast, by Application 2019 & 2032
- Table 122: Argentina Prepreg Industry Volume (K Tons) Forecast, by Application 2019 & 2032
- Table 123: Rest of South America Prepreg Industry Revenue (Million) Forecast, by Application 2019 & 2032
- Table 124: Rest of South America Prepreg Industry Volume (K Tons) Forecast, by Application 2019 & 2032
- Table 125: Global Prepreg Industry Revenue Million Forecast, by Resin Type 2019 & 2032
- Table 126: Global Prepreg Industry Volume K Tons Forecast, by Resin Type 2019 & 2032
- Table 127: Global Prepreg Industry Revenue Million Forecast, by Fiber Type 2019 & 2032
- Table 128: Global Prepreg Industry Volume K Tons Forecast, by Fiber Type 2019 & 2032
- Table 129: Global Prepreg Industry Revenue Million Forecast, by End-user Industry 2019 & 2032
- Table 130: Global Prepreg Industry Volume K Tons Forecast, by End-user Industry 2019 & 2032
- Table 131: Global Prepreg Industry Revenue Million Forecast, by Country 2019 & 2032
- Table 132: Global Prepreg Industry Volume K Tons Forecast, by Country 2019 & 2032
- Table 133: Global Prepreg Industry Revenue Million Forecast, by Resin Type 2019 & 2032
- Table 134: Global Prepreg Industry Volume K Tons Forecast, by Resin Type 2019 & 2032
- Table 135: Global Prepreg Industry Revenue Million Forecast, by Fiber Type 2019 & 2032
- Table 136: Global Prepreg Industry Volume K Tons Forecast, by Fiber Type 2019 & 2032
- Table 137: Global Prepreg Industry Revenue Million Forecast, by End-user Industry 2019 & 2032
- Table 138: Global Prepreg Industry Volume K Tons Forecast, by End-user Industry 2019 & 2032
- Table 139: Global Prepreg Industry Revenue Million Forecast, by Country 2019 & 2032
- Table 140: Global Prepreg Industry Volume K Tons Forecast, by Country 2019 & 2032
- Table 141: South Africa Prepreg Industry Revenue (Million) Forecast, by Application 2019 & 2032
- Table 142: South Africa Prepreg Industry Volume (K Tons) Forecast, by Application 2019 & 2032
- Table 143: Rest of Middle East Prepreg Industry Revenue (Million) Forecast, by Application 2019 & 2032
- Table 144: Rest of Middle East Prepreg Industry Volume (K Tons) Forecast, by Application 2019 & 2032
Frequently Asked Questions
1. What is the projected Compound Annual Growth Rate (CAGR) of the Prepreg Industry?
The projected CAGR is approximately 4.00%.
2. Which companies are prominent players in the Prepreg Industry?
Key companies in the market include SGL Carbon, Isola Group, Solvay, Composite Resources Inc, Toray Industries Inc, Sunrez Corporation, Ventec International Group, Axiom Materials, Yokohama Aerospace America Inc, Renegade Materials Corporation, Park Eletrochemical Corp, Mitsubishi Chemical Carbon Fiber and Composites Inc, Hexcel Corporation, Koninklijke Ten Cate BV, Gurit, TEIJIN LIMITED, Zoltek*List Not Exhaustive.
3. What are the main segments of the Prepreg Industry?
The market segments include Resin Type, Fiber Type, End-user Industry.
4. Can you provide details about the market size?
The market size is estimated to be USD XX Million as of 2022.
5. What are some drivers contributing to market growth?
Growing Demand from the Aerospace and Defense Sector; Growing Demand from the Wind Sector; Increased Adoption of Carbon Prepreg.
6. What are the notable trends driving market growth?
Aerospace and Defense Industry to Drive the Market.
7. Are there any restraints impacting market growth?
Autoclave and Maintenance Constraints.
8. Can you provide examples of recent developments in the market?
N/A
9. What pricing options are available for accessing the report?
Pricing options include single-user, multi-user, and enterprise licenses priced at USD 4750, USD 5250, and USD 8750 respectively.
10. Is the market size provided in terms of value or volume?
The market size is provided in terms of value, measured in Million and volume, measured in K Tons.
11. Are there any specific market keywords associated with the report?
Yes, the market keyword associated with the report is "Prepreg Industry," which aids in identifying and referencing the specific market segment covered.
12. How do I determine which pricing option suits my needs best?
The pricing options vary based on user requirements and access needs. Individual users may opt for single-user licenses, while businesses requiring broader access may choose multi-user or enterprise licenses for cost-effective access to the report.
13. Are there any additional resources or data provided in the Prepreg Industry report?
While the report offers comprehensive insights, it's advisable to review the specific contents or supplementary materials provided to ascertain if additional resources or data are available.
14. How can I stay updated on further developments or reports in the Prepreg Industry?
To stay informed about further developments, trends, and reports in the Prepreg Industry, consider subscribing to industry newsletters, following relevant companies and organizations, or regularly checking reputable industry news sources and publications.
Methodology
Step 1 - Identification of Relevant Samples Size from Population Database


Step 2 - Approaches for Defining Global Market Size (Value, Volume* & Price*)

Note*: In applicable scenarios
Step 3 - Data Sources
Primary Research
- Web Analytics
- Survey Reports
- Research Institute
- Latest Research Reports
- Opinion Leaders
Secondary Research
- Annual Reports
- White Paper
- Latest Press Release
- Industry Association
- Paid Database
- Investor Presentations

Step 4 - Data Triangulation
Involves using different sources of information in order to increase the validity of a study
These sources are likely to be stakeholders in a program - participants, other researchers, program staff, other community members, and so on.
Then we put all data in single framework & apply various statistical tools to find out the dynamic on the market.
During the analysis stage, feedback from the stakeholder groups would be compared to determine areas of agreement as well as areas of divergence
