

Key Insights
The global prisms and prism modules market is poised for significant expansion, projected to reach USD 2.5 billion by 2024, with a Compound Annual Growth Rate (CAGR) of 12.8% through 2033. This robust growth is primarily driven by escalating demand from the digital camera and smartphone sectors, which require advanced optical components for superior imaging. The increasing integration of sophisticated camera systems in mobile devices and the growing popularity of high-resolution digital cameras are key factors. Furthermore, expanding applications in projectors, augmented reality (AR), and virtual reality (VR) devices are contributing to market momentum. The "Other" segment, including medical imaging, scientific instruments, and industrial inspection, also shows promising growth due to ongoing technological innovation.
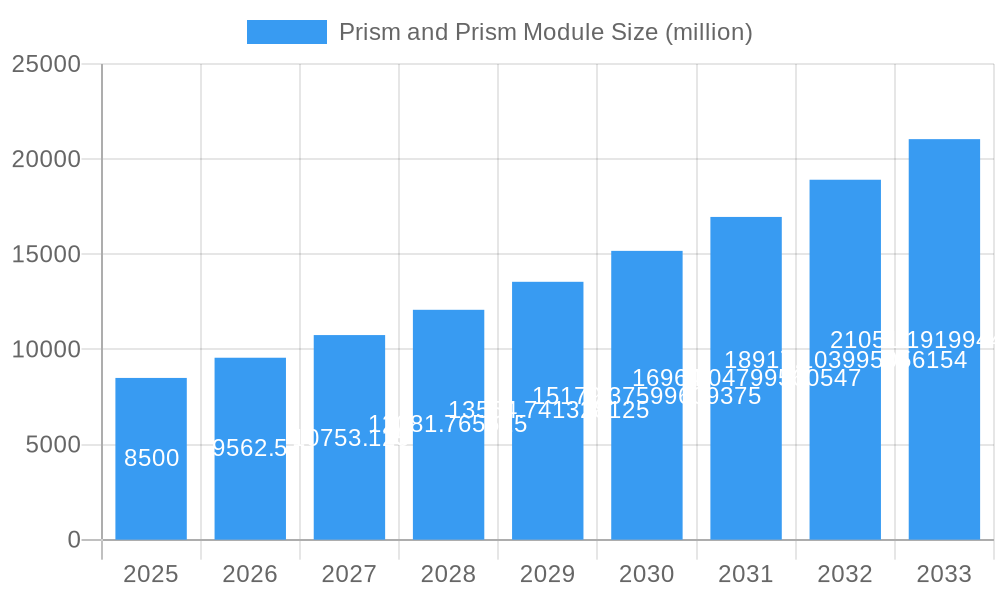
Prism and Prism Module Market Size (In Billion)
Key market trends include the integration of miniaturized, high-performance prism modules into compact electronic devices, driven by consumer demand for sleeker designs and enhanced functionality. Advancements in material science and manufacturing are enabling more efficient and cost-effective prism production, fostering wider adoption. However, market restraints include the high cost of advanced manufacturing processes and intense competition, necessitating continuous innovation and strategic pricing. Geographically, the Asia Pacific region, particularly China, is expected to lead the market due to its strong manufacturing base and rapidly growing consumer electronics industry. North America and Europe also represent substantial markets, fueled by technological advancements and demand for premium imaging solutions. Leading companies such as Sunny Optical Technology, OFILM Group, and LG Innotek are actively investing in research and development to secure market share.
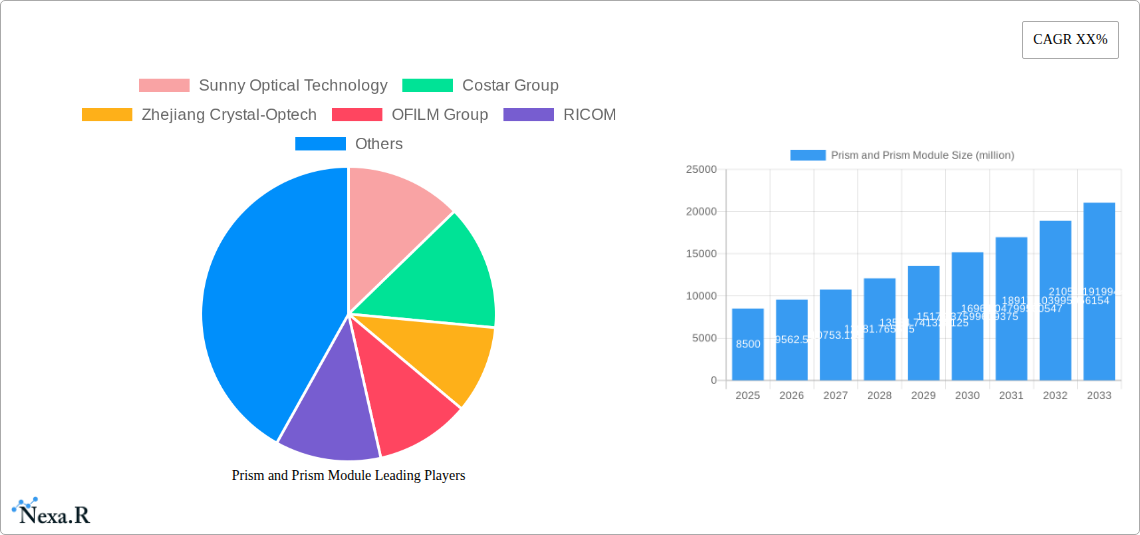
Prism and Prism Module Company Market Share
Prism and Prism Module Market Dynamics & Structure
The global Prism and Prism Module market is characterized by a moderate to high degree of market concentration, driven by a few key players. Technological innovation is a primary driver, with advancements in optical coatings, miniaturization, and integrated functionalities pushing the boundaries of performance and application. Regulatory frameworks, while not overtly restrictive, often pertain to quality standards and environmental compliance, indirectly influencing manufacturing processes and material choices. Competitive product substitutes, such as advanced lens systems and digital image processing, pose a constant threat, necessitating continuous innovation in prism and prism module technology to maintain market relevance. End-user demographics are diverse, spanning consumer electronics, automotive, industrial automation, and scientific instrumentation. Mergers and acquisitions (M&A) trends are evident, as larger entities seek to consolidate market share, acquire cutting-edge technologies, and expand their product portfolios.
- Market Concentration: Dominated by a mix of established optical component manufacturers and emerging technology firms.
- Technological Innovation Drivers: Miniaturization, improved optical efficiency, increased durability, and integration with advanced sensing technologies.
- Regulatory Frameworks: Focus on optical performance standards, safety certifications, and environmental sustainability in material sourcing.
- Competitive Product Substitutes: High-resolution digital imaging sensors, advanced lens assemblies, and sophisticated image processing algorithms.
- End-User Demographics: Primarily smartphones, digital cameras, projectors, augmented/virtual reality devices, automotive sensors, and medical imaging equipment.
- M&A Trends: Strategic acquisitions to gain market share, secure intellectual property, and expand into new application segments.
Prism and Prism Module Growth Trends & Insights
The Prism and Prism Module market is projected for robust growth over the forecast period, driven by an escalating demand across various high-growth sectors. The estimated market size for Prism and Prism Module is projected to reach $18,500 million units in 2025, exhibiting a Compound Annual Growth Rate (CAGR) of approximately 6.5% from 2019 to 2033. This expansion is underpinned by an increasing adoption rate of advanced optical components in smartphones, fueling the demand for sophisticated camera systems incorporating prisms for optical stabilization, zoom functionalities, and enhanced image quality. Similarly, the burgeoning projector market, encompassing home entertainment, business presentations, and large-scale installations, is a significant contributor to market growth, with an increasing preference for compact and high-definition projection solutions.
Technological disruptions are continuously reshaping the market landscape. The integration of prisms within augmented reality (AR) and virtual reality (VR) headsets represents a significant emerging application, promising immersive visual experiences that will likely drive substantial future demand. Furthermore, advancements in micro-prism technologies are enabling further miniaturization and improved performance, making them indispensable in a wider array of compact electronic devices. Consumer behavior shifts towards higher-quality visual content consumption and the demand for advanced imaging capabilities in personal devices are acting as powerful catalysts. The growing reliance on sophisticated imaging and sensing technologies in the automotive sector for advanced driver-assistance systems (ADAS) and autonomous driving is another key growth driver, where prisms play a crucial role in lidar and camera systems. The market penetration of devices utilizing advanced optical components is expected to deepen as innovation continues and costs become more accessible. The historical period from 2019 to 2024 witnessed steady growth, setting a strong foundation for the accelerated expansion anticipated in the coming years.
Dominant Regions, Countries, or Segments in Prism and Prism Module
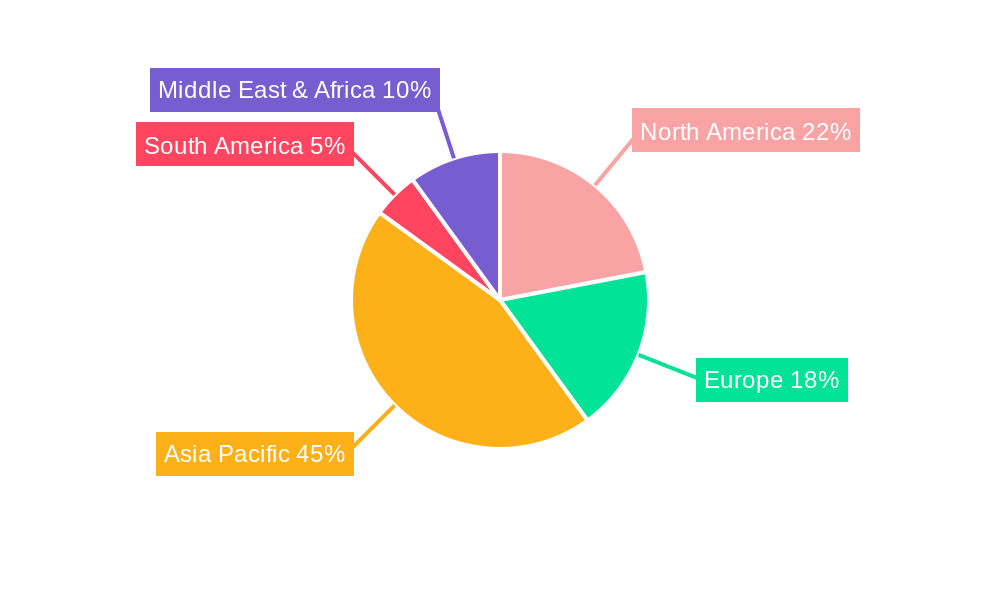
The global Prism and Prism Module market's growth is significantly influenced by a combination of regional economic strengths, technological adoption rates, and the concentration of key manufacturing hubs. Asia-Pacific, particularly China, is emerging as the dominant region, driven by its colossal manufacturing capabilities and its central role in the global consumer electronics supply chain. The region's dominance is further solidified by its large domestic market for smartphones and digital cameras, coupled with significant investments in research and development for advanced optical technologies. South Korea and Japan also play pivotal roles within this region, being home to leading technology companies that are at the forefront of optical innovation and high-volume production.
Within the Application segment, Smartphones are unequivocally the most dominant force, accounting for a substantial portion of the market. The relentless demand for enhanced camera features, including multi-lens systems, optical zoom, and advanced image stabilization, directly translates into a massive requirement for sophisticated prisms and prism modules. This segment's growth is further propelled by emerging trends like foldable smartphones and the integration of computational photography, which rely heavily on precise optical components. The Types segment also sees Prism Modules as a key driver, as integrated modules offer greater convenience, smaller form factors, and enhanced performance for manufacturers, streamlining production processes.
- Dominant Region: Asia-Pacific (especially China, South Korea, Japan)
- Key Drivers: High manufacturing capacity, strong consumer electronics demand, leading technology companies, substantial R&D investments, government support for technology sectors.
- Market Share: Asia-Pacific is estimated to hold over 55% of the global market share.
- Growth Potential: Continued innovation, expansion into new applications like AR/VR, and increasing export markets.
- Dominant Application Segment: Smartphones
- Key Drivers: Multi-lens camera systems, optical image stabilization (OIS), periscope zoom lenses, miniaturization of components, demand for high-quality imaging.
- Market Share: Smartphones are estimated to contribute over 40% to the total market revenue.
- Growth Potential: Increasing adoption of advanced camera technologies in mid-range and budget smartphones, continuous innovation in smartphone photography.
- Dominant Type Segment: Prism Modules
- Key Drivers: Ease of integration for manufacturers, reduced assembly complexity, consistent performance, smaller footprints compared to discrete prisms.
- Market Share: Prism Modules are estimated to hold approximately 60% of the total market volume.
- Growth Potential: Advancements in module design, integration of additional optical elements, and customized solutions for specific applications.
Prism and Prism Module Product Landscape
The Prism and Prism Module product landscape is characterized by continuous innovation focused on enhancing optical performance, miniaturization, and integration. Key product innovations include advanced anti-reflective coatings that minimize light loss and ghosting, thereby improving image clarity and brightness, especially in challenging lighting conditions. High-precision manufacturing techniques enable the production of compact prisms and modules suitable for integration into increasingly smaller electronic devices like smartphones and wearable technology. Furthermore, the development of specialized prisms, such as Dove prisms for image rotation and roof prisms for image inversion, caters to specific application needs in fields like surveying, photography, and scientific instrumentation. The trend towards integrated prism modules, which combine multiple optical elements into a single, robust unit, streamlines assembly processes for end-product manufacturers and guarantees consistent optical alignment, contributing to improved device reliability and performance.
Key Drivers, Barriers & Challenges in Prism and Prism Module
Key Drivers: The Prism and Prism Module market is propelled by several significant factors. The relentless demand for advanced imaging capabilities in consumer electronics, particularly smartphones with multi-lens camera systems and sophisticated zoom functionalities, is a primary driver. The burgeoning growth of the augmented reality (AR) and virtual reality (VR) sectors, which rely heavily on precise optical components for immersive experiences, presents a substantial growth opportunity. Furthermore, the increasing adoption of optical sensing technologies in the automotive industry for advanced driver-assistance systems (ADAS) and autonomous driving applications is a critical growth accelerator. Technological advancements in optical coatings and miniaturization techniques are enabling the development of more compact, efficient, and high-performance prisms and modules, catering to the ever-shrinking form factors of modern devices.
Barriers & Challenges: Despite strong growth prospects, the market faces several challenges. The supply chain for specialized optical materials and precision manufacturing can be complex and susceptible to disruptions, impacting lead times and costs. Intense competition from alternative technologies, such as advanced lens systems and digital image processing, necessitates continuous innovation and competitive pricing. High R&D investment requirements to stay ahead in optical technology can be a barrier for smaller players. Stringent quality control and precision manufacturing standards are critical, and deviations can lead to product failures and reputational damage. Fluctuations in raw material costs, particularly for specialized glass and coatings, can impact profitability.
Emerging Opportunities in Prism and Prism Module
Emerging opportunities in the Prism and Prism Module sector are largely driven by the expansion of existing applications and the creation of new ones. The rapid growth of the metaverse and extended reality (XR) technologies presents a significant avenue for advanced prism and prism module applications, enabling more realistic and immersive virtual experiences in AR/VR headsets. The automotive sector's ongoing transition towards autonomous driving is creating a growing demand for high-performance optical components, including prisms, for lidar systems, cameras, and sensor fusion technologies. Furthermore, the miniaturization trend in medical devices, such as endoscopes and portable diagnostic equipment, opens up opportunities for compact and highly precise prism solutions. The integration of advanced optical functionalities into the Internet of Things (IoT) devices, for sensing and monitoring purposes, is another burgeoning area.
Growth Accelerators in the Prism and Prism Module Industry
The long-term growth of the Prism and Prism Module industry is being significantly accelerated by several key catalysts. Continued breakthroughs in materials science are leading to the development of novel optical glasses and coatings with enhanced properties, such as higher refractive indices and superior transmission capabilities, enabling more efficient and compact optical designs. Strategic partnerships between prism manufacturers and leading consumer electronics, automotive, and technology companies are crucial for co-developing customized solutions and ensuring market integration. Market expansion strategies, including the penetration into emerging economies with growing demand for advanced consumer electronics and automotive technologies, will further fuel growth. Investments in automated manufacturing processes and advanced quality control systems are also accelerating production efficiency and scalability, allowing for higher output to meet increasing global demand.
Key Players Shaping the Prism and Prism Module Market
- Sunny Optical Technology
- Costar Group
- Zhejiang Crystal-Optech
- OFILM Group
- RICOM
- Hubei Wufang Photoelectric
- Asia Optical
- Optron-Tec
- LG Innotek
- Semco
- Foxconn
- Luxvisions
- Primax
- Chicony
- Cowell
- Partron
Notable Milestones in Prism and Prism Module Sector
- 2020: Launch of advanced periscope zoom lens modules incorporating sophisticated prism designs in flagship smartphones.
- 2021: Increased M&A activity with larger optical component suppliers acquiring specialized prism manufacturers to bolster their portfolios.
- 2022: Significant advancements in AR/VR headset technology, leading to the adoption of novel prism configurations for enhanced field of view and display resolution.
- 2023: Growing integration of prism-based sensors in automotive lidar systems for improved object detection and navigation accuracy.
- 2024: Introduction of ultra-compact prism modules for next-generation wearable devices and medical imaging equipment.
- 2025 (Estimated): Expected widespread adoption of advanced anti-reflective coatings on prisms, reducing light loss by up to 2% and improving overall optical efficiency across various applications.
- 2026 (Projected): Emergence of innovative prism designs for holographic displays and advanced projection systems in commercial and entertainment sectors.
- 2027 (Projected): Continued miniaturization of prism modules, enabling their integration into even smaller and more complex electronic devices.
In-Depth Prism and Prism Module Market Outlook
The outlook for the Prism and Prism Module market remains exceptionally positive, driven by sustained technological innovation and burgeoning demand across a spectrum of high-growth industries. The market is poised for continued expansion, fueled by the relentless pursuit of enhanced visual experiences in consumer electronics, the critical role of optical sensing in the automotive sector's autonomous drive, and the transformative potential of AR/VR technologies. Strategic partnerships and ongoing investments in R&D are set to unlock new applications and optimize existing ones, ensuring that prisms and prism modules remain integral to the advancement of optical technology. The increasing adoption in emerging markets and the development of more efficient manufacturing processes will further accelerate market growth, presenting significant opportunities for stakeholders.
Prism and Prism Module Segmentation
-
1. Application
- 1.1. Digital Camera
- 1.2. Projector
- 1.3. Smartphone
- 1.4. Other
-
2. Types
- 2.1. Prism
- 2.2. Prism Module
Prism and Prism Module Segmentation By Geography
-
1. North America
- 1.1. United States
- 1.2. Canada
- 1.3. Mexico
-
2. South America
- 2.1. Brazil
- 2.2. Argentina
- 2.3. Rest of South America
-
3. Europe
- 3.1. United Kingdom
- 3.2. Germany
- 3.3. France
- 3.4. Italy
- 3.5. Spain
- 3.6. Russia
- 3.7. Benelux
- 3.8. Nordics
- 3.9. Rest of Europe
-
4. Middle East & Africa
- 4.1. Turkey
- 4.2. Israel
- 4.3. GCC
- 4.4. North Africa
- 4.5. South Africa
- 4.6. Rest of Middle East & Africa
-
5. Asia Pacific
- 5.1. China
- 5.2. India
- 5.3. Japan
- 5.4. South Korea
- 5.5. ASEAN
- 5.6. Oceania
- 5.7. Rest of Asia Pacific
Prism and Prism Module Regional Market Share
Geographic Coverage of Prism and Prism Module
Prism and Prism Module REPORT HIGHLIGHTS
| Aspects | Details |
|---|---|
| Study Period | 2020-2034 |
| Base Year | 2025 |
| Estimated Year | 2026 |
| Forecast Period | 2026-2034 |
| Historical Period | 2020-2025 |
| Growth Rate | CAGR of 12.8% from 2020-2034 |
| Segmentation |
|
Table of Contents
- 1. Introduction
- 1.1. Research Scope
- 1.2. Market Segmentation
- 1.3. Research Objective
- 1.4. Definitions and Assumptions
- 2. Executive Summary
- 2.1. Market Snapshot
- 3. Market Dynamics
- 3.1. Market Drivers
- 3.2. Market Restrains
- 3.3. Market Trends
- 3.4. Market Opportunities
- 4. Market Factor Analysis
- 4.1. Porters Five Forces
- 4.1.1. Bargaining Power of Suppliers
- 4.1.2. Bargaining Power of Buyers
- 4.1.3. Threat of New Entrants
- 4.1.4. Threat of Substitutes
- 4.1.5. Competitive Rivalry
- 4.2. PESTEL analysis
- 4.3. BCG Analysis
- 4.3.1. Stars (High Growth, High Market Share)
- 4.3.2. Cash Cows (Low Growth, High Market Share)
- 4.3.3. Question Mark (High Growth, Low Market Share)
- 4.3.4. Dogs (Low Growth, Low Market Share)
- 4.4. Ansoff Matrix Analysis
- 4.5. Supply Chain Analysis
- 4.6. Regulatory Landscape
- 4.7. Current Market Potential and Opportunity Assessment (TAM–SAM–SOM Framework)
- 4.8. NRP Analyst Note
- 4.1. Porters Five Forces
- 5. Market Analysis, Insights and Forecast 2021-2033
- 5.1. Market Analysis, Insights and Forecast - by Application
- 5.1.1. Digital Camera
- 5.1.2. Projector
- 5.1.3. Smartphone
- 5.1.4. Other
- 5.2. Market Analysis, Insights and Forecast - by Types
- 5.2.1. Prism
- 5.2.2. Prism Module
- 5.3. Market Analysis, Insights and Forecast - by Region
- 5.3.1. North America
- 5.3.2. South America
- 5.3.3. Europe
- 5.3.4. Middle East & Africa
- 5.3.5. Asia Pacific
- 5.1. Market Analysis, Insights and Forecast - by Application
- 6. Global Prism and Prism Module Analysis, Insights and Forecast, 2021-2033
- 6.1. Market Analysis, Insights and Forecast - by Application
- 6.1.1. Digital Camera
- 6.1.2. Projector
- 6.1.3. Smartphone
- 6.1.4. Other
- 6.2. Market Analysis, Insights and Forecast - by Types
- 6.2.1. Prism
- 6.2.2. Prism Module
- 6.1. Market Analysis, Insights and Forecast - by Application
- 7. North America Prism and Prism Module Analysis, Insights and Forecast, 2020-2032
- 7.1. Market Analysis, Insights and Forecast - by Application
- 7.1.1. Digital Camera
- 7.1.2. Projector
- 7.1.3. Smartphone
- 7.1.4. Other
- 7.2. Market Analysis, Insights and Forecast - by Types
- 7.2.1. Prism
- 7.2.2. Prism Module
- 7.1. Market Analysis, Insights and Forecast - by Application
- 8. South America Prism and Prism Module Analysis, Insights and Forecast, 2020-2032
- 8.1. Market Analysis, Insights and Forecast - by Application
- 8.1.1. Digital Camera
- 8.1.2. Projector
- 8.1.3. Smartphone
- 8.1.4. Other
- 8.2. Market Analysis, Insights and Forecast - by Types
- 8.2.1. Prism
- 8.2.2. Prism Module
- 8.1. Market Analysis, Insights and Forecast - by Application
- 9. Europe Prism and Prism Module Analysis, Insights and Forecast, 2020-2032
- 9.1. Market Analysis, Insights and Forecast - by Application
- 9.1.1. Digital Camera
- 9.1.2. Projector
- 9.1.3. Smartphone
- 9.1.4. Other
- 9.2. Market Analysis, Insights and Forecast - by Types
- 9.2.1. Prism
- 9.2.2. Prism Module
- 9.1. Market Analysis, Insights and Forecast - by Application
- 10. Middle East & Africa Prism and Prism Module Analysis, Insights and Forecast, 2020-2032
- 10.1. Market Analysis, Insights and Forecast - by Application
- 10.1.1. Digital Camera
- 10.1.2. Projector
- 10.1.3. Smartphone
- 10.1.4. Other
- 10.2. Market Analysis, Insights and Forecast - by Types
- 10.2.1. Prism
- 10.2.2. Prism Module
- 10.1. Market Analysis, Insights and Forecast - by Application
- 11. Asia Pacific Prism and Prism Module Analysis, Insights and Forecast, 2020-2032
- 11.1. Market Analysis, Insights and Forecast - by Application
- 11.1.1. Digital Camera
- 11.1.2. Projector
- 11.1.3. Smartphone
- 11.1.4. Other
- 11.2. Market Analysis, Insights and Forecast - by Types
- 11.2.1. Prism
- 11.2.2. Prism Module
- 11.1. Market Analysis, Insights and Forecast - by Application
- 12. Competitive Analysis
- 12.1. Company Profiles
- 12.1.1 Sunny Optical Technology
- 12.1.1.1. Company Overview
- 12.1.1.2. Products
- 12.1.1.3. Company Financials
- 12.1.1.4. SWOT Analysis
- 12.1.2 Costar Group
- 12.1.2.1. Company Overview
- 12.1.2.2. Products
- 12.1.2.3. Company Financials
- 12.1.2.4. SWOT Analysis
- 12.1.3 Zhejiang Crystal-Optech
- 12.1.3.1. Company Overview
- 12.1.3.2. Products
- 12.1.3.3. Company Financials
- 12.1.3.4. SWOT Analysis
- 12.1.4 OFILM Group
- 12.1.4.1. Company Overview
- 12.1.4.2. Products
- 12.1.4.3. Company Financials
- 12.1.4.4. SWOT Analysis
- 12.1.5 RICOM
- 12.1.5.1. Company Overview
- 12.1.5.2. Products
- 12.1.5.3. Company Financials
- 12.1.5.4. SWOT Analysis
- 12.1.6 Hubei Wufang Photoelectric
- 12.1.6.1. Company Overview
- 12.1.6.2. Products
- 12.1.6.3. Company Financials
- 12.1.6.4. SWOT Analysis
- 12.1.7 Asia Optical
- 12.1.7.1. Company Overview
- 12.1.7.2. Products
- 12.1.7.3. Company Financials
- 12.1.7.4. SWOT Analysis
- 12.1.8 Optron-Tec
- 12.1.8.1. Company Overview
- 12.1.8.2. Products
- 12.1.8.3. Company Financials
- 12.1.8.4. SWOT Analysis
- 12.1.9 LG Innotek
- 12.1.9.1. Company Overview
- 12.1.9.2. Products
- 12.1.9.3. Company Financials
- 12.1.9.4. SWOT Analysis
- 12.1.10 Semco
- 12.1.10.1. Company Overview
- 12.1.10.2. Products
- 12.1.10.3. Company Financials
- 12.1.10.4. SWOT Analysis
- 12.1.11 Foxconn
- 12.1.11.1. Company Overview
- 12.1.11.2. Products
- 12.1.11.3. Company Financials
- 12.1.11.4. SWOT Analysis
- 12.1.12 Luxvisions
- 12.1.12.1. Company Overview
- 12.1.12.2. Products
- 12.1.12.3. Company Financials
- 12.1.12.4. SWOT Analysis
- 12.1.13 Primax
- 12.1.13.1. Company Overview
- 12.1.13.2. Products
- 12.1.13.3. Company Financials
- 12.1.13.4. SWOT Analysis
- 12.1.14 Chicony
- 12.1.14.1. Company Overview
- 12.1.14.2. Products
- 12.1.14.3. Company Financials
- 12.1.14.4. SWOT Analysis
- 12.1.15 Cowell
- 12.1.15.1. Company Overview
- 12.1.15.2. Products
- 12.1.15.3. Company Financials
- 12.1.15.4. SWOT Analysis
- 12.1.16 Partron
- 12.1.16.1. Company Overview
- 12.1.16.2. Products
- 12.1.16.3. Company Financials
- 12.1.16.4. SWOT Analysis
- 12.1.1 Sunny Optical Technology
- 12.2. Market Entropy
- 12.2.1 Company's Key Areas Served
- 12.2.2 Recent Developments
- 12.3. Company Market Share Analysis 2025
- 12.3.1 Top 5 Companies Market Share Analysis
- 12.3.2 Top 3 Companies Market Share Analysis
- 12.4. List of Potential Customers
- 13. Research Methodology
List of Figures
- Figure 1: Global Prism and Prism Module Revenue Breakdown (billion, %) by Region 2025 & 2033
- Figure 2: Global Prism and Prism Module Volume Breakdown (K, %) by Region 2025 & 2033
- Figure 3: North America Prism and Prism Module Revenue (billion), by Application 2025 & 2033
- Figure 4: North America Prism and Prism Module Volume (K), by Application 2025 & 2033
- Figure 5: North America Prism and Prism Module Revenue Share (%), by Application 2025 & 2033
- Figure 6: North America Prism and Prism Module Volume Share (%), by Application 2025 & 2033
- Figure 7: North America Prism and Prism Module Revenue (billion), by Types 2025 & 2033
- Figure 8: North America Prism and Prism Module Volume (K), by Types 2025 & 2033
- Figure 9: North America Prism and Prism Module Revenue Share (%), by Types 2025 & 2033
- Figure 10: North America Prism and Prism Module Volume Share (%), by Types 2025 & 2033
- Figure 11: North America Prism and Prism Module Revenue (billion), by Country 2025 & 2033
- Figure 12: North America Prism and Prism Module Volume (K), by Country 2025 & 2033
- Figure 13: North America Prism and Prism Module Revenue Share (%), by Country 2025 & 2033
- Figure 14: North America Prism and Prism Module Volume Share (%), by Country 2025 & 2033
- Figure 15: South America Prism and Prism Module Revenue (billion), by Application 2025 & 2033
- Figure 16: South America Prism and Prism Module Volume (K), by Application 2025 & 2033
- Figure 17: South America Prism and Prism Module Revenue Share (%), by Application 2025 & 2033
- Figure 18: South America Prism and Prism Module Volume Share (%), by Application 2025 & 2033
- Figure 19: South America Prism and Prism Module Revenue (billion), by Types 2025 & 2033
- Figure 20: South America Prism and Prism Module Volume (K), by Types 2025 & 2033
- Figure 21: South America Prism and Prism Module Revenue Share (%), by Types 2025 & 2033
- Figure 22: South America Prism and Prism Module Volume Share (%), by Types 2025 & 2033
- Figure 23: South America Prism and Prism Module Revenue (billion), by Country 2025 & 2033
- Figure 24: South America Prism and Prism Module Volume (K), by Country 2025 & 2033
- Figure 25: South America Prism and Prism Module Revenue Share (%), by Country 2025 & 2033
- Figure 26: South America Prism and Prism Module Volume Share (%), by Country 2025 & 2033
- Figure 27: Europe Prism and Prism Module Revenue (billion), by Application 2025 & 2033
- Figure 28: Europe Prism and Prism Module Volume (K), by Application 2025 & 2033
- Figure 29: Europe Prism and Prism Module Revenue Share (%), by Application 2025 & 2033
- Figure 30: Europe Prism and Prism Module Volume Share (%), by Application 2025 & 2033
- Figure 31: Europe Prism and Prism Module Revenue (billion), by Types 2025 & 2033
- Figure 32: Europe Prism and Prism Module Volume (K), by Types 2025 & 2033
- Figure 33: Europe Prism and Prism Module Revenue Share (%), by Types 2025 & 2033
- Figure 34: Europe Prism and Prism Module Volume Share (%), by Types 2025 & 2033
- Figure 35: Europe Prism and Prism Module Revenue (billion), by Country 2025 & 2033
- Figure 36: Europe Prism and Prism Module Volume (K), by Country 2025 & 2033
- Figure 37: Europe Prism and Prism Module Revenue Share (%), by Country 2025 & 2033
- Figure 38: Europe Prism and Prism Module Volume Share (%), by Country 2025 & 2033
- Figure 39: Middle East & Africa Prism and Prism Module Revenue (billion), by Application 2025 & 2033
- Figure 40: Middle East & Africa Prism and Prism Module Volume (K), by Application 2025 & 2033
- Figure 41: Middle East & Africa Prism and Prism Module Revenue Share (%), by Application 2025 & 2033
- Figure 42: Middle East & Africa Prism and Prism Module Volume Share (%), by Application 2025 & 2033
- Figure 43: Middle East & Africa Prism and Prism Module Revenue (billion), by Types 2025 & 2033
- Figure 44: Middle East & Africa Prism and Prism Module Volume (K), by Types 2025 & 2033
- Figure 45: Middle East & Africa Prism and Prism Module Revenue Share (%), by Types 2025 & 2033
- Figure 46: Middle East & Africa Prism and Prism Module Volume Share (%), by Types 2025 & 2033
- Figure 47: Middle East & Africa Prism and Prism Module Revenue (billion), by Country 2025 & 2033
- Figure 48: Middle East & Africa Prism and Prism Module Volume (K), by Country 2025 & 2033
- Figure 49: Middle East & Africa Prism and Prism Module Revenue Share (%), by Country 2025 & 2033
- Figure 50: Middle East & Africa Prism and Prism Module Volume Share (%), by Country 2025 & 2033
- Figure 51: Asia Pacific Prism and Prism Module Revenue (billion), by Application 2025 & 2033
- Figure 52: Asia Pacific Prism and Prism Module Volume (K), by Application 2025 & 2033
- Figure 53: Asia Pacific Prism and Prism Module Revenue Share (%), by Application 2025 & 2033
- Figure 54: Asia Pacific Prism and Prism Module Volume Share (%), by Application 2025 & 2033
- Figure 55: Asia Pacific Prism and Prism Module Revenue (billion), by Types 2025 & 2033
- Figure 56: Asia Pacific Prism and Prism Module Volume (K), by Types 2025 & 2033
- Figure 57: Asia Pacific Prism and Prism Module Revenue Share (%), by Types 2025 & 2033
- Figure 58: Asia Pacific Prism and Prism Module Volume Share (%), by Types 2025 & 2033
- Figure 59: Asia Pacific Prism and Prism Module Revenue (billion), by Country 2025 & 2033
- Figure 60: Asia Pacific Prism and Prism Module Volume (K), by Country 2025 & 2033
- Figure 61: Asia Pacific Prism and Prism Module Revenue Share (%), by Country 2025 & 2033
- Figure 62: Asia Pacific Prism and Prism Module Volume Share (%), by Country 2025 & 2033
List of Tables
- Table 1: Global Prism and Prism Module Revenue billion Forecast, by Application 2020 & 2033
- Table 2: Global Prism and Prism Module Volume K Forecast, by Application 2020 & 2033
- Table 3: Global Prism and Prism Module Revenue billion Forecast, by Types 2020 & 2033
- Table 4: Global Prism and Prism Module Volume K Forecast, by Types 2020 & 2033
- Table 5: Global Prism and Prism Module Revenue billion Forecast, by Region 2020 & 2033
- Table 6: Global Prism and Prism Module Volume K Forecast, by Region 2020 & 2033
- Table 7: Global Prism and Prism Module Revenue billion Forecast, by Application 2020 & 2033
- Table 8: Global Prism and Prism Module Volume K Forecast, by Application 2020 & 2033
- Table 9: Global Prism and Prism Module Revenue billion Forecast, by Types 2020 & 2033
- Table 10: Global Prism and Prism Module Volume K Forecast, by Types 2020 & 2033
- Table 11: Global Prism and Prism Module Revenue billion Forecast, by Country 2020 & 2033
- Table 12: Global Prism and Prism Module Volume K Forecast, by Country 2020 & 2033
- Table 13: United States Prism and Prism Module Revenue (billion) Forecast, by Application 2020 & 2033
- Table 14: United States Prism and Prism Module Volume (K) Forecast, by Application 2020 & 2033
- Table 15: Canada Prism and Prism Module Revenue (billion) Forecast, by Application 2020 & 2033
- Table 16: Canada Prism and Prism Module Volume (K) Forecast, by Application 2020 & 2033
- Table 17: Mexico Prism and Prism Module Revenue (billion) Forecast, by Application 2020 & 2033
- Table 18: Mexico Prism and Prism Module Volume (K) Forecast, by Application 2020 & 2033
- Table 19: Global Prism and Prism Module Revenue billion Forecast, by Application 2020 & 2033
- Table 20: Global Prism and Prism Module Volume K Forecast, by Application 2020 & 2033
- Table 21: Global Prism and Prism Module Revenue billion Forecast, by Types 2020 & 2033
- Table 22: Global Prism and Prism Module Volume K Forecast, by Types 2020 & 2033
- Table 23: Global Prism and Prism Module Revenue billion Forecast, by Country 2020 & 2033
- Table 24: Global Prism and Prism Module Volume K Forecast, by Country 2020 & 2033
- Table 25: Brazil Prism and Prism Module Revenue (billion) Forecast, by Application 2020 & 2033
- Table 26: Brazil Prism and Prism Module Volume (K) Forecast, by Application 2020 & 2033
- Table 27: Argentina Prism and Prism Module Revenue (billion) Forecast, by Application 2020 & 2033
- Table 28: Argentina Prism and Prism Module Volume (K) Forecast, by Application 2020 & 2033
- Table 29: Rest of South America Prism and Prism Module Revenue (billion) Forecast, by Application 2020 & 2033
- Table 30: Rest of South America Prism and Prism Module Volume (K) Forecast, by Application 2020 & 2033
- Table 31: Global Prism and Prism Module Revenue billion Forecast, by Application 2020 & 2033
- Table 32: Global Prism and Prism Module Volume K Forecast, by Application 2020 & 2033
- Table 33: Global Prism and Prism Module Revenue billion Forecast, by Types 2020 & 2033
- Table 34: Global Prism and Prism Module Volume K Forecast, by Types 2020 & 2033
- Table 35: Global Prism and Prism Module Revenue billion Forecast, by Country 2020 & 2033
- Table 36: Global Prism and Prism Module Volume K Forecast, by Country 2020 & 2033
- Table 37: United Kingdom Prism and Prism Module Revenue (billion) Forecast, by Application 2020 & 2033
- Table 38: United Kingdom Prism and Prism Module Volume (K) Forecast, by Application 2020 & 2033
- Table 39: Germany Prism and Prism Module Revenue (billion) Forecast, by Application 2020 & 2033
- Table 40: Germany Prism and Prism Module Volume (K) Forecast, by Application 2020 & 2033
- Table 41: France Prism and Prism Module Revenue (billion) Forecast, by Application 2020 & 2033
- Table 42: France Prism and Prism Module Volume (K) Forecast, by Application 2020 & 2033
- Table 43: Italy Prism and Prism Module Revenue (billion) Forecast, by Application 2020 & 2033
- Table 44: Italy Prism and Prism Module Volume (K) Forecast, by Application 2020 & 2033
- Table 45: Spain Prism and Prism Module Revenue (billion) Forecast, by Application 2020 & 2033
- Table 46: Spain Prism and Prism Module Volume (K) Forecast, by Application 2020 & 2033
- Table 47: Russia Prism and Prism Module Revenue (billion) Forecast, by Application 2020 & 2033
- Table 48: Russia Prism and Prism Module Volume (K) Forecast, by Application 2020 & 2033
- Table 49: Benelux Prism and Prism Module Revenue (billion) Forecast, by Application 2020 & 2033
- Table 50: Benelux Prism and Prism Module Volume (K) Forecast, by Application 2020 & 2033
- Table 51: Nordics Prism and Prism Module Revenue (billion) Forecast, by Application 2020 & 2033
- Table 52: Nordics Prism and Prism Module Volume (K) Forecast, by Application 2020 & 2033
- Table 53: Rest of Europe Prism and Prism Module Revenue (billion) Forecast, by Application 2020 & 2033
- Table 54: Rest of Europe Prism and Prism Module Volume (K) Forecast, by Application 2020 & 2033
- Table 55: Global Prism and Prism Module Revenue billion Forecast, by Application 2020 & 2033
- Table 56: Global Prism and Prism Module Volume K Forecast, by Application 2020 & 2033
- Table 57: Global Prism and Prism Module Revenue billion Forecast, by Types 2020 & 2033
- Table 58: Global Prism and Prism Module Volume K Forecast, by Types 2020 & 2033
- Table 59: Global Prism and Prism Module Revenue billion Forecast, by Country 2020 & 2033
- Table 60: Global Prism and Prism Module Volume K Forecast, by Country 2020 & 2033
- Table 61: Turkey Prism and Prism Module Revenue (billion) Forecast, by Application 2020 & 2033
- Table 62: Turkey Prism and Prism Module Volume (K) Forecast, by Application 2020 & 2033
- Table 63: Israel Prism and Prism Module Revenue (billion) Forecast, by Application 2020 & 2033
- Table 64: Israel Prism and Prism Module Volume (K) Forecast, by Application 2020 & 2033
- Table 65: GCC Prism and Prism Module Revenue (billion) Forecast, by Application 2020 & 2033
- Table 66: GCC Prism and Prism Module Volume (K) Forecast, by Application 2020 & 2033
- Table 67: North Africa Prism and Prism Module Revenue (billion) Forecast, by Application 2020 & 2033
- Table 68: North Africa Prism and Prism Module Volume (K) Forecast, by Application 2020 & 2033
- Table 69: South Africa Prism and Prism Module Revenue (billion) Forecast, by Application 2020 & 2033
- Table 70: South Africa Prism and Prism Module Volume (K) Forecast, by Application 2020 & 2033
- Table 71: Rest of Middle East & Africa Prism and Prism Module Revenue (billion) Forecast, by Application 2020 & 2033
- Table 72: Rest of Middle East & Africa Prism and Prism Module Volume (K) Forecast, by Application 2020 & 2033
- Table 73: Global Prism and Prism Module Revenue billion Forecast, by Application 2020 & 2033
- Table 74: Global Prism and Prism Module Volume K Forecast, by Application 2020 & 2033
- Table 75: Global Prism and Prism Module Revenue billion Forecast, by Types 2020 & 2033
- Table 76: Global Prism and Prism Module Volume K Forecast, by Types 2020 & 2033
- Table 77: Global Prism and Prism Module Revenue billion Forecast, by Country 2020 & 2033
- Table 78: Global Prism and Prism Module Volume K Forecast, by Country 2020 & 2033
- Table 79: China Prism and Prism Module Revenue (billion) Forecast, by Application 2020 & 2033
- Table 80: China Prism and Prism Module Volume (K) Forecast, by Application 2020 & 2033
- Table 81: India Prism and Prism Module Revenue (billion) Forecast, by Application 2020 & 2033
- Table 82: India Prism and Prism Module Volume (K) Forecast, by Application 2020 & 2033
- Table 83: Japan Prism and Prism Module Revenue (billion) Forecast, by Application 2020 & 2033
- Table 84: Japan Prism and Prism Module Volume (K) Forecast, by Application 2020 & 2033
- Table 85: South Korea Prism and Prism Module Revenue (billion) Forecast, by Application 2020 & 2033
- Table 86: South Korea Prism and Prism Module Volume (K) Forecast, by Application 2020 & 2033
- Table 87: ASEAN Prism and Prism Module Revenue (billion) Forecast, by Application 2020 & 2033
- Table 88: ASEAN Prism and Prism Module Volume (K) Forecast, by Application 2020 & 2033
- Table 89: Oceania Prism and Prism Module Revenue (billion) Forecast, by Application 2020 & 2033
- Table 90: Oceania Prism and Prism Module Volume (K) Forecast, by Application 2020 & 2033
- Table 91: Rest of Asia Pacific Prism and Prism Module Revenue (billion) Forecast, by Application 2020 & 2033
- Table 92: Rest of Asia Pacific Prism and Prism Module Volume (K) Forecast, by Application 2020 & 2033
Frequently Asked Questions
1. What is the projected Compound Annual Growth Rate (CAGR) of the Prism and Prism Module?
The projected CAGR is approximately 12.8%.
2. Which companies are prominent players in the Prism and Prism Module?
Key companies in the market include Sunny Optical Technology, Costar Group, Zhejiang Crystal-Optech, OFILM Group, RICOM, Hubei Wufang Photoelectric, Asia Optical, Optron-Tec, LG Innotek, Semco, Foxconn, Luxvisions, Primax, Chicony, Cowell, Partron.
3. What are the main segments of the Prism and Prism Module?
The market segments include Application, Types.
4. Can you provide details about the market size?
The market size is estimated to be USD 2.5 billion as of 2022.
5. What are some drivers contributing to market growth?
N/A
6. What are the notable trends driving market growth?
N/A
7. Are there any restraints impacting market growth?
N/A
8. Can you provide examples of recent developments in the market?
N/A
9. What pricing options are available for accessing the report?
Pricing options include single-user, multi-user, and enterprise licenses priced at USD 3950.00, USD 5925.00, and USD 7900.00 respectively.
10. Is the market size provided in terms of value or volume?
The market size is provided in terms of value, measured in billion and volume, measured in K.
11. Are there any specific market keywords associated with the report?
Yes, the market keyword associated with the report is "Prism and Prism Module," which aids in identifying and referencing the specific market segment covered.
12. How do I determine which pricing option suits my needs best?
The pricing options vary based on user requirements and access needs. Individual users may opt for single-user licenses, while businesses requiring broader access may choose multi-user or enterprise licenses for cost-effective access to the report.
13. Are there any additional resources or data provided in the Prism and Prism Module report?
While the report offers comprehensive insights, it's advisable to review the specific contents or supplementary materials provided to ascertain if additional resources or data are available.
14. How can I stay updated on further developments or reports in the Prism and Prism Module?
To stay informed about further developments, trends, and reports in the Prism and Prism Module, consider subscribing to industry newsletters, following relevant companies and organizations, or regularly checking reputable industry news sources and publications.
Methodology
Step 1 - Identification of Relevant Samples Size from Population Database


Step 2 - Approaches for Defining Global Market Size (Value, Volume* & Price*)

Note*: In applicable scenarios
Step 3 - Data Sources
Primary Research
- Web Analytics
- Survey Reports
- Research Institute
- Latest Research Reports
- Opinion Leaders
Secondary Research
- Annual Reports
- White Paper
- Latest Press Release
- Industry Association
- Paid Database
- Investor Presentations

Step 4 - Data Triangulation
Involves using different sources of information in order to increase the validity of a study
These sources are likely to be stakeholders in a program - participants, other researchers, program staff, other community members, and so on.
Then we put all data in single framework & apply various statistical tools to find out the dynamic on the market.
During the analysis stage, feedback from the stakeholder groups would be compared to determine areas of agreement as well as areas of divergence