

Key Insights
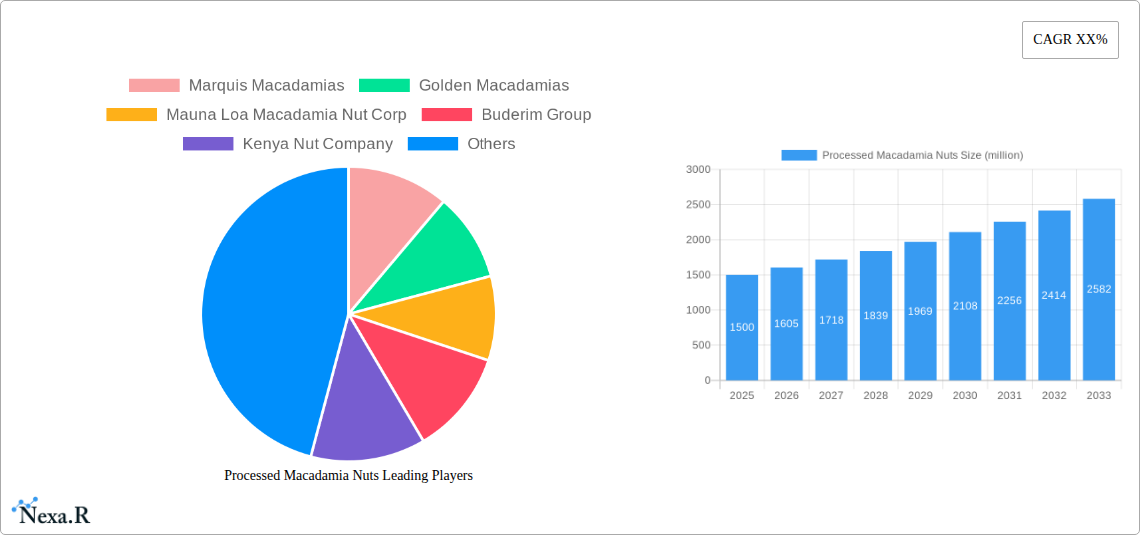
The global processed macadamia nut market is experiencing robust growth, driven by increasing consumer demand for healthy snacks and the rising popularity of plant-based diets. The market, valued at approximately $1.5 billion in 2025, is projected to exhibit a Compound Annual Growth Rate (CAGR) of 7% from 2025 to 2033, reaching an estimated value of $2.8 billion by 2033. Key drivers include the growing awareness of macadamia nuts' nutritional benefits – high in monounsaturated fats and antioxidants – and their versatility in various food applications, including confectionery, baked goods, and dairy alternatives. Furthermore, expanding distribution channels through online retailers and specialty stores is fueling market expansion. However, the market faces challenges such as price volatility due to fluctuating crop yields and the relatively high cost of macadamia nuts compared to other nuts, which can limit accessibility for some consumers. Market segmentation reveals strong demand for roasted and salted macadamia nuts, followed by flavored varieties. Key players like Marquis Macadamias, Golden Macadamias, and Mauna Loa Macadamia Nut Corp. are strategically investing in product innovation and expanding their geographical reach to maintain their market share. The North American and European markets currently dominate the processed macadamia nut landscape, but significant growth opportunities exist in Asia-Pacific, driven by rising disposable incomes and changing dietary preferences.
The competitive landscape is characterized by both established players and emerging regional brands. Companies are focused on enhancing product quality, exploring sustainable farming practices, and tapping into niche markets to gain a competitive edge. Future growth will likely be influenced by factors such as technological advancements in processing and packaging, increasing consumer preference for organic and sustainably sourced products, and successful marketing campaigns highlighting the health benefits of macadamia nuts. A focus on product differentiation through unique flavors and convenient packaging formats will also play a crucial role in shaping future market trends.
Processed Macadamia Nuts Market Report: 2019-2033
This comprehensive report provides a detailed analysis of the global processed macadamia nuts market, offering invaluable insights for industry professionals, investors, and strategic decision-makers. Covering the period from 2019 to 2033, with a base year of 2025, this report unveils market dynamics, growth trends, competitive landscapes, and future opportunities within the parent market of nuts and the child market of processed nuts. The report projects a market value reaching xx million units by 2033.
Processed Macadamia Nuts Market Dynamics & Structure
This section analyzes the market concentration, revealing the competitive intensity and market share held by key players like Marquis Macadamias, Golden Macadamias, Mauna Loa Macadamia Nut Corp, Buderim Group, Kenya Nut Company, Nambucca Macnuts, Ivory Macadamias, Eastern Produce, and Hamakua Macadamia Nut Company. We delve into technological innovations driving efficiency and product diversification, examining the impact of regulatory frameworks on market access and sustainability practices. The analysis also explores the presence of competitive substitutes and their influence, alongside end-user demographics and their evolving preferences. Finally, we examine M&A activity within the sector, quantifying deal volumes and their impact on market consolidation.
- Market Concentration: The market is characterized by [Describe concentration level - e.g., moderate concentration with a few dominant players]. [Insert quantitative data on market share percentages for top 3-5 players].
- Technological Innovation: Key drivers include advancements in processing techniques (e.g., improved roasting and flavoring methods), automation in harvesting and processing, and packaging innovations to enhance shelf life. Barriers include high initial investment costs for technology upgrades and a need for skilled labor.
- Regulatory Framework: [Describe relevant regulations impacting production, labeling, and trade, including any specific regional variations].
- Competitive Substitutes: [Identify key substitutes like other nuts, seeds, or confectionery products and analyze their market impact].
- M&A Trends: [Report on the number of M&A deals in the historical period and provide an outlook for the forecast period]. [Insert quantitative data on deal volumes].
Processed Macadamia Nuts Growth Trends & Insights
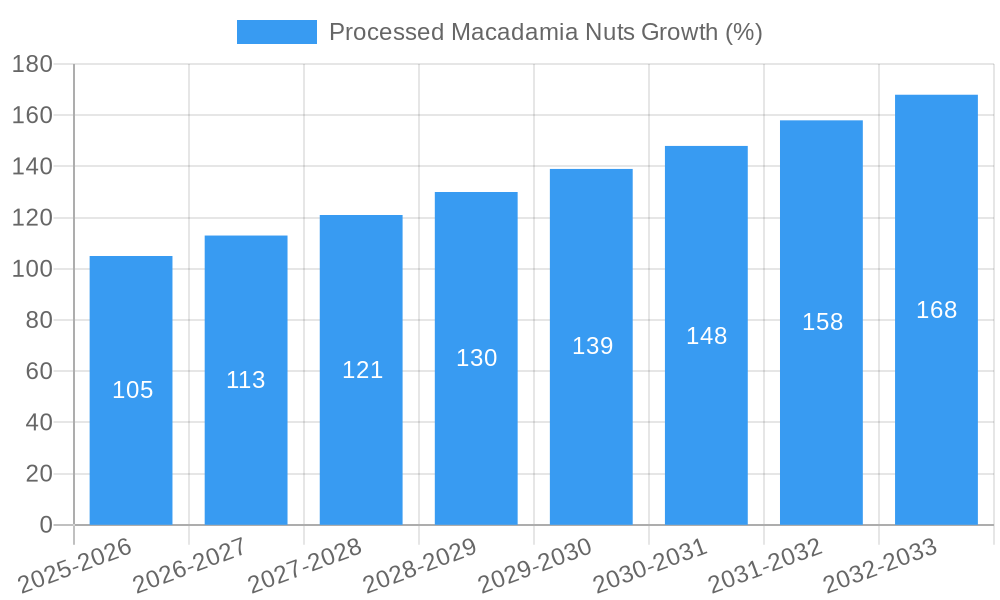
This section leverages extensive market research data to provide a comprehensive analysis of market size evolution from 2019 to 2033. We examine adoption rates across various segments, highlighting the impact of technological disruptions on market dynamics. The analysis explores shifts in consumer behavior, including changing dietary preferences and growing health consciousness influencing demand. We present key metrics, such as the Compound Annual Growth Rate (CAGR) and market penetration rates for a deeper understanding of market trajectory. The global market size reached xx million units in 2024 and is projected to reach xx million units by 2033, exhibiting a CAGR of xx% during the forecast period.
Dominant Regions, Countries, or Segments in Processed Macadamia Nuts
This section identifies the leading regions, countries, or segments driving market growth. We analyze the dominance factors, such as economic policies, infrastructure development, and consumer preferences within each region. The analysis includes market share data and growth potential projections for each key region. [Insert dominant regions/countries and their market share].
- Key Drivers: [Include specific examples like favorable government policies supporting agriculture in a particular country or high per capita consumption in a specific region]
- Dominance Factors: [Analyze market share data and factors contributing to high growth in specific regions/segments. Include economic factors, infrastructure, cultural preferences, and regulatory landscapes.]
Processed Macadamia Nuts Product Landscape
The processed macadamia nuts market offers a diverse range of products, including roasted, salted, flavored, and coated varieties. Innovations focus on enhancing flavor profiles, extending shelf life, and creating convenient packaging formats. Technological advancements in processing and packaging are continually driving product differentiation and superior quality. Unique selling propositions include organic certifications, specific flavor combinations (e.g., honey-roasted, chili-lime), and single-serve packaging for convenient consumption.
Key Drivers, Barriers & Challenges in Processed Macadamia Nuts
Key Drivers: Growing consumer demand driven by health consciousness (high nutritional value, healthy fats), increasing disposable incomes in developing economies, and the rise of convenient snacking options are major drivers. Technological advancements in processing and packaging also contribute to market expansion.
Key Challenges: Fluctuations in raw material prices, supply chain disruptions, stringent regulatory compliance requirements, and intense competition from substitute products present significant challenges to market growth. [Quantify the impact of these challenges where possible, e.g., estimated percentage increase in costs due to supply chain disruptions].
Emerging Opportunities in Processed Macadamia Nuts
Emerging opportunities lie in untapped markets (e.g., expanding into new regions with growing consumer base), innovative product development (e.g., functional foods incorporating macadamia nuts), and catering to evolving consumer preferences (e.g., sustainable and ethically sourced products). The growth of the health and wellness sector presents significant opportunities for processed macadamia nuts as a healthy snack option.
Growth Accelerators in the Processed Macadamia Nuts Industry
Technological breakthroughs in processing and packaging, strategic partnerships between producers and food manufacturers, and strategic market expansion into new geographical areas will be crucial in driving long-term growth. The development of value-added products and the focus on sustainable practices are also critical for sustainable market growth.
Key Players Shaping the Processed Macadamia Nuts Market
- Marquis Macadamias
- Golden Macadamias
- Mauna Loa Macadamia Nut Corp
- Buderim Group
- Kenya Nut Company
- Nambucca Macnuts
- Ivory Macadamias
- Eastern Produce
- Hamakua Macadamia Nut Company
Notable Milestones in Processed Macadamia Nuts Sector
- [Insert significant milestones with year/month, e.g., "2022-Q3: Launch of a new line of organic macadamia nut snacks by Marquis Macadamias."]
In-Depth Processed Macadamia Nuts Market Outlook
The future of the processed macadamia nuts market is promising, driven by sustained growth in consumer demand and continuous innovations in product development and processing technologies. Strategic partnerships, expansion into new markets, and a focus on sustainability will be key to unlocking the market's full potential. The market is poised for significant expansion, with substantial growth opportunities for established players and new entrants alike.
Processed Macadamia Nuts Segmentation
-
1. Application
- 1.1. Snack Food
- 1.2. Confectionery and Bakery
- 1.3. Cosmetics
- 1.4. Other Application
-
2. Types
- 2.1. Nuts without Shell
- 2.2. Nuts in Shell
Processed Macadamia Nuts Segmentation By Geography
-
1. North America
- 1.1. United States
- 1.2. Canada
- 1.3. Mexico
-
2. South America
- 2.1. Brazil
- 2.2. Argentina
- 2.3. Rest of South America
-
3. Europe
- 3.1. United Kingdom
- 3.2. Germany
- 3.3. France
- 3.4. Italy
- 3.5. Spain
- 3.6. Russia
- 3.7. Benelux
- 3.8. Nordics
- 3.9. Rest of Europe
-
4. Middle East & Africa
- 4.1. Turkey
- 4.2. Israel
- 4.3. GCC
- 4.4. North Africa
- 4.5. South Africa
- 4.6. Rest of Middle East & Africa
-
5. Asia Pacific
- 5.1. China
- 5.2. India
- 5.3. Japan
- 5.4. South Korea
- 5.5. ASEAN
- 5.6. Oceania
- 5.7. Rest of Asia Pacific

Processed Macadamia Nuts REPORT HIGHLIGHTS
| Aspects | Details |
|---|---|
| Study Period | 2019-2033 |
| Base Year | 2024 |
| Estimated Year | 2025 |
| Forecast Period | 2025-2033 |
| Historical Period | 2019-2024 |
| Growth Rate | CAGR of XX% from 2019-2033 |
| Segmentation |
|
Table of Contents
- 1. Introduction
- 1.1. Research Scope
- 1.2. Market Segmentation
- 1.3. Research Methodology
- 1.4. Definitions and Assumptions
- 2. Executive Summary
- 2.1. Introduction
- 3. Market Dynamics
- 3.1. Introduction
- 3.2. Market Drivers
- 3.3. Market Restrains
- 3.4. Market Trends
- 4. Market Factor Analysis
- 4.1. Porters Five Forces
- 4.2. Supply/Value Chain
- 4.3. PESTEL analysis
- 4.4. Market Entropy
- 4.5. Patent/Trademark Analysis
- 5. Global Processed Macadamia Nuts Analysis, Insights and Forecast, 2019-2031
- 5.1. Market Analysis, Insights and Forecast - by Application
- 5.1.1. Snack Food
- 5.1.2. Confectionery and Bakery
- 5.1.3. Cosmetics
- 5.1.4. Other Application
- 5.2. Market Analysis, Insights and Forecast - by Types
- 5.2.1. Nuts without Shell
- 5.2.2. Nuts in Shell
- 5.3. Market Analysis, Insights and Forecast - by Region
- 5.3.1. North America
- 5.3.2. South America
- 5.3.3. Europe
- 5.3.4. Middle East & Africa
- 5.3.5. Asia Pacific
- 5.1. Market Analysis, Insights and Forecast - by Application
- 6. North America Processed Macadamia Nuts Analysis, Insights and Forecast, 2019-2031
- 6.1. Market Analysis, Insights and Forecast - by Application
- 6.1.1. Snack Food
- 6.1.2. Confectionery and Bakery
- 6.1.3. Cosmetics
- 6.1.4. Other Application
- 6.2. Market Analysis, Insights and Forecast - by Types
- 6.2.1. Nuts without Shell
- 6.2.2. Nuts in Shell
- 6.1. Market Analysis, Insights and Forecast - by Application
- 7. South America Processed Macadamia Nuts Analysis, Insights and Forecast, 2019-2031
- 7.1. Market Analysis, Insights and Forecast - by Application
- 7.1.1. Snack Food
- 7.1.2. Confectionery and Bakery
- 7.1.3. Cosmetics
- 7.1.4. Other Application
- 7.2. Market Analysis, Insights and Forecast - by Types
- 7.2.1. Nuts without Shell
- 7.2.2. Nuts in Shell
- 7.1. Market Analysis, Insights and Forecast - by Application
- 8. Europe Processed Macadamia Nuts Analysis, Insights and Forecast, 2019-2031
- 8.1. Market Analysis, Insights and Forecast - by Application
- 8.1.1. Snack Food
- 8.1.2. Confectionery and Bakery
- 8.1.3. Cosmetics
- 8.1.4. Other Application
- 8.2. Market Analysis, Insights and Forecast - by Types
- 8.2.1. Nuts without Shell
- 8.2.2. Nuts in Shell
- 8.1. Market Analysis, Insights and Forecast - by Application
- 9. Middle East & Africa Processed Macadamia Nuts Analysis, Insights and Forecast, 2019-2031
- 9.1. Market Analysis, Insights and Forecast - by Application
- 9.1.1. Snack Food
- 9.1.2. Confectionery and Bakery
- 9.1.3. Cosmetics
- 9.1.4. Other Application
- 9.2. Market Analysis, Insights and Forecast - by Types
- 9.2.1. Nuts without Shell
- 9.2.2. Nuts in Shell
- 9.1. Market Analysis, Insights and Forecast - by Application
- 10. Asia Pacific Processed Macadamia Nuts Analysis, Insights and Forecast, 2019-2031
- 10.1. Market Analysis, Insights and Forecast - by Application
- 10.1.1. Snack Food
- 10.1.2. Confectionery and Bakery
- 10.1.3. Cosmetics
- 10.1.4. Other Application
- 10.2. Market Analysis, Insights and Forecast - by Types
- 10.2.1. Nuts without Shell
- 10.2.2. Nuts in Shell
- 10.1. Market Analysis, Insights and Forecast - by Application
- 11. Competitive Analysis
- 11.1. Global Market Share Analysis 2024
- 11.2. Company Profiles
- 11.2.1 Marquis Macadamias
- 11.2.1.1. Overview
- 11.2.1.2. Products
- 11.2.1.3. SWOT Analysis
- 11.2.1.4. Recent Developments
- 11.2.1.5. Financials (Based on Availability)
- 11.2.2 Golden Macadamias
- 11.2.2.1. Overview
- 11.2.2.2. Products
- 11.2.2.3. SWOT Analysis
- 11.2.2.4. Recent Developments
- 11.2.2.5. Financials (Based on Availability)
- 11.2.3 Mauna Loa Macadamia Nut Corp
- 11.2.3.1. Overview
- 11.2.3.2. Products
- 11.2.3.3. SWOT Analysis
- 11.2.3.4. Recent Developments
- 11.2.3.5. Financials (Based on Availability)
- 11.2.4 Buderim Group
- 11.2.4.1. Overview
- 11.2.4.2. Products
- 11.2.4.3. SWOT Analysis
- 11.2.4.4. Recent Developments
- 11.2.4.5. Financials (Based on Availability)
- 11.2.5 Kenya Nut Company
- 11.2.5.1. Overview
- 11.2.5.2. Products
- 11.2.5.3. SWOT Analysis
- 11.2.5.4. Recent Developments
- 11.2.5.5. Financials (Based on Availability)
- 11.2.6 Nambucca Macnuts
- 11.2.6.1. Overview
- 11.2.6.2. Products
- 11.2.6.3. SWOT Analysis
- 11.2.6.4. Recent Developments
- 11.2.6.5. Financials (Based on Availability)
- 11.2.7 Ivory Macadamias
- 11.2.7.1. Overview
- 11.2.7.2. Products
- 11.2.7.3. SWOT Analysis
- 11.2.7.4. Recent Developments
- 11.2.7.5. Financials (Based on Availability)
- 11.2.8 Eastern Produce
- 11.2.8.1. Overview
- 11.2.8.2. Products
- 11.2.8.3. SWOT Analysis
- 11.2.8.4. Recent Developments
- 11.2.8.5. Financials (Based on Availability)
- 11.2.9 Hamakua Macadamia Nut Company
- 11.2.9.1. Overview
- 11.2.9.2. Products
- 11.2.9.3. SWOT Analysis
- 11.2.9.4. Recent Developments
- 11.2.9.5. Financials (Based on Availability)
- 11.2.1 Marquis Macadamias
List of Figures
- Figure 1: Global Processed Macadamia Nuts Revenue Breakdown (million, %) by Region 2024 & 2032
- Figure 2: Global Processed Macadamia Nuts Volume Breakdown (K, %) by Region 2024 & 2032
- Figure 3: North America Processed Macadamia Nuts Revenue (million), by Application 2024 & 2032
- Figure 4: North America Processed Macadamia Nuts Volume (K), by Application 2024 & 2032
- Figure 5: North America Processed Macadamia Nuts Revenue Share (%), by Application 2024 & 2032
- Figure 6: North America Processed Macadamia Nuts Volume Share (%), by Application 2024 & 2032
- Figure 7: North America Processed Macadamia Nuts Revenue (million), by Types 2024 & 2032
- Figure 8: North America Processed Macadamia Nuts Volume (K), by Types 2024 & 2032
- Figure 9: North America Processed Macadamia Nuts Revenue Share (%), by Types 2024 & 2032
- Figure 10: North America Processed Macadamia Nuts Volume Share (%), by Types 2024 & 2032
- Figure 11: North America Processed Macadamia Nuts Revenue (million), by Country 2024 & 2032
- Figure 12: North America Processed Macadamia Nuts Volume (K), by Country 2024 & 2032
- Figure 13: North America Processed Macadamia Nuts Revenue Share (%), by Country 2024 & 2032
- Figure 14: North America Processed Macadamia Nuts Volume Share (%), by Country 2024 & 2032
- Figure 15: South America Processed Macadamia Nuts Revenue (million), by Application 2024 & 2032
- Figure 16: South America Processed Macadamia Nuts Volume (K), by Application 2024 & 2032
- Figure 17: South America Processed Macadamia Nuts Revenue Share (%), by Application 2024 & 2032
- Figure 18: South America Processed Macadamia Nuts Volume Share (%), by Application 2024 & 2032
- Figure 19: South America Processed Macadamia Nuts Revenue (million), by Types 2024 & 2032
- Figure 20: South America Processed Macadamia Nuts Volume (K), by Types 2024 & 2032
- Figure 21: South America Processed Macadamia Nuts Revenue Share (%), by Types 2024 & 2032
- Figure 22: South America Processed Macadamia Nuts Volume Share (%), by Types 2024 & 2032
- Figure 23: South America Processed Macadamia Nuts Revenue (million), by Country 2024 & 2032
- Figure 24: South America Processed Macadamia Nuts Volume (K), by Country 2024 & 2032
- Figure 25: South America Processed Macadamia Nuts Revenue Share (%), by Country 2024 & 2032
- Figure 26: South America Processed Macadamia Nuts Volume Share (%), by Country 2024 & 2032
- Figure 27: Europe Processed Macadamia Nuts Revenue (million), by Application 2024 & 2032
- Figure 28: Europe Processed Macadamia Nuts Volume (K), by Application 2024 & 2032
- Figure 29: Europe Processed Macadamia Nuts Revenue Share (%), by Application 2024 & 2032
- Figure 30: Europe Processed Macadamia Nuts Volume Share (%), by Application 2024 & 2032
- Figure 31: Europe Processed Macadamia Nuts Revenue (million), by Types 2024 & 2032
- Figure 32: Europe Processed Macadamia Nuts Volume (K), by Types 2024 & 2032
- Figure 33: Europe Processed Macadamia Nuts Revenue Share (%), by Types 2024 & 2032
- Figure 34: Europe Processed Macadamia Nuts Volume Share (%), by Types 2024 & 2032
- Figure 35: Europe Processed Macadamia Nuts Revenue (million), by Country 2024 & 2032
- Figure 36: Europe Processed Macadamia Nuts Volume (K), by Country 2024 & 2032
- Figure 37: Europe Processed Macadamia Nuts Revenue Share (%), by Country 2024 & 2032
- Figure 38: Europe Processed Macadamia Nuts Volume Share (%), by Country 2024 & 2032
- Figure 39: Middle East & Africa Processed Macadamia Nuts Revenue (million), by Application 2024 & 2032
- Figure 40: Middle East & Africa Processed Macadamia Nuts Volume (K), by Application 2024 & 2032
- Figure 41: Middle East & Africa Processed Macadamia Nuts Revenue Share (%), by Application 2024 & 2032
- Figure 42: Middle East & Africa Processed Macadamia Nuts Volume Share (%), by Application 2024 & 2032
- Figure 43: Middle East & Africa Processed Macadamia Nuts Revenue (million), by Types 2024 & 2032
- Figure 44: Middle East & Africa Processed Macadamia Nuts Volume (K), by Types 2024 & 2032
- Figure 45: Middle East & Africa Processed Macadamia Nuts Revenue Share (%), by Types 2024 & 2032
- Figure 46: Middle East & Africa Processed Macadamia Nuts Volume Share (%), by Types 2024 & 2032
- Figure 47: Middle East & Africa Processed Macadamia Nuts Revenue (million), by Country 2024 & 2032
- Figure 48: Middle East & Africa Processed Macadamia Nuts Volume (K), by Country 2024 & 2032
- Figure 49: Middle East & Africa Processed Macadamia Nuts Revenue Share (%), by Country 2024 & 2032
- Figure 50: Middle East & Africa Processed Macadamia Nuts Volume Share (%), by Country 2024 & 2032
- Figure 51: Asia Pacific Processed Macadamia Nuts Revenue (million), by Application 2024 & 2032
- Figure 52: Asia Pacific Processed Macadamia Nuts Volume (K), by Application 2024 & 2032
- Figure 53: Asia Pacific Processed Macadamia Nuts Revenue Share (%), by Application 2024 & 2032
- Figure 54: Asia Pacific Processed Macadamia Nuts Volume Share (%), by Application 2024 & 2032
- Figure 55: Asia Pacific Processed Macadamia Nuts Revenue (million), by Types 2024 & 2032
- Figure 56: Asia Pacific Processed Macadamia Nuts Volume (K), by Types 2024 & 2032
- Figure 57: Asia Pacific Processed Macadamia Nuts Revenue Share (%), by Types 2024 & 2032
- Figure 58: Asia Pacific Processed Macadamia Nuts Volume Share (%), by Types 2024 & 2032
- Figure 59: Asia Pacific Processed Macadamia Nuts Revenue (million), by Country 2024 & 2032
- Figure 60: Asia Pacific Processed Macadamia Nuts Volume (K), by Country 2024 & 2032
- Figure 61: Asia Pacific Processed Macadamia Nuts Revenue Share (%), by Country 2024 & 2032
- Figure 62: Asia Pacific Processed Macadamia Nuts Volume Share (%), by Country 2024 & 2032
List of Tables
- Table 1: Global Processed Macadamia Nuts Revenue million Forecast, by Region 2019 & 2032
- Table 2: Global Processed Macadamia Nuts Volume K Forecast, by Region 2019 & 2032
- Table 3: Global Processed Macadamia Nuts Revenue million Forecast, by Application 2019 & 2032
- Table 4: Global Processed Macadamia Nuts Volume K Forecast, by Application 2019 & 2032
- Table 5: Global Processed Macadamia Nuts Revenue million Forecast, by Types 2019 & 2032
- Table 6: Global Processed Macadamia Nuts Volume K Forecast, by Types 2019 & 2032
- Table 7: Global Processed Macadamia Nuts Revenue million Forecast, by Region 2019 & 2032
- Table 8: Global Processed Macadamia Nuts Volume K Forecast, by Region 2019 & 2032
- Table 9: Global Processed Macadamia Nuts Revenue million Forecast, by Application 2019 & 2032
- Table 10: Global Processed Macadamia Nuts Volume K Forecast, by Application 2019 & 2032
- Table 11: Global Processed Macadamia Nuts Revenue million Forecast, by Types 2019 & 2032
- Table 12: Global Processed Macadamia Nuts Volume K Forecast, by Types 2019 & 2032
- Table 13: Global Processed Macadamia Nuts Revenue million Forecast, by Country 2019 & 2032
- Table 14: Global Processed Macadamia Nuts Volume K Forecast, by Country 2019 & 2032
- Table 15: United States Processed Macadamia Nuts Revenue (million) Forecast, by Application 2019 & 2032
- Table 16: United States Processed Macadamia Nuts Volume (K) Forecast, by Application 2019 & 2032
- Table 17: Canada Processed Macadamia Nuts Revenue (million) Forecast, by Application 2019 & 2032
- Table 18: Canada Processed Macadamia Nuts Volume (K) Forecast, by Application 2019 & 2032
- Table 19: Mexico Processed Macadamia Nuts Revenue (million) Forecast, by Application 2019 & 2032
- Table 20: Mexico Processed Macadamia Nuts Volume (K) Forecast, by Application 2019 & 2032
- Table 21: Global Processed Macadamia Nuts Revenue million Forecast, by Application 2019 & 2032
- Table 22: Global Processed Macadamia Nuts Volume K Forecast, by Application 2019 & 2032
- Table 23: Global Processed Macadamia Nuts Revenue million Forecast, by Types 2019 & 2032
- Table 24: Global Processed Macadamia Nuts Volume K Forecast, by Types 2019 & 2032
- Table 25: Global Processed Macadamia Nuts Revenue million Forecast, by Country 2019 & 2032
- Table 26: Global Processed Macadamia Nuts Volume K Forecast, by Country 2019 & 2032
- Table 27: Brazil Processed Macadamia Nuts Revenue (million) Forecast, by Application 2019 & 2032
- Table 28: Brazil Processed Macadamia Nuts Volume (K) Forecast, by Application 2019 & 2032
- Table 29: Argentina Processed Macadamia Nuts Revenue (million) Forecast, by Application 2019 & 2032
- Table 30: Argentina Processed Macadamia Nuts Volume (K) Forecast, by Application 2019 & 2032
- Table 31: Rest of South America Processed Macadamia Nuts Revenue (million) Forecast, by Application 2019 & 2032
- Table 32: Rest of South America Processed Macadamia Nuts Volume (K) Forecast, by Application 2019 & 2032
- Table 33: Global Processed Macadamia Nuts Revenue million Forecast, by Application 2019 & 2032
- Table 34: Global Processed Macadamia Nuts Volume K Forecast, by Application 2019 & 2032
- Table 35: Global Processed Macadamia Nuts Revenue million Forecast, by Types 2019 & 2032
- Table 36: Global Processed Macadamia Nuts Volume K Forecast, by Types 2019 & 2032
- Table 37: Global Processed Macadamia Nuts Revenue million Forecast, by Country 2019 & 2032
- Table 38: Global Processed Macadamia Nuts Volume K Forecast, by Country 2019 & 2032
- Table 39: United Kingdom Processed Macadamia Nuts Revenue (million) Forecast, by Application 2019 & 2032
- Table 40: United Kingdom Processed Macadamia Nuts Volume (K) Forecast, by Application 2019 & 2032
- Table 41: Germany Processed Macadamia Nuts Revenue (million) Forecast, by Application 2019 & 2032
- Table 42: Germany Processed Macadamia Nuts Volume (K) Forecast, by Application 2019 & 2032
- Table 43: France Processed Macadamia Nuts Revenue (million) Forecast, by Application 2019 & 2032
- Table 44: France Processed Macadamia Nuts Volume (K) Forecast, by Application 2019 & 2032
- Table 45: Italy Processed Macadamia Nuts Revenue (million) Forecast, by Application 2019 & 2032
- Table 46: Italy Processed Macadamia Nuts Volume (K) Forecast, by Application 2019 & 2032
- Table 47: Spain Processed Macadamia Nuts Revenue (million) Forecast, by Application 2019 & 2032
- Table 48: Spain Processed Macadamia Nuts Volume (K) Forecast, by Application 2019 & 2032
- Table 49: Russia Processed Macadamia Nuts Revenue (million) Forecast, by Application 2019 & 2032
- Table 50: Russia Processed Macadamia Nuts Volume (K) Forecast, by Application 2019 & 2032
- Table 51: Benelux Processed Macadamia Nuts Revenue (million) Forecast, by Application 2019 & 2032
- Table 52: Benelux Processed Macadamia Nuts Volume (K) Forecast, by Application 2019 & 2032
- Table 53: Nordics Processed Macadamia Nuts Revenue (million) Forecast, by Application 2019 & 2032
- Table 54: Nordics Processed Macadamia Nuts Volume (K) Forecast, by Application 2019 & 2032
- Table 55: Rest of Europe Processed Macadamia Nuts Revenue (million) Forecast, by Application 2019 & 2032
- Table 56: Rest of Europe Processed Macadamia Nuts Volume (K) Forecast, by Application 2019 & 2032
- Table 57: Global Processed Macadamia Nuts Revenue million Forecast, by Application 2019 & 2032
- Table 58: Global Processed Macadamia Nuts Volume K Forecast, by Application 2019 & 2032
- Table 59: Global Processed Macadamia Nuts Revenue million Forecast, by Types 2019 & 2032
- Table 60: Global Processed Macadamia Nuts Volume K Forecast, by Types 2019 & 2032
- Table 61: Global Processed Macadamia Nuts Revenue million Forecast, by Country 2019 & 2032
- Table 62: Global Processed Macadamia Nuts Volume K Forecast, by Country 2019 & 2032
- Table 63: Turkey Processed Macadamia Nuts Revenue (million) Forecast, by Application 2019 & 2032
- Table 64: Turkey Processed Macadamia Nuts Volume (K) Forecast, by Application 2019 & 2032
- Table 65: Israel Processed Macadamia Nuts Revenue (million) Forecast, by Application 2019 & 2032
- Table 66: Israel Processed Macadamia Nuts Volume (K) Forecast, by Application 2019 & 2032
- Table 67: GCC Processed Macadamia Nuts Revenue (million) Forecast, by Application 2019 & 2032
- Table 68: GCC Processed Macadamia Nuts Volume (K) Forecast, by Application 2019 & 2032
- Table 69: North Africa Processed Macadamia Nuts Revenue (million) Forecast, by Application 2019 & 2032
- Table 70: North Africa Processed Macadamia Nuts Volume (K) Forecast, by Application 2019 & 2032
- Table 71: South Africa Processed Macadamia Nuts Revenue (million) Forecast, by Application 2019 & 2032
- Table 72: South Africa Processed Macadamia Nuts Volume (K) Forecast, by Application 2019 & 2032
- Table 73: Rest of Middle East & Africa Processed Macadamia Nuts Revenue (million) Forecast, by Application 2019 & 2032
- Table 74: Rest of Middle East & Africa Processed Macadamia Nuts Volume (K) Forecast, by Application 2019 & 2032
- Table 75: Global Processed Macadamia Nuts Revenue million Forecast, by Application 2019 & 2032
- Table 76: Global Processed Macadamia Nuts Volume K Forecast, by Application 2019 & 2032
- Table 77: Global Processed Macadamia Nuts Revenue million Forecast, by Types 2019 & 2032
- Table 78: Global Processed Macadamia Nuts Volume K Forecast, by Types 2019 & 2032
- Table 79: Global Processed Macadamia Nuts Revenue million Forecast, by Country 2019 & 2032
- Table 80: Global Processed Macadamia Nuts Volume K Forecast, by Country 2019 & 2032
- Table 81: China Processed Macadamia Nuts Revenue (million) Forecast, by Application 2019 & 2032
- Table 82: China Processed Macadamia Nuts Volume (K) Forecast, by Application 2019 & 2032
- Table 83: India Processed Macadamia Nuts Revenue (million) Forecast, by Application 2019 & 2032
- Table 84: India Processed Macadamia Nuts Volume (K) Forecast, by Application 2019 & 2032
- Table 85: Japan Processed Macadamia Nuts Revenue (million) Forecast, by Application 2019 & 2032
- Table 86: Japan Processed Macadamia Nuts Volume (K) Forecast, by Application 2019 & 2032
- Table 87: South Korea Processed Macadamia Nuts Revenue (million) Forecast, by Application 2019 & 2032
- Table 88: South Korea Processed Macadamia Nuts Volume (K) Forecast, by Application 2019 & 2032
- Table 89: ASEAN Processed Macadamia Nuts Revenue (million) Forecast, by Application 2019 & 2032
- Table 90: ASEAN Processed Macadamia Nuts Volume (K) Forecast, by Application 2019 & 2032
- Table 91: Oceania Processed Macadamia Nuts Revenue (million) Forecast, by Application 2019 & 2032
- Table 92: Oceania Processed Macadamia Nuts Volume (K) Forecast, by Application 2019 & 2032
- Table 93: Rest of Asia Pacific Processed Macadamia Nuts Revenue (million) Forecast, by Application 2019 & 2032
- Table 94: Rest of Asia Pacific Processed Macadamia Nuts Volume (K) Forecast, by Application 2019 & 2032
Frequently Asked Questions
1. What is the projected Compound Annual Growth Rate (CAGR) of the Processed Macadamia Nuts?
The projected CAGR is approximately XX%.
2. Which companies are prominent players in the Processed Macadamia Nuts?
Key companies in the market include Marquis Macadamias, Golden Macadamias, Mauna Loa Macadamia Nut Corp, Buderim Group, Kenya Nut Company, Nambucca Macnuts, Ivory Macadamias, Eastern Produce, Hamakua Macadamia Nut Company.
3. What are the main segments of the Processed Macadamia Nuts?
The market segments include Application, Types.
4. Can you provide details about the market size?
The market size is estimated to be USD XXX million as of 2022.
5. What are some drivers contributing to market growth?
N/A
6. What are the notable trends driving market growth?
N/A
7. Are there any restraints impacting market growth?
N/A
8. Can you provide examples of recent developments in the market?
N/A
9. What pricing options are available for accessing the report?
Pricing options include single-user, multi-user, and enterprise licenses priced at USD 3350.00, USD 5025.00, and USD 6700.00 respectively.
10. Is the market size provided in terms of value or volume?
The market size is provided in terms of value, measured in million and volume, measured in K.
11. Are there any specific market keywords associated with the report?
Yes, the market keyword associated with the report is "Processed Macadamia Nuts," which aids in identifying and referencing the specific market segment covered.
12. How do I determine which pricing option suits my needs best?
The pricing options vary based on user requirements and access needs. Individual users may opt for single-user licenses, while businesses requiring broader access may choose multi-user or enterprise licenses for cost-effective access to the report.
13. Are there any additional resources or data provided in the Processed Macadamia Nuts report?
While the report offers comprehensive insights, it's advisable to review the specific contents or supplementary materials provided to ascertain if additional resources or data are available.
14. How can I stay updated on further developments or reports in the Processed Macadamia Nuts?
To stay informed about further developments, trends, and reports in the Processed Macadamia Nuts, consider subscribing to industry newsletters, following relevant companies and organizations, or regularly checking reputable industry news sources and publications.
Methodology
Step 1 - Identification of Relevant Samples Size from Population Database


Step 2 - Approaches for Defining Global Market Size (Value, Volume* & Price*)

Note*: In applicable scenarios
Step 3 - Data Sources
Primary Research
- Web Analytics
- Survey Reports
- Research Institute
- Latest Research Reports
- Opinion Leaders
Secondary Research
- Annual Reports
- White Paper
- Latest Press Release
- Industry Association
- Paid Database
- Investor Presentations

Step 4 - Data Triangulation
Involves using different sources of information in order to increase the validity of a study
These sources are likely to be stakeholders in a program - participants, other researchers, program staff, other community members, and so on.
Then we put all data in single framework & apply various statistical tools to find out the dynamic on the market.
During the analysis stage, feedback from the stakeholder groups would be compared to determine areas of agreement as well as areas of divergence
