

Key Insights
The Product Information Management (PIM) solutions market is experiencing robust growth, projected to reach $15.62 billion in 2025 and maintain a Compound Annual Growth Rate (CAGR) of 15.41% from 2025 to 2033. This expansion is driven by several key factors. The increasing need for businesses to manage vast amounts of product data efficiently and consistently across multiple channels (e-commerce, marketplaces, physical stores) is a primary driver. The rise of omnichannel commerce necessitates accurate, consistent, and enriched product information to enhance customer experience and drive sales. Furthermore, the growing adoption of cloud-based PIM solutions offers scalability, accessibility, and cost-effectiveness, fueling market growth. The increasing complexity of product catalogs, particularly in industries like retail and manufacturing, demands sophisticated PIM systems capable of handling diverse data formats and attributes. Finally, regulatory compliance mandates, particularly regarding product information accuracy and transparency, are pushing businesses to adopt PIM solutions.
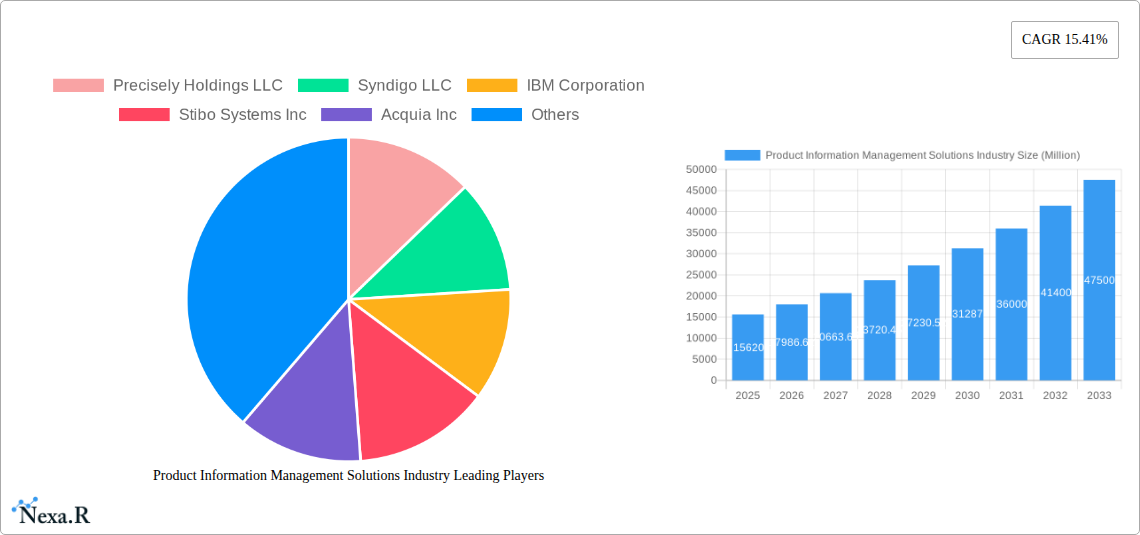
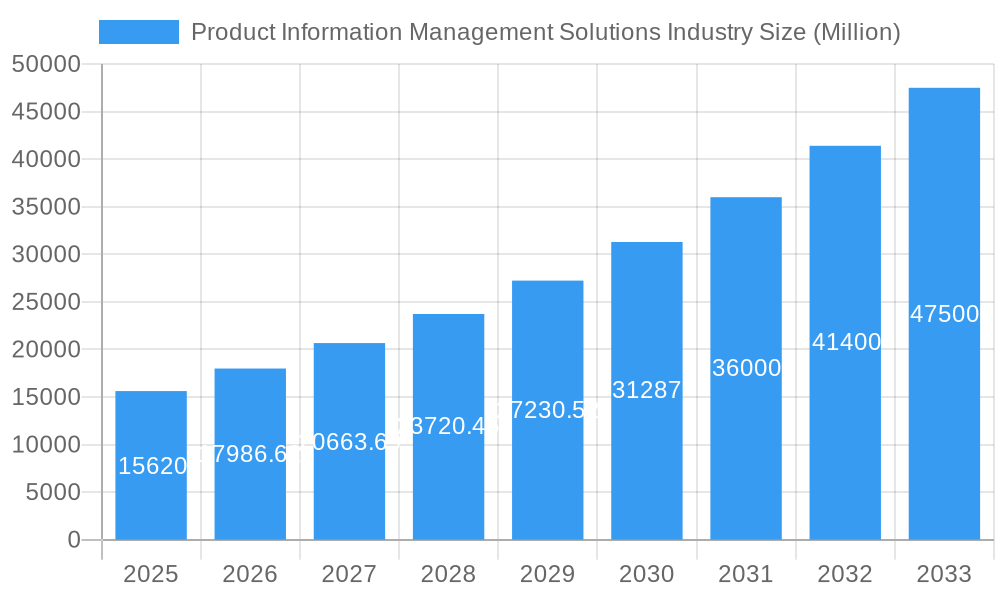
Product Information Management Solutions Industry Market Size (In Billion)
The market segmentation reveals significant opportunities across various deployment models (cloud-based solutions experiencing faster growth than on-premise), offering types (solutions dominating over services due to higher initial investment), and end-user industries. The BFSI (Banking, Financial Services, and Insurance), retail, and media & entertainment sectors are significant contributors to market revenue, reflecting their high reliance on accurate and consistent product data. However, the market faces certain restraints, including the initial high implementation cost of some PIM solutions and the complexity of integrating them with existing enterprise systems. Nevertheless, the long-term benefits in terms of improved operational efficiency, reduced errors, and enhanced customer experience are expected to outweigh these challenges, ensuring continued market expansion. The competitive landscape is dynamic, with established players like IBM and SAP competing with specialized PIM vendors like Stibo Systems and Akeneo. This competitive pressure fosters innovation and drives the development of increasingly sophisticated and user-friendly solutions, further boosting market growth.
Product Information Management Solutions Industry Company Market Share
Product Information Management (PIM) Solutions Market Report: 2019-2033
This comprehensive report provides a detailed analysis of the Product Information Management (PIM) Solutions market, encompassing market dynamics, growth trends, regional dominance, product landscape, key players, and future outlook. The study period covers 2019-2033, with 2025 as the base year and a forecast period of 2025-2033. The report segments the market by deployment (cloud, on-premise), offering (solution, services), and end-user industry (BFSI, Media & Entertainment, Retail, Energy & Utilities, Healthcare, IT & Telecommunications, Transportation & Logistics, Others). The market size is valued in million units.
Product Information Management Solutions Industry Market Dynamics & Structure
The Product Information Management (PIM) Solutions market is experiencing robust and sustained growth, fueled by the imperative for highly accurate, consistent, and enriched product data across an ever-expanding array of customer touchpoints and sales channels. The market landscape is characterized by moderate concentration, with a dynamic interplay between established leaders and emerging innovators. Technological advancements are fundamentally reshaping the sector, with AI and machine learning now integral to automating and optimizing product information enrichment, syndication, and governance. Furthermore, evolving global regulatory frameworks, particularly concerning data privacy (e.g., GDPR, CCPA) and product compliance, are increasingly influencing PIM solution strategies and driving demand for secure, compliant platforms. While the market faces ongoing competitive pressures from less sophisticated solutions like spreadsheets and basic content management systems, the inherent limitations of these alternatives underscore the critical need for dedicated PIM capabilities. Demand is escalating across a broad spectrum of industries, with particular traction in sectors that rely heavily on rich product content for customer engagement and sales. Merger and acquisition (M&A) activities remain a consistent feature, with strategic transactions aimed at expanding platform capabilities, enhancing market reach, and consolidating the vendor ecosystem.
- Market Concentration: Moderately concentrated, with the top 5 players estimated to hold approximately 60-70% of the market share (2024).
- Technological Innovation: Significant advancements in AI-powered product information enrichment, machine learning for data quality, advanced analytics, and seamless integration capabilities with core enterprise systems (ERP, CRM, e-commerce platforms).
- Regulatory Frameworks: Stringent compliance requirements for data privacy (GDPR, CCPA) and product safety regulations are key drivers for adopting secure and auditable PIM solutions.
- Competitive Substitutes: While spreadsheets and basic CMS solutions persist, their inability to scale, manage complex data relationships, and ensure channel consistency makes them inadequate for modern commerce.
- End-User Demographics: Broad and accelerating adoption across retail, e-commerce, manufacturing, and consumer packaged goods (CPG) sectors, with a growing interest from B2B enterprises seeking to streamline their product catalogs.
- M&A Trends: Approximately 15-20 significant M&A deals have occurred in the last 5 years, with a clear focus on acquiring specialized technologies (e.g., AI, DAM), expanding global presence, and acquiring complementary software vendors.
Product Information Management Solutions Industry Growth Trends & Insights
The global Product Information Management (PIM) Solutions market exhibited robust growth during the historical period (2019-2024), driven by the rise of e-commerce and the increasing complexity of managing product information across multiple channels. The market is projected to continue its expansion throughout the forecast period (2025-2033), fueled by the growing demand for omnichannel commerce and the rising adoption of cloud-based PIM solutions. Technological advancements, such as AI-powered product information enrichment and improved data integration capabilities, are further accelerating market growth. Consumer behavior shifts, particularly the increasing preference for personalized shopping experiences, are creating a need for more sophisticated PIM systems. The market is expected to experience a Compound Annual Growth Rate (CAGR) of xx% during the forecast period, reaching a market value of xx million units by 2033. Market penetration is currently at xx% and is expected to reach xx% by 2033.
Dominant Regions, Countries, or Segments in Product Information Management Solutions Industry
North America currently holds the largest market share in the PIM Solutions industry, driven by the high adoption rate of e-commerce and the presence of several major PIM vendors. Europe and Asia-Pacific are also witnessing significant growth, fueled by the increasing digitalization of businesses in these regions.
By Deployment: The cloud-based deployment model is dominating the market, driven by its scalability, cost-effectiveness, and ease of access.
By Offering: PIM solutions are the primary revenue driver, due to their comprehensive functionality and ability to meet the diverse needs of businesses.
By End-user Industry: Retail and e-commerce are the leading segments, driven by the high volume of product information required to support online sales.
- Key Drivers: Strong e-commerce growth, increasing need for omnichannel strategies, rising demand for data quality and accuracy.
- North America Dominance: High e-commerce adoption, significant presence of major PIM vendors, strong technological infrastructure.
- Growth Potential: Asia-Pacific and emerging markets offer substantial growth opportunities due to increasing internet penetration and rising e-commerce adoption.
Product Information Management Solutions Industry Product Landscape
The Product Information Management (PIM) solutions market offers a diverse range of products, from basic PIM solutions suitable for small businesses to comprehensive enterprise-grade platforms with advanced features such as AI-powered enrichment, multi-lingual support, and robust workflow management. Many solutions offer seamless integration with other enterprise systems, such as ERP and CRM, ensuring efficient data flow and enhanced operational efficiency. Key performance metrics include data accuracy, time-to-market, and overall efficiency gains. Unique selling propositions focus on usability, scalability, and advanced features, allowing businesses to tailor their PIM solution to their specific needs.
Key Drivers, Barriers & Challenges in Product Information Management Solutions Industry
Key Drivers:
- The accelerating shift towards omnichannel and cross-channel commerce strategies demands unified and consistent product information.
- An increasing organizational focus on data quality, accuracy, and completeness to enhance brand perception and customer trust.
- The widespread adoption of cloud-based PIM solutions, offering scalability, flexibility, and cost-effectiveness.
- The critical need for elevated customer experiences through rich, accurate, and compelling product content, leading to higher conversion rates and reduced returns.
- The imperative for efficient product content creation, syndication, and governance to accelerate time-to-market.
Challenges and Restraints:
- Significant initial investment costs associated with software licensing, implementation services, and necessary infrastructure.
- The inherent complexity of integrating PIM solutions with diverse existing enterprise systems (ERP, CRM, DAM, e-commerce platforms) and workflows.
- Challenges related to the migration of large volumes of existing product data from disparate sources into a new PIM system, often involving data cleansing and standardization.
- A persistent shortage of skilled professionals with expertise in PIM implementation, data governance, and solution management. The cumulative impact of these challenges is estimated to potentially temper market growth by 5-10% over the next 5 years.
Emerging Opportunities in Product Information Management Solutions Industry
- Growth in emerging markets: Untapped potential in developing economies with increasing digital adoption.
- Integration with AI and ML: Enhanced product information enrichment, personalized recommendations, and improved search capabilities.
- Focus on B2B e-commerce: Increasing demand for efficient PIM solutions to manage complex product catalogs in B2B settings.
- Expansion into new industry verticals: Applications in healthcare, pharmaceuticals and other specialized sectors with strict regulatory requirements.
Growth Accelerators in the Product Information Management Solutions Industry
Technological advancements, including the increasing sophistication of AI for automated data enrichment, content generation, and validation, alongside strategic partnerships between PIM vendors and complementary technology providers (e.g., DAM, e-commerce platforms, marketing automation tools), will serve as pivotal growth accelerators for the Product Information Management Solutions industry. Furthermore, aggressive market expansion strategies by vendors into emerging economies and underserved sectors, coupled with the continuous development of more intuitive and user-friendly interfaces, are expected to drive broader adoption and unlock new market segments.
Key Players Shaping the Product Information Management Solutions Industry Market
Notable Milestones in Product Information Management Solutions Industry Sector
- March 2024: Akeneo launched the Akeneo PIM App for Salesforce on Salesforce AppExchange, providing deeper integration and enhanced product information management capabilities directly within the Salesforce ecosystem, simplifying workflows for sales and service teams.
- February 2024: Salsify released Salsify PXM Advance, a significant evolution of their platform, focusing on improving end-to-end product experience management operations by enhancing content syndication, personalization capabilities, and collaboration features.
- January 2024: inriver announced its acquisition of Brandfolder, a leading Digital Asset Management (DAM) platform, aiming to create a more comprehensive solution for managing and delivering rich product content and digital assets seamlessly.
In-Depth Product Information Management Solutions Industry Market Outlook
The Product Information Management Solutions market is firmly positioned for continued and accelerated growth. This trajectory is underpinned by the ongoing evolution of digital commerce, the relentless pursuit of exceptional customer experiences, and the increasing recognition of high-quality product data as a strategic asset. As businesses grapple with complex product catalogs and multi-channel distribution, PIM solutions are becoming indispensable for operational efficiency, competitive differentiation, and revenue growth. The market will likely witness further consolidation through strategic acquisitions and partnerships, fostering innovation and driving the development of more integrated and intelligent PIM/PXM (Product Experience Management) platforms. The future is exceptionally bright for the PIM market, offering substantial opportunities for vendors and adopters alike to thrive in an increasingly data-driven and customer-centric global economy, with significant expansion potential in both mature and rapidly developing markets.
Product Information Management Solutions Industry Segmentation
-
1. Deployment
- 1.1. Cloud
- 1.2. On-premise
-
2. Offering
- 2.1. Solution
- 2.2. Services
-
3. End-user Industry
- 3.1. BFSI
- 3.2. Media and Entertainment
- 3.3. Retail
- 3.4. Energy and Utilities
- 3.5. Healthcare
- 3.6. IT and Telecommunications
- 3.7. Transportation and Logistics
- 3.8. Other End-user Industries
Product Information Management Solutions Industry Segmentation By Geography
- 1. North America
- 2. Europe
- 3. Asia
- 4. Australia and New Zealand
- 5. Latin America
- 6. Middle East and Africa
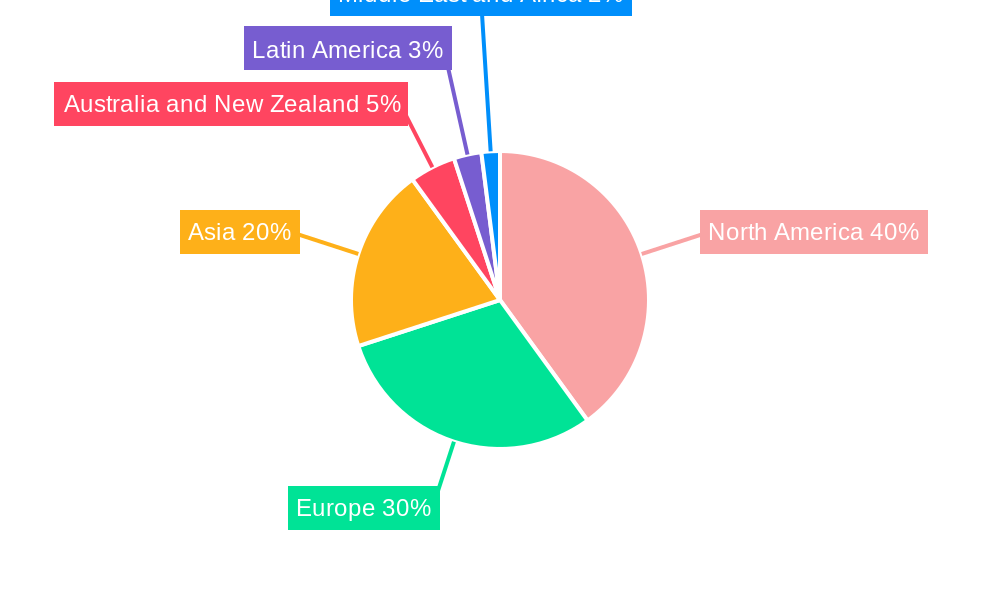
Product Information Management Solutions Industry Regional Market Share
Geographic Coverage of Product Information Management Solutions Industry
Product Information Management Solutions Industry REPORT HIGHLIGHTS
| Aspects | Details |
|---|---|
| Study Period | 2020-2034 |
| Base Year | 2025 |
| Estimated Year | 2026 |
| Forecast Period | 2026-2034 |
| Historical Period | 2020-2025 |
| Growth Rate | CAGR of 15.41% from 2020-2034 |
| Segmentation |
|
Table of Contents
- 1. Introduction
- 1.1. Research Scope
- 1.2. Market Segmentation
- 1.3. Research Objective
- 1.4. Definitions and Assumptions
- 2. Executive Summary
- 2.1. Market Snapshot
- 3. Market Dynamics
- 3.1. Market Drivers
- 3.2. Market Restrains
- 3.3. Market Trends
- 3.4. Market Opportunities
- 4. Market Factor Analysis
- 4.1. Porters Five Forces
- 4.1.1. Bargaining Power of Suppliers
- 4.1.2. Bargaining Power of Buyers
- 4.1.3. Threat of New Entrants
- 4.1.4. Threat of Substitutes
- 4.1.5. Competitive Rivalry
- 4.2. PESTEL analysis
- 4.3. BCG Analysis
- 4.3.1. Stars (High Growth, High Market Share)
- 4.3.2. Cash Cows (Low Growth, High Market Share)
- 4.3.3. Question Mark (High Growth, Low Market Share)
- 4.3.4. Dogs (Low Growth, Low Market Share)
- 4.4. Ansoff Matrix Analysis
- 4.5. Supply Chain Analysis
- 4.6. Regulatory Landscape
- 4.7. Current Market Potential and Opportunity Assessment (TAM–SAM–SOM Framework)
- 4.8. NRP Analyst Note
- 4.1. Porters Five Forces
- 5. Market Analysis, Insights and Forecast 2021-2033
- 5.1. Market Analysis, Insights and Forecast - by Deployment
- 5.1.1. Cloud
- 5.1.2. On-premise
- 5.2. Market Analysis, Insights and Forecast - by Offering
- 5.2.1. Solution
- 5.2.2. Services
- 5.3. Market Analysis, Insights and Forecast - by End-user Industry
- 5.3.1. BFSI
- 5.3.2. Media and Entertainment
- 5.3.3. Retail
- 5.3.4. Energy and Utilities
- 5.3.5. Healthcare
- 5.3.6. IT and Telecommunications
- 5.3.7. Transportation and Logistics
- 5.3.8. Other End-user Industries
- 5.4. Market Analysis, Insights and Forecast - by Region
- 5.4.1. North America
- 5.4.2. Europe
- 5.4.3. Asia
- 5.4.4. Australia and New Zealand
- 5.4.5. Latin America
- 5.4.6. Middle East and Africa
- 5.1. Market Analysis, Insights and Forecast - by Deployment
- 6. Global Product Information Management Solutions Industry Analysis, Insights and Forecast, 2021-2033
- 6.1. Market Analysis, Insights and Forecast - by Deployment
- 6.1.1. Cloud
- 6.1.2. On-premise
- 6.2. Market Analysis, Insights and Forecast - by Offering
- 6.2.1. Solution
- 6.2.2. Services
- 6.3. Market Analysis, Insights and Forecast - by End-user Industry
- 6.3.1. BFSI
- 6.3.2. Media and Entertainment
- 6.3.3. Retail
- 6.3.4. Energy and Utilities
- 6.3.5. Healthcare
- 6.3.6. IT and Telecommunications
- 6.3.7. Transportation and Logistics
- 6.3.8. Other End-user Industries
- 6.1. Market Analysis, Insights and Forecast - by Deployment
- 7. North America Product Information Management Solutions Industry Analysis, Insights and Forecast, 2020-2032
- 7.1. Market Analysis, Insights and Forecast - by Deployment
- 7.1.1. Cloud
- 7.1.2. On-premise
- 7.2. Market Analysis, Insights and Forecast - by Offering
- 7.2.1. Solution
- 7.2.2. Services
- 7.3. Market Analysis, Insights and Forecast - by End-user Industry
- 7.3.1. BFSI
- 7.3.2. Media and Entertainment
- 7.3.3. Retail
- 7.3.4. Energy and Utilities
- 7.3.5. Healthcare
- 7.3.6. IT and Telecommunications
- 7.3.7. Transportation and Logistics
- 7.3.8. Other End-user Industries
- 7.1. Market Analysis, Insights and Forecast - by Deployment
- 8. Europe Product Information Management Solutions Industry Analysis, Insights and Forecast, 2020-2032
- 8.1. Market Analysis, Insights and Forecast - by Deployment
- 8.1.1. Cloud
- 8.1.2. On-premise
- 8.2. Market Analysis, Insights and Forecast - by Offering
- 8.2.1. Solution
- 8.2.2. Services
- 8.3. Market Analysis, Insights and Forecast - by End-user Industry
- 8.3.1. BFSI
- 8.3.2. Media and Entertainment
- 8.3.3. Retail
- 8.3.4. Energy and Utilities
- 8.3.5. Healthcare
- 8.3.6. IT and Telecommunications
- 8.3.7. Transportation and Logistics
- 8.3.8. Other End-user Industries
- 8.1. Market Analysis, Insights and Forecast - by Deployment
- 9. Asia Product Information Management Solutions Industry Analysis, Insights and Forecast, 2020-2032
- 9.1. Market Analysis, Insights and Forecast - by Deployment
- 9.1.1. Cloud
- 9.1.2. On-premise
- 9.2. Market Analysis, Insights and Forecast - by Offering
- 9.2.1. Solution
- 9.2.2. Services
- 9.3. Market Analysis, Insights and Forecast - by End-user Industry
- 9.3.1. BFSI
- 9.3.2. Media and Entertainment
- 9.3.3. Retail
- 9.3.4. Energy and Utilities
- 9.3.5. Healthcare
- 9.3.6. IT and Telecommunications
- 9.3.7. Transportation and Logistics
- 9.3.8. Other End-user Industries
- 9.1. Market Analysis, Insights and Forecast - by Deployment
- 10. Australia and New Zealand Product Information Management Solutions Industry Analysis, Insights and Forecast, 2020-2032
- 10.1. Market Analysis, Insights and Forecast - by Deployment
- 10.1.1. Cloud
- 10.1.2. On-premise
- 10.2. Market Analysis, Insights and Forecast - by Offering
- 10.2.1. Solution
- 10.2.2. Services
- 10.3. Market Analysis, Insights and Forecast - by End-user Industry
- 10.3.1. BFSI
- 10.3.2. Media and Entertainment
- 10.3.3. Retail
- 10.3.4. Energy and Utilities
- 10.3.5. Healthcare
- 10.3.6. IT and Telecommunications
- 10.3.7. Transportation and Logistics
- 10.3.8. Other End-user Industries
- 10.1. Market Analysis, Insights and Forecast - by Deployment
- 11. Latin America Product Information Management Solutions Industry Analysis, Insights and Forecast, 2020-2032
- 11.1. Market Analysis, Insights and Forecast - by Deployment
- 11.1.1. Cloud
- 11.1.2. On-premise
- 11.2. Market Analysis, Insights and Forecast - by Offering
- 11.2.1. Solution
- 11.2.2. Services
- 11.3. Market Analysis, Insights and Forecast - by End-user Industry
- 11.3.1. BFSI
- 11.3.2. Media and Entertainment
- 11.3.3. Retail
- 11.3.4. Energy and Utilities
- 11.3.5. Healthcare
- 11.3.6. IT and Telecommunications
- 11.3.7. Transportation and Logistics
- 11.3.8. Other End-user Industries
- 11.1. Market Analysis, Insights and Forecast - by Deployment
- 12. Middle East and Africa Product Information Management Solutions Industry Analysis, Insights and Forecast, 2020-2032
- 12.1. Market Analysis, Insights and Forecast - by Deployment
- 12.1.1. Cloud
- 12.1.2. On-premise
- 12.2. Market Analysis, Insights and Forecast - by Offering
- 12.2.1. Solution
- 12.2.2. Services
- 12.3. Market Analysis, Insights and Forecast - by End-user Industry
- 12.3.1. BFSI
- 12.3.2. Media and Entertainment
- 12.3.3. Retail
- 12.3.4. Energy and Utilities
- 12.3.5. Healthcare
- 12.3.6. IT and Telecommunications
- 12.3.7. Transportation and Logistics
- 12.3.8. Other End-user Industries
- 12.1. Market Analysis, Insights and Forecast - by Deployment
- 13. Competitive Analysis
- 13.1. Company Profiles
- 13.1.1 Precisely Holdings LLC
- 13.1.1.1. Company Overview
- 13.1.1.2. Products
- 13.1.1.3. Company Financials
- 13.1.1.4. SWOT Analysis
- 13.1.2 Syndigo LLC
- 13.1.2.1. Company Overview
- 13.1.2.2. Products
- 13.1.2.3. Company Financials
- 13.1.2.4. SWOT Analysis
- 13.1.3 IBM Corporation
- 13.1.3.1. Company Overview
- 13.1.3.2. Products
- 13.1.3.3. Company Financials
- 13.1.3.4. SWOT Analysis
- 13.1.4 Stibo Systems Inc
- 13.1.4.1. Company Overview
- 13.1.4.2. Products
- 13.1.4.3. Company Financials
- 13.1.4.4. SWOT Analysis
- 13.1.5 Acquia Inc
- 13.1.5.1. Company Overview
- 13.1.5.2. Products
- 13.1.5.3. Company Financials
- 13.1.5.4. SWOT Analysis
- 13.1.6 Pimcore GMBH
- 13.1.6.1. Company Overview
- 13.1.6.2. Products
- 13.1.6.3. Company Financials
- 13.1.6.4. SWOT Analysis
- 13.1.7 Salsify Inc
- 13.1.7.1. Company Overview
- 13.1.7.2. Products
- 13.1.7.3. Company Financials
- 13.1.7.4. SWOT Analysis
- 13.1.8 Akeneo SAS
- 13.1.8.1. Company Overview
- 13.1.8.2. Products
- 13.1.8.3. Company Financials
- 13.1.8.4. SWOT Analysis
- 13.1.9 InRiver AB
- 13.1.9.1. Company Overview
- 13.1.9.2. Products
- 13.1.9.3. Company Financials
- 13.1.9.4. SWOT Analysis
- 13.1.10 Informatica LLC
- 13.1.10.1. Company Overview
- 13.1.10.2. Products
- 13.1.10.3. Company Financials
- 13.1.10.4. SWOT Analysis
- 13.1.11 Plytix Limited
- 13.1.11.1. Company Overview
- 13.1.11.2. Products
- 13.1.11.3. Company Financials
- 13.1.11.4. SWOT Analysis
- 13.1.12 SAP SE
- 13.1.12.1. Company Overview
- 13.1.12.2. Products
- 13.1.12.3. Company Financials
- 13.1.12.4. SWOT Analysis
- 13.1.13 Insight Software
- 13.1.13.1. Company Overview
- 13.1.13.2. Products
- 13.1.13.3. Company Financials
- 13.1.13.4. SWOT Analysis
- 13.1.1 Precisely Holdings LLC
- 13.2. Market Entropy
- 13.2.1 Company's Key Areas Served
- 13.2.2 Recent Developments
- 13.3. Company Market Share Analysis 2025
- 13.3.1 Top 5 Companies Market Share Analysis
- 13.3.2 Top 3 Companies Market Share Analysis
- 13.4. List of Potential Customers
- 14. Research Methodology
List of Figures
- Figure 1: Global Product Information Management Solutions Industry Revenue Breakdown (Million, %) by Region 2025 & 2033
- Figure 2: North America Product Information Management Solutions Industry Revenue (Million), by Deployment 2025 & 2033
- Figure 3: North America Product Information Management Solutions Industry Revenue Share (%), by Deployment 2025 & 2033
- Figure 4: North America Product Information Management Solutions Industry Revenue (Million), by Offering 2025 & 2033
- Figure 5: North America Product Information Management Solutions Industry Revenue Share (%), by Offering 2025 & 2033
- Figure 6: North America Product Information Management Solutions Industry Revenue (Million), by End-user Industry 2025 & 2033
- Figure 7: North America Product Information Management Solutions Industry Revenue Share (%), by End-user Industry 2025 & 2033
- Figure 8: North America Product Information Management Solutions Industry Revenue (Million), by Country 2025 & 2033
- Figure 9: North America Product Information Management Solutions Industry Revenue Share (%), by Country 2025 & 2033
- Figure 10: Europe Product Information Management Solutions Industry Revenue (Million), by Deployment 2025 & 2033
- Figure 11: Europe Product Information Management Solutions Industry Revenue Share (%), by Deployment 2025 & 2033
- Figure 12: Europe Product Information Management Solutions Industry Revenue (Million), by Offering 2025 & 2033
- Figure 13: Europe Product Information Management Solutions Industry Revenue Share (%), by Offering 2025 & 2033
- Figure 14: Europe Product Information Management Solutions Industry Revenue (Million), by End-user Industry 2025 & 2033
- Figure 15: Europe Product Information Management Solutions Industry Revenue Share (%), by End-user Industry 2025 & 2033
- Figure 16: Europe Product Information Management Solutions Industry Revenue (Million), by Country 2025 & 2033
- Figure 17: Europe Product Information Management Solutions Industry Revenue Share (%), by Country 2025 & 2033
- Figure 18: Asia Product Information Management Solutions Industry Revenue (Million), by Deployment 2025 & 2033
- Figure 19: Asia Product Information Management Solutions Industry Revenue Share (%), by Deployment 2025 & 2033
- Figure 20: Asia Product Information Management Solutions Industry Revenue (Million), by Offering 2025 & 2033
- Figure 21: Asia Product Information Management Solutions Industry Revenue Share (%), by Offering 2025 & 2033
- Figure 22: Asia Product Information Management Solutions Industry Revenue (Million), by End-user Industry 2025 & 2033
- Figure 23: Asia Product Information Management Solutions Industry Revenue Share (%), by End-user Industry 2025 & 2033
- Figure 24: Asia Product Information Management Solutions Industry Revenue (Million), by Country 2025 & 2033
- Figure 25: Asia Product Information Management Solutions Industry Revenue Share (%), by Country 2025 & 2033
- Figure 26: Australia and New Zealand Product Information Management Solutions Industry Revenue (Million), by Deployment 2025 & 2033
- Figure 27: Australia and New Zealand Product Information Management Solutions Industry Revenue Share (%), by Deployment 2025 & 2033
- Figure 28: Australia and New Zealand Product Information Management Solutions Industry Revenue (Million), by Offering 2025 & 2033
- Figure 29: Australia and New Zealand Product Information Management Solutions Industry Revenue Share (%), by Offering 2025 & 2033
- Figure 30: Australia and New Zealand Product Information Management Solutions Industry Revenue (Million), by End-user Industry 2025 & 2033
- Figure 31: Australia and New Zealand Product Information Management Solutions Industry Revenue Share (%), by End-user Industry 2025 & 2033
- Figure 32: Australia and New Zealand Product Information Management Solutions Industry Revenue (Million), by Country 2025 & 2033
- Figure 33: Australia and New Zealand Product Information Management Solutions Industry Revenue Share (%), by Country 2025 & 2033
- Figure 34: Latin America Product Information Management Solutions Industry Revenue (Million), by Deployment 2025 & 2033
- Figure 35: Latin America Product Information Management Solutions Industry Revenue Share (%), by Deployment 2025 & 2033
- Figure 36: Latin America Product Information Management Solutions Industry Revenue (Million), by Offering 2025 & 2033
- Figure 37: Latin America Product Information Management Solutions Industry Revenue Share (%), by Offering 2025 & 2033
- Figure 38: Latin America Product Information Management Solutions Industry Revenue (Million), by End-user Industry 2025 & 2033
- Figure 39: Latin America Product Information Management Solutions Industry Revenue Share (%), by End-user Industry 2025 & 2033
- Figure 40: Latin America Product Information Management Solutions Industry Revenue (Million), by Country 2025 & 2033
- Figure 41: Latin America Product Information Management Solutions Industry Revenue Share (%), by Country 2025 & 2033
- Figure 42: Middle East and Africa Product Information Management Solutions Industry Revenue (Million), by Deployment 2025 & 2033
- Figure 43: Middle East and Africa Product Information Management Solutions Industry Revenue Share (%), by Deployment 2025 & 2033
- Figure 44: Middle East and Africa Product Information Management Solutions Industry Revenue (Million), by Offering 2025 & 2033
- Figure 45: Middle East and Africa Product Information Management Solutions Industry Revenue Share (%), by Offering 2025 & 2033
- Figure 46: Middle East and Africa Product Information Management Solutions Industry Revenue (Million), by End-user Industry 2025 & 2033
- Figure 47: Middle East and Africa Product Information Management Solutions Industry Revenue Share (%), by End-user Industry 2025 & 2033
- Figure 48: Middle East and Africa Product Information Management Solutions Industry Revenue (Million), by Country 2025 & 2033
- Figure 49: Middle East and Africa Product Information Management Solutions Industry Revenue Share (%), by Country 2025 & 2033
List of Tables
- Table 1: Global Product Information Management Solutions Industry Revenue Million Forecast, by Deployment 2020 & 2033
- Table 2: Global Product Information Management Solutions Industry Revenue Million Forecast, by Offering 2020 & 2033
- Table 3: Global Product Information Management Solutions Industry Revenue Million Forecast, by End-user Industry 2020 & 2033
- Table 4: Global Product Information Management Solutions Industry Revenue Million Forecast, by Region 2020 & 2033
- Table 5: Global Product Information Management Solutions Industry Revenue Million Forecast, by Deployment 2020 & 2033
- Table 6: Global Product Information Management Solutions Industry Revenue Million Forecast, by Offering 2020 & 2033
- Table 7: Global Product Information Management Solutions Industry Revenue Million Forecast, by End-user Industry 2020 & 2033
- Table 8: Global Product Information Management Solutions Industry Revenue Million Forecast, by Country 2020 & 2033
- Table 9: Global Product Information Management Solutions Industry Revenue Million Forecast, by Deployment 2020 & 2033
- Table 10: Global Product Information Management Solutions Industry Revenue Million Forecast, by Offering 2020 & 2033
- Table 11: Global Product Information Management Solutions Industry Revenue Million Forecast, by End-user Industry 2020 & 2033
- Table 12: Global Product Information Management Solutions Industry Revenue Million Forecast, by Country 2020 & 2033
- Table 13: Global Product Information Management Solutions Industry Revenue Million Forecast, by Deployment 2020 & 2033
- Table 14: Global Product Information Management Solutions Industry Revenue Million Forecast, by Offering 2020 & 2033
- Table 15: Global Product Information Management Solutions Industry Revenue Million Forecast, by End-user Industry 2020 & 2033
- Table 16: Global Product Information Management Solutions Industry Revenue Million Forecast, by Country 2020 & 2033
- Table 17: Global Product Information Management Solutions Industry Revenue Million Forecast, by Deployment 2020 & 2033
- Table 18: Global Product Information Management Solutions Industry Revenue Million Forecast, by Offering 2020 & 2033
- Table 19: Global Product Information Management Solutions Industry Revenue Million Forecast, by End-user Industry 2020 & 2033
- Table 20: Global Product Information Management Solutions Industry Revenue Million Forecast, by Country 2020 & 2033
- Table 21: Global Product Information Management Solutions Industry Revenue Million Forecast, by Deployment 2020 & 2033
- Table 22: Global Product Information Management Solutions Industry Revenue Million Forecast, by Offering 2020 & 2033
- Table 23: Global Product Information Management Solutions Industry Revenue Million Forecast, by End-user Industry 2020 & 2033
- Table 24: Global Product Information Management Solutions Industry Revenue Million Forecast, by Country 2020 & 2033
- Table 25: Global Product Information Management Solutions Industry Revenue Million Forecast, by Deployment 2020 & 2033
- Table 26: Global Product Information Management Solutions Industry Revenue Million Forecast, by Offering 2020 & 2033
- Table 27: Global Product Information Management Solutions Industry Revenue Million Forecast, by End-user Industry 2020 & 2033
- Table 28: Global Product Information Management Solutions Industry Revenue Million Forecast, by Country 2020 & 2033
Frequently Asked Questions
1. What is the projected Compound Annual Growth Rate (CAGR) of the Product Information Management Solutions Industry?
The projected CAGR is approximately 15.41%.
2. Which companies are prominent players in the Product Information Management Solutions Industry?
Key companies in the market include Precisely Holdings LLC, Syndigo LLC, IBM Corporation, Stibo Systems Inc, Acquia Inc, Pimcore GMBH, Salsify Inc, Akeneo SAS, InRiver AB, Informatica LLC, Plytix Limited, SAP SE, Insight Software.
3. What are the main segments of the Product Information Management Solutions Industry?
The market segments include Deployment, Offering, End-user Industry.
4. Can you provide details about the market size?
The market size is estimated to be USD 15.62 Million as of 2022.
5. What are some drivers contributing to market growth?
Growing Demand for Better Customer Service; Growing Demand for Centralized Data Management Tools.
6. What are the notable trends driving market growth?
Retail Sector to Witness Growth.
7. Are there any restraints impacting market growth?
Increasing Data Breaching Cases.
8. Can you provide examples of recent developments in the market?
March 2024 - Akeneo announced it had launched the Akeneo PIM App for Salesforce on Salesforce AppExchange, an enterprise marketplace for partner apps and experts. The Akeneo App for Salesforce empowers customers to leverage complete, compelling, and consistent product information to unlock the full potential of Salesforce. Akeneo’s Product Cloud enables businesses to ingest, normalize, enrich, and centralize product information through enterprise-grade data modeling, governance, and workflows.
9. What pricing options are available for accessing the report?
Pricing options include single-user, multi-user, and enterprise licenses priced at USD 4750, USD 5250, and USD 8750 respectively.
10. Is the market size provided in terms of value or volume?
The market size is provided in terms of value, measured in Million.
11. Are there any specific market keywords associated with the report?
Yes, the market keyword associated with the report is "Product Information Management Solutions Industry," which aids in identifying and referencing the specific market segment covered.
12. How do I determine which pricing option suits my needs best?
The pricing options vary based on user requirements and access needs. Individual users may opt for single-user licenses, while businesses requiring broader access may choose multi-user or enterprise licenses for cost-effective access to the report.
13. Are there any additional resources or data provided in the Product Information Management Solutions Industry report?
While the report offers comprehensive insights, it's advisable to review the specific contents or supplementary materials provided to ascertain if additional resources or data are available.
14. How can I stay updated on further developments or reports in the Product Information Management Solutions Industry?
To stay informed about further developments, trends, and reports in the Product Information Management Solutions Industry, consider subscribing to industry newsletters, following relevant companies and organizations, or regularly checking reputable industry news sources and publications.
Methodology
Step 1 - Identification of Relevant Samples Size from Population Database


Step 2 - Approaches for Defining Global Market Size (Value, Volume* & Price*)

Note*: In applicable scenarios
Step 3 - Data Sources
Primary Research
- Web Analytics
- Survey Reports
- Research Institute
- Latest Research Reports
- Opinion Leaders
Secondary Research
- Annual Reports
- White Paper
- Latest Press Release
- Industry Association
- Paid Database
- Investor Presentations

Step 4 - Data Triangulation
Involves using different sources of information in order to increase the validity of a study
These sources are likely to be stakeholders in a program - participants, other researchers, program staff, other community members, and so on.
Then we put all data in single framework & apply various statistical tools to find out the dynamic on the market.
During the analysis stage, feedback from the stakeholder groups would be compared to determine areas of agreement as well as areas of divergence