

Key Insights
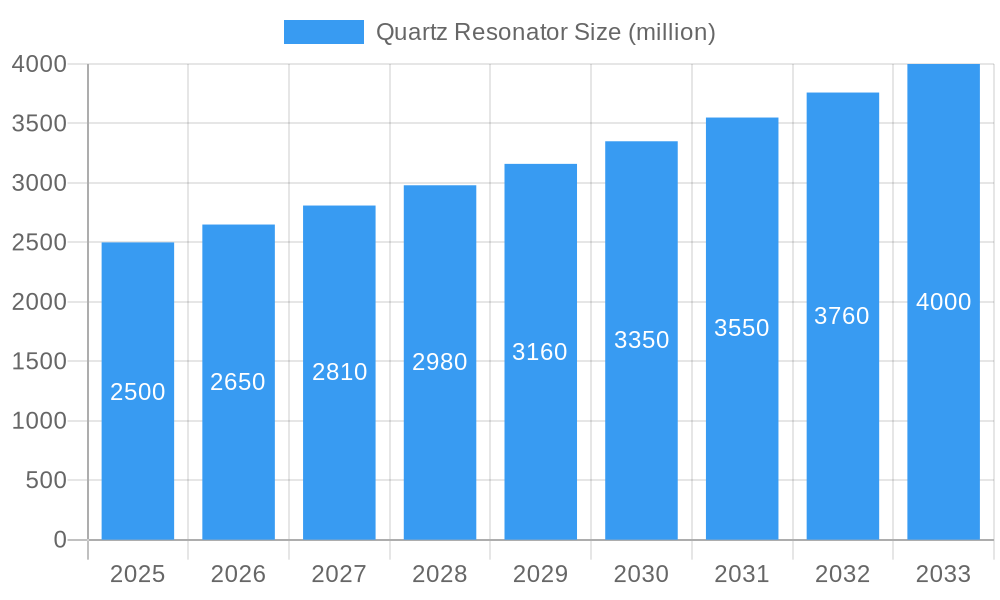
The global quartz resonator market is poised for significant expansion, propelled by the escalating demand for electronic devices across diverse industries. The market, valued at $2.89 billion in the base year of 2025, is projected to grow at a Compound Annual Growth Rate (CAGR) of 4.8% from 2025 to 2033, reaching an estimated $4 billion by 2033. Key growth drivers include the widespread adoption of smartphones, wearables, and Internet of Things (IoT) devices, all of which necessitate quartz resonators for precise frequency control and timekeeping. Technological advancements delivering smaller, more energy-efficient, and higher-precision resonators are also stimulating market growth. The automotive sector, with its increasing integration of advanced electronics for safety and performance, represents a substantial growth avenue. While supply chain volatilities and material cost fluctuations present minor challenges, the market outlook remains highly favorable. The market is segmented by type (e.g., crystal oscillators, surface mount resonators), application (e.g., consumer electronics, automotive, industrial), and region. Prominent companies such as Epson, TXC, and Robert Bosch are actively investing in research and development and strategic collaborations to solidify their market positions and capitalize on emerging trends.
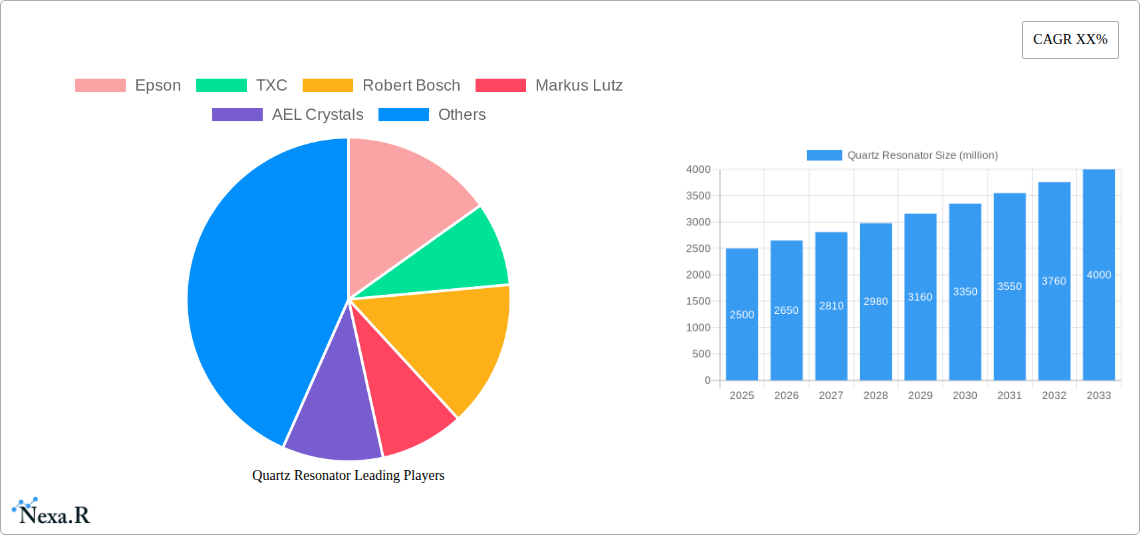
Quartz Resonator Market Size (In Billion)
Competition within the quartz resonator market is robust, featuring both established manufacturers and emerging players. The market landscape is characterized by strategic integrations, with companies focusing on specialized resonator types and applications. Geographic presence is extensive, with considerable market activity in Asia, North America, and Europe. Future growth will be contingent upon continuous technological innovation, the expansion of critical application segments (particularly 5G infrastructure and advanced driver-assistance systems), and manufacturers' adeptness in navigating supply chain complexities. Mergers, acquisitions, and strategic alliances are anticipated to shape market dynamics. Sustained investment in R&D, with a focus on miniaturization, enhanced precision, and improved performance, will be paramount for sustained market success.
Quartz Resonator Company Market Share
Quartz Resonator Market Report: 2019-2033
This comprehensive report provides an in-depth analysis of the global quartz resonator market, offering invaluable insights for industry professionals, investors, and strategic decision-makers. Covering the period from 2019 to 2033, with a base year of 2025 and a forecast period of 2025-2033, this report meticulously examines market dynamics, growth trends, key players, and future prospects. The study encompasses various segments within the parent market of electronic components and the child market of timing devices, providing a granular view of this vital industry.
Quartz Resonator Market Dynamics & Structure
The global quartz resonator market is characterized by a moderately concentrated landscape, with key players such as Epson, TXC, and Robert Bosch holding significant market share. The market is driven by continuous technological innovation, particularly in areas like miniaturization, improved frequency stability, and lower power consumption. Stringent regulatory frameworks concerning electronic component reliability and safety also shape market dynamics. Competitive substitutes, including MEMS resonators, are emerging, but quartz resonators maintain a strong position due to cost-effectiveness and mature technology. The end-user demographic spans diverse industries, including consumer electronics, automotive, telecommunications, and industrial automation. M&A activity has been moderate in recent years, with approximately xx deals recorded between 2019 and 2024, representing a total value of xx million USD.
- Market Concentration: Moderately concentrated, with top 5 players holding xx% market share in 2024.
- Technological Innovation: Focus on miniaturization, improved accuracy, and reduced power consumption.
- Regulatory Framework: Compliance with safety and reliability standards is crucial.
- Competitive Substitutes: MEMS resonators pose a growing challenge, but quartz resonators remain dominant due to cost advantages.
- End-User Demographics: Consumer electronics, automotive, telecommunications, and industrial automation are key segments.
- M&A Trends: Moderate activity, with xx deals valued at xx million USD between 2019 and 2024.
Quartz Resonator Growth Trends & Insights
The global quartz resonator market witnessed a CAGR of xx% during the historical period (2019-2024), reaching a market size of xx million units in 2024. This growth is attributed to increasing demand from consumer electronics, particularly smartphones and wearable devices, and the expanding automotive sector. Technological advancements, leading to higher precision and miniaturization, have further fueled market expansion. Adoption rates have steadily increased, reflecting the ubiquitous nature of quartz resonators in modern electronic devices. Consumer behavior shifts towards advanced technological devices further amplify market demand. The forecast period (2025-2033) projects a CAGR of xx%, driven by the rising adoption of 5G technology, the growth of the Internet of Things (IoT), and the continued penetration of electronics in various industries. Market penetration is expected to reach xx% by 2033.
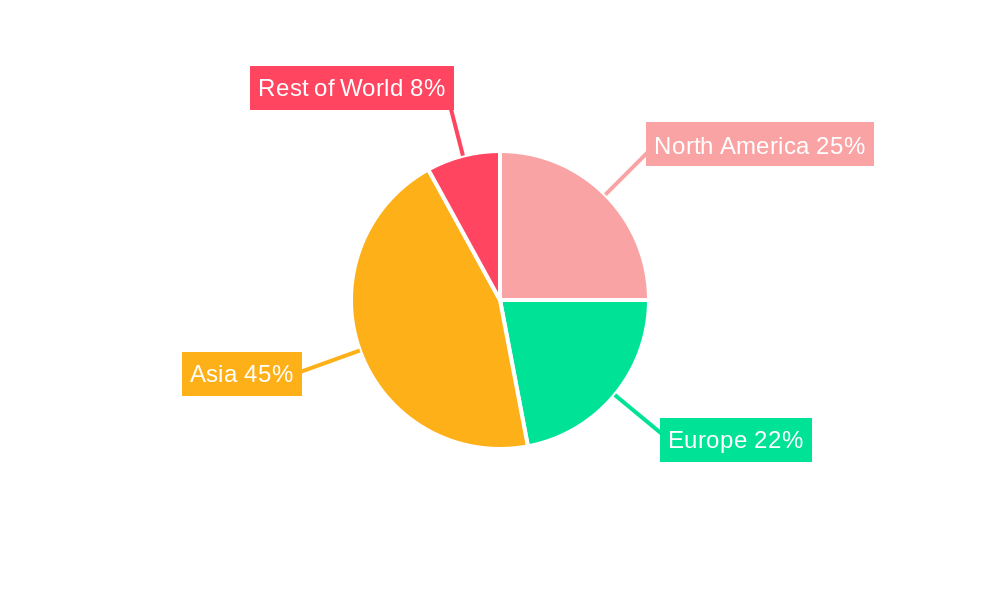
Dominant Regions, Countries, or Segments in Quartz Resonator
Asia, particularly China, Japan, and South Korea, currently dominates the global quartz resonator market, driven by a strong manufacturing base, substantial consumer electronics production, and supportive government policies promoting technological advancements in the electronics sector. These regions possess robust infrastructure and a highly skilled workforce, contributing significantly to the market's growth. North America and Europe also hold substantial market shares, driven by strong demand from automotive and industrial sectors.
- Key Drivers in Asia: Strong manufacturing base, large consumer electronics market, and supportive government policies.
- Key Drivers in North America & Europe: Robust automotive and industrial sectors, high demand for precision electronics.
- Market Share: Asia holds approximately xx% of the global market share in 2024.
- Growth Potential: Strong growth potential in emerging markets, driven by increasing electronics penetration.
Quartz Resonator Product Landscape
The quartz resonator market offers a diverse range of products, categorized by frequency, size, package type, and application-specific designs. Recent innovations focus on high-frequency resonators for 5G applications, surface mount devices (SMDs) for miniaturized electronics, and temperature-compensated resonators for enhanced stability. These advancements enhance performance metrics like frequency accuracy, stability, and power consumption. Unique selling propositions often revolve around superior precision, miniaturization capabilities, and customized solutions tailored to specific customer requirements.
Key Drivers, Barriers & Challenges in Quartz Resonator
Key Drivers:
- Increasing demand from consumer electronics and automotive sectors.
- Advancements in miniaturization and performance.
- Expansion of IoT and 5G technologies.
Key Challenges & Restraints:
- Competition from MEMS resonators.
- Supply chain disruptions and material cost fluctuations.
- Stringent regulatory compliance requirements impacting manufacturing costs.
Emerging Opportunities in Quartz Resonator
Emerging opportunities lie in the expansion into untapped markets like wearable technology and medical devices. Innovative applications, such as advanced sensor systems and high-precision timing instruments, are driving growth. Evolving consumer preferences toward smaller, more energy-efficient devices further present significant market expansion opportunities.
Growth Accelerators in the Quartz Resonator Industry
Technological breakthroughs in materials science and manufacturing processes are significantly accelerating market growth. Strategic partnerships between resonator manufacturers and end-user industries foster collaboration and accelerate product development. Expanding into new and emerging markets, particularly in developing economies, promises substantial growth potential.
Key Players Shaping the Quartz Resonator Market
- Epson
- TXC
- Robert Bosch
- Markus Lutz
- AEL Crystals
- Taitien Electronics
- New Japan Radio Company
- Magic Crystal
- Euroquartz
- Jauch Quartz
- KDS
- Jingyangxin
- TKD
Notable Milestones in Quartz Resonator Sector
- 2020-Q3: Epson launched a new series of high-precision quartz resonators for 5G applications.
- 2021-Q1: TXC acquired a smaller resonator manufacturer, expanding its market share.
- 2022-Q4: New regulations on electronic component safety were implemented in the EU.
- 2023-Q2: Several key players announced strategic partnerships to develop new resonator technologies.
In-Depth Quartz Resonator Market Outlook
The future of the quartz resonator market is promising, with continued growth driven by technological advancements, increasing demand from diverse sectors, and expansion into new applications. Strategic opportunities exist in developing innovative products, strengthening supply chains, and expanding market presence in rapidly growing regions. The market is poised for sustained growth, propelled by the pervasive use of electronics in various aspects of modern life.
Quartz Resonator Segmentation
-
1. Application
- 1.1. Consumer Device
- 1.2. Mobile Infrastructure
- 1.3. Military/Defense
- 1.4. Aerospace
- 1.5. Automotive
-
2. Types
- 2.1. Dip
- 2.2. SMD
Quartz Resonator Segmentation By Geography
-
1. North America
- 1.1. United States
- 1.2. Canada
- 1.3. Mexico
-
2. South America
- 2.1. Brazil
- 2.2. Argentina
- 2.3. Rest of South America
-
3. Europe
- 3.1. United Kingdom
- 3.2. Germany
- 3.3. France
- 3.4. Italy
- 3.5. Spain
- 3.6. Russia
- 3.7. Benelux
- 3.8. Nordics
- 3.9. Rest of Europe
-
4. Middle East & Africa
- 4.1. Turkey
- 4.2. Israel
- 4.3. GCC
- 4.4. North Africa
- 4.5. South Africa
- 4.6. Rest of Middle East & Africa
-
5. Asia Pacific
- 5.1. China
- 5.2. India
- 5.3. Japan
- 5.4. South Korea
- 5.5. ASEAN
- 5.6. Oceania
- 5.7. Rest of Asia Pacific
Quartz Resonator Regional Market Share
Geographic Coverage of Quartz Resonator
Quartz Resonator REPORT HIGHLIGHTS
| Aspects | Details |
|---|---|
| Study Period | 2020-2034 |
| Base Year | 2025 |
| Estimated Year | 2026 |
| Forecast Period | 2026-2034 |
| Historical Period | 2020-2025 |
| Growth Rate | CAGR of 4.8% from 2020-2034 |
| Segmentation |
|
Table of Contents
- 1. Introduction
- 1.1. Research Scope
- 1.2. Market Segmentation
- 1.3. Research Objective
- 1.4. Definitions and Assumptions
- 2. Executive Summary
- 2.1. Market Snapshot
- 3. Market Dynamics
- 3.1. Market Drivers
- 3.2. Market Restrains
- 3.3. Market Trends
- 3.4. Market Opportunities
- 4. Market Factor Analysis
- 4.1. Porters Five Forces
- 4.1.1. Bargaining Power of Suppliers
- 4.1.2. Bargaining Power of Buyers
- 4.1.3. Threat of New Entrants
- 4.1.4. Threat of Substitutes
- 4.1.5. Competitive Rivalry
- 4.2. PESTEL analysis
- 4.3. BCG Analysis
- 4.3.1. Stars (High Growth, High Market Share)
- 4.3.2. Cash Cows (Low Growth, High Market Share)
- 4.3.3. Question Mark (High Growth, Low Market Share)
- 4.3.4. Dogs (Low Growth, Low Market Share)
- 4.4. Ansoff Matrix Analysis
- 4.5. Supply Chain Analysis
- 4.6. Regulatory Landscape
- 4.7. Current Market Potential and Opportunity Assessment (TAM–SAM–SOM Framework)
- 4.8. NRP Analyst Note
- 4.1. Porters Five Forces
- 5. Market Analysis, Insights and Forecast 2021-2033
- 5.1. Market Analysis, Insights and Forecast - by Application
- 5.1.1. Consumer Device
- 5.1.2. Mobile Infrastructure
- 5.1.3. Military/Defense
- 5.1.4. Aerospace
- 5.1.5. Automotive
- 5.2. Market Analysis, Insights and Forecast - by Types
- 5.2.1. Dip
- 5.2.2. SMD
- 5.3. Market Analysis, Insights and Forecast - by Region
- 5.3.1. North America
- 5.3.2. South America
- 5.3.3. Europe
- 5.3.4. Middle East & Africa
- 5.3.5. Asia Pacific
- 5.1. Market Analysis, Insights and Forecast - by Application
- 6. Global Quartz Resonator Analysis, Insights and Forecast, 2021-2033
- 6.1. Market Analysis, Insights and Forecast - by Application
- 6.1.1. Consumer Device
- 6.1.2. Mobile Infrastructure
- 6.1.3. Military/Defense
- 6.1.4. Aerospace
- 6.1.5. Automotive
- 6.2. Market Analysis, Insights and Forecast - by Types
- 6.2.1. Dip
- 6.2.2. SMD
- 6.1. Market Analysis, Insights and Forecast - by Application
- 7. North America Quartz Resonator Analysis, Insights and Forecast, 2020-2032
- 7.1. Market Analysis, Insights and Forecast - by Application
- 7.1.1. Consumer Device
- 7.1.2. Mobile Infrastructure
- 7.1.3. Military/Defense
- 7.1.4. Aerospace
- 7.1.5. Automotive
- 7.2. Market Analysis, Insights and Forecast - by Types
- 7.2.1. Dip
- 7.2.2. SMD
- 7.1. Market Analysis, Insights and Forecast - by Application
- 8. South America Quartz Resonator Analysis, Insights and Forecast, 2020-2032
- 8.1. Market Analysis, Insights and Forecast - by Application
- 8.1.1. Consumer Device
- 8.1.2. Mobile Infrastructure
- 8.1.3. Military/Defense
- 8.1.4. Aerospace
- 8.1.5. Automotive
- 8.2. Market Analysis, Insights and Forecast - by Types
- 8.2.1. Dip
- 8.2.2. SMD
- 8.1. Market Analysis, Insights and Forecast - by Application
- 9. Europe Quartz Resonator Analysis, Insights and Forecast, 2020-2032
- 9.1. Market Analysis, Insights and Forecast - by Application
- 9.1.1. Consumer Device
- 9.1.2. Mobile Infrastructure
- 9.1.3. Military/Defense
- 9.1.4. Aerospace
- 9.1.5. Automotive
- 9.2. Market Analysis, Insights and Forecast - by Types
- 9.2.1. Dip
- 9.2.2. SMD
- 9.1. Market Analysis, Insights and Forecast - by Application
- 10. Middle East & Africa Quartz Resonator Analysis, Insights and Forecast, 2020-2032
- 10.1. Market Analysis, Insights and Forecast - by Application
- 10.1.1. Consumer Device
- 10.1.2. Mobile Infrastructure
- 10.1.3. Military/Defense
- 10.1.4. Aerospace
- 10.1.5. Automotive
- 10.2. Market Analysis, Insights and Forecast - by Types
- 10.2.1. Dip
- 10.2.2. SMD
- 10.1. Market Analysis, Insights and Forecast - by Application
- 11. Asia Pacific Quartz Resonator Analysis, Insights and Forecast, 2020-2032
- 11.1. Market Analysis, Insights and Forecast - by Application
- 11.1.1. Consumer Device
- 11.1.2. Mobile Infrastructure
- 11.1.3. Military/Defense
- 11.1.4. Aerospace
- 11.1.5. Automotive
- 11.2. Market Analysis, Insights and Forecast - by Types
- 11.2.1. Dip
- 11.2.2. SMD
- 11.1. Market Analysis, Insights and Forecast - by Application
- 12. Competitive Analysis
- 12.1. Company Profiles
- 12.1.1 Epson
- 12.1.1.1. Company Overview
- 12.1.1.2. Products
- 12.1.1.3. Company Financials
- 12.1.1.4. SWOT Analysis
- 12.1.2 TXC
- 12.1.2.1. Company Overview
- 12.1.2.2. Products
- 12.1.2.3. Company Financials
- 12.1.2.4. SWOT Analysis
- 12.1.3 Robert Bosch
- 12.1.3.1. Company Overview
- 12.1.3.2. Products
- 12.1.3.3. Company Financials
- 12.1.3.4. SWOT Analysis
- 12.1.4 Markus Lutz
- 12.1.4.1. Company Overview
- 12.1.4.2. Products
- 12.1.4.3. Company Financials
- 12.1.4.4. SWOT Analysis
- 12.1.5 AEL Crystals
- 12.1.5.1. Company Overview
- 12.1.5.2. Products
- 12.1.5.3. Company Financials
- 12.1.5.4. SWOT Analysis
- 12.1.6 Taitien Electronics
- 12.1.6.1. Company Overview
- 12.1.6.2. Products
- 12.1.6.3. Company Financials
- 12.1.6.4. SWOT Analysis
- 12.1.7 New Japan Radio Company
- 12.1.7.1. Company Overview
- 12.1.7.2. Products
- 12.1.7.3. Company Financials
- 12.1.7.4. SWOT Analysis
- 12.1.8 Magic Crystal
- 12.1.8.1. Company Overview
- 12.1.8.2. Products
- 12.1.8.3. Company Financials
- 12.1.8.4. SWOT Analysis
- 12.1.9 Euroquartz
- 12.1.9.1. Company Overview
- 12.1.9.2. Products
- 12.1.9.3. Company Financials
- 12.1.9.4. SWOT Analysis
- 12.1.10 Jauch Quartz
- 12.1.10.1. Company Overview
- 12.1.10.2. Products
- 12.1.10.3. Company Financials
- 12.1.10.4. SWOT Analysis
- 12.1.11 KDS
- 12.1.11.1. Company Overview
- 12.1.11.2. Products
- 12.1.11.3. Company Financials
- 12.1.11.4. SWOT Analysis
- 12.1.12 Jingyangxin
- 12.1.12.1. Company Overview
- 12.1.12.2. Products
- 12.1.12.3. Company Financials
- 12.1.12.4. SWOT Analysis
- 12.1.13 TKD
- 12.1.13.1. Company Overview
- 12.1.13.2. Products
- 12.1.13.3. Company Financials
- 12.1.13.4. SWOT Analysis
- 12.1.1 Epson
- 12.2. Market Entropy
- 12.2.1 Company's Key Areas Served
- 12.2.2 Recent Developments
- 12.3. Company Market Share Analysis 2025
- 12.3.1 Top 5 Companies Market Share Analysis
- 12.3.2 Top 3 Companies Market Share Analysis
- 12.4. List of Potential Customers
- 13. Research Methodology
List of Figures
- Figure 1: Global Quartz Resonator Revenue Breakdown (billion, %) by Region 2025 & 2033
- Figure 2: Global Quartz Resonator Volume Breakdown (K, %) by Region 2025 & 2033
- Figure 3: North America Quartz Resonator Revenue (billion), by Application 2025 & 2033
- Figure 4: North America Quartz Resonator Volume (K), by Application 2025 & 2033
- Figure 5: North America Quartz Resonator Revenue Share (%), by Application 2025 & 2033
- Figure 6: North America Quartz Resonator Volume Share (%), by Application 2025 & 2033
- Figure 7: North America Quartz Resonator Revenue (billion), by Types 2025 & 2033
- Figure 8: North America Quartz Resonator Volume (K), by Types 2025 & 2033
- Figure 9: North America Quartz Resonator Revenue Share (%), by Types 2025 & 2033
- Figure 10: North America Quartz Resonator Volume Share (%), by Types 2025 & 2033
- Figure 11: North America Quartz Resonator Revenue (billion), by Country 2025 & 2033
- Figure 12: North America Quartz Resonator Volume (K), by Country 2025 & 2033
- Figure 13: North America Quartz Resonator Revenue Share (%), by Country 2025 & 2033
- Figure 14: North America Quartz Resonator Volume Share (%), by Country 2025 & 2033
- Figure 15: South America Quartz Resonator Revenue (billion), by Application 2025 & 2033
- Figure 16: South America Quartz Resonator Volume (K), by Application 2025 & 2033
- Figure 17: South America Quartz Resonator Revenue Share (%), by Application 2025 & 2033
- Figure 18: South America Quartz Resonator Volume Share (%), by Application 2025 & 2033
- Figure 19: South America Quartz Resonator Revenue (billion), by Types 2025 & 2033
- Figure 20: South America Quartz Resonator Volume (K), by Types 2025 & 2033
- Figure 21: South America Quartz Resonator Revenue Share (%), by Types 2025 & 2033
- Figure 22: South America Quartz Resonator Volume Share (%), by Types 2025 & 2033
- Figure 23: South America Quartz Resonator Revenue (billion), by Country 2025 & 2033
- Figure 24: South America Quartz Resonator Volume (K), by Country 2025 & 2033
- Figure 25: South America Quartz Resonator Revenue Share (%), by Country 2025 & 2033
- Figure 26: South America Quartz Resonator Volume Share (%), by Country 2025 & 2033
- Figure 27: Europe Quartz Resonator Revenue (billion), by Application 2025 & 2033
- Figure 28: Europe Quartz Resonator Volume (K), by Application 2025 & 2033
- Figure 29: Europe Quartz Resonator Revenue Share (%), by Application 2025 & 2033
- Figure 30: Europe Quartz Resonator Volume Share (%), by Application 2025 & 2033
- Figure 31: Europe Quartz Resonator Revenue (billion), by Types 2025 & 2033
- Figure 32: Europe Quartz Resonator Volume (K), by Types 2025 & 2033
- Figure 33: Europe Quartz Resonator Revenue Share (%), by Types 2025 & 2033
- Figure 34: Europe Quartz Resonator Volume Share (%), by Types 2025 & 2033
- Figure 35: Europe Quartz Resonator Revenue (billion), by Country 2025 & 2033
- Figure 36: Europe Quartz Resonator Volume (K), by Country 2025 & 2033
- Figure 37: Europe Quartz Resonator Revenue Share (%), by Country 2025 & 2033
- Figure 38: Europe Quartz Resonator Volume Share (%), by Country 2025 & 2033
- Figure 39: Middle East & Africa Quartz Resonator Revenue (billion), by Application 2025 & 2033
- Figure 40: Middle East & Africa Quartz Resonator Volume (K), by Application 2025 & 2033
- Figure 41: Middle East & Africa Quartz Resonator Revenue Share (%), by Application 2025 & 2033
- Figure 42: Middle East & Africa Quartz Resonator Volume Share (%), by Application 2025 & 2033
- Figure 43: Middle East & Africa Quartz Resonator Revenue (billion), by Types 2025 & 2033
- Figure 44: Middle East & Africa Quartz Resonator Volume (K), by Types 2025 & 2033
- Figure 45: Middle East & Africa Quartz Resonator Revenue Share (%), by Types 2025 & 2033
- Figure 46: Middle East & Africa Quartz Resonator Volume Share (%), by Types 2025 & 2033
- Figure 47: Middle East & Africa Quartz Resonator Revenue (billion), by Country 2025 & 2033
- Figure 48: Middle East & Africa Quartz Resonator Volume (K), by Country 2025 & 2033
- Figure 49: Middle East & Africa Quartz Resonator Revenue Share (%), by Country 2025 & 2033
- Figure 50: Middle East & Africa Quartz Resonator Volume Share (%), by Country 2025 & 2033
- Figure 51: Asia Pacific Quartz Resonator Revenue (billion), by Application 2025 & 2033
- Figure 52: Asia Pacific Quartz Resonator Volume (K), by Application 2025 & 2033
- Figure 53: Asia Pacific Quartz Resonator Revenue Share (%), by Application 2025 & 2033
- Figure 54: Asia Pacific Quartz Resonator Volume Share (%), by Application 2025 & 2033
- Figure 55: Asia Pacific Quartz Resonator Revenue (billion), by Types 2025 & 2033
- Figure 56: Asia Pacific Quartz Resonator Volume (K), by Types 2025 & 2033
- Figure 57: Asia Pacific Quartz Resonator Revenue Share (%), by Types 2025 & 2033
- Figure 58: Asia Pacific Quartz Resonator Volume Share (%), by Types 2025 & 2033
- Figure 59: Asia Pacific Quartz Resonator Revenue (billion), by Country 2025 & 2033
- Figure 60: Asia Pacific Quartz Resonator Volume (K), by Country 2025 & 2033
- Figure 61: Asia Pacific Quartz Resonator Revenue Share (%), by Country 2025 & 2033
- Figure 62: Asia Pacific Quartz Resonator Volume Share (%), by Country 2025 & 2033
List of Tables
- Table 1: Global Quartz Resonator Revenue billion Forecast, by Application 2020 & 2033
- Table 2: Global Quartz Resonator Volume K Forecast, by Application 2020 & 2033
- Table 3: Global Quartz Resonator Revenue billion Forecast, by Types 2020 & 2033
- Table 4: Global Quartz Resonator Volume K Forecast, by Types 2020 & 2033
- Table 5: Global Quartz Resonator Revenue billion Forecast, by Region 2020 & 2033
- Table 6: Global Quartz Resonator Volume K Forecast, by Region 2020 & 2033
- Table 7: Global Quartz Resonator Revenue billion Forecast, by Application 2020 & 2033
- Table 8: Global Quartz Resonator Volume K Forecast, by Application 2020 & 2033
- Table 9: Global Quartz Resonator Revenue billion Forecast, by Types 2020 & 2033
- Table 10: Global Quartz Resonator Volume K Forecast, by Types 2020 & 2033
- Table 11: Global Quartz Resonator Revenue billion Forecast, by Country 2020 & 2033
- Table 12: Global Quartz Resonator Volume K Forecast, by Country 2020 & 2033
- Table 13: United States Quartz Resonator Revenue (billion) Forecast, by Application 2020 & 2033
- Table 14: United States Quartz Resonator Volume (K) Forecast, by Application 2020 & 2033
- Table 15: Canada Quartz Resonator Revenue (billion) Forecast, by Application 2020 & 2033
- Table 16: Canada Quartz Resonator Volume (K) Forecast, by Application 2020 & 2033
- Table 17: Mexico Quartz Resonator Revenue (billion) Forecast, by Application 2020 & 2033
- Table 18: Mexico Quartz Resonator Volume (K) Forecast, by Application 2020 & 2033
- Table 19: Global Quartz Resonator Revenue billion Forecast, by Application 2020 & 2033
- Table 20: Global Quartz Resonator Volume K Forecast, by Application 2020 & 2033
- Table 21: Global Quartz Resonator Revenue billion Forecast, by Types 2020 & 2033
- Table 22: Global Quartz Resonator Volume K Forecast, by Types 2020 & 2033
- Table 23: Global Quartz Resonator Revenue billion Forecast, by Country 2020 & 2033
- Table 24: Global Quartz Resonator Volume K Forecast, by Country 2020 & 2033
- Table 25: Brazil Quartz Resonator Revenue (billion) Forecast, by Application 2020 & 2033
- Table 26: Brazil Quartz Resonator Volume (K) Forecast, by Application 2020 & 2033
- Table 27: Argentina Quartz Resonator Revenue (billion) Forecast, by Application 2020 & 2033
- Table 28: Argentina Quartz Resonator Volume (K) Forecast, by Application 2020 & 2033
- Table 29: Rest of South America Quartz Resonator Revenue (billion) Forecast, by Application 2020 & 2033
- Table 30: Rest of South America Quartz Resonator Volume (K) Forecast, by Application 2020 & 2033
- Table 31: Global Quartz Resonator Revenue billion Forecast, by Application 2020 & 2033
- Table 32: Global Quartz Resonator Volume K Forecast, by Application 2020 & 2033
- Table 33: Global Quartz Resonator Revenue billion Forecast, by Types 2020 & 2033
- Table 34: Global Quartz Resonator Volume K Forecast, by Types 2020 & 2033
- Table 35: Global Quartz Resonator Revenue billion Forecast, by Country 2020 & 2033
- Table 36: Global Quartz Resonator Volume K Forecast, by Country 2020 & 2033
- Table 37: United Kingdom Quartz Resonator Revenue (billion) Forecast, by Application 2020 & 2033
- Table 38: United Kingdom Quartz Resonator Volume (K) Forecast, by Application 2020 & 2033
- Table 39: Germany Quartz Resonator Revenue (billion) Forecast, by Application 2020 & 2033
- Table 40: Germany Quartz Resonator Volume (K) Forecast, by Application 2020 & 2033
- Table 41: France Quartz Resonator Revenue (billion) Forecast, by Application 2020 & 2033
- Table 42: France Quartz Resonator Volume (K) Forecast, by Application 2020 & 2033
- Table 43: Italy Quartz Resonator Revenue (billion) Forecast, by Application 2020 & 2033
- Table 44: Italy Quartz Resonator Volume (K) Forecast, by Application 2020 & 2033
- Table 45: Spain Quartz Resonator Revenue (billion) Forecast, by Application 2020 & 2033
- Table 46: Spain Quartz Resonator Volume (K) Forecast, by Application 2020 & 2033
- Table 47: Russia Quartz Resonator Revenue (billion) Forecast, by Application 2020 & 2033
- Table 48: Russia Quartz Resonator Volume (K) Forecast, by Application 2020 & 2033
- Table 49: Benelux Quartz Resonator Revenue (billion) Forecast, by Application 2020 & 2033
- Table 50: Benelux Quartz Resonator Volume (K) Forecast, by Application 2020 & 2033
- Table 51: Nordics Quartz Resonator Revenue (billion) Forecast, by Application 2020 & 2033
- Table 52: Nordics Quartz Resonator Volume (K) Forecast, by Application 2020 & 2033
- Table 53: Rest of Europe Quartz Resonator Revenue (billion) Forecast, by Application 2020 & 2033
- Table 54: Rest of Europe Quartz Resonator Volume (K) Forecast, by Application 2020 & 2033
- Table 55: Global Quartz Resonator Revenue billion Forecast, by Application 2020 & 2033
- Table 56: Global Quartz Resonator Volume K Forecast, by Application 2020 & 2033
- Table 57: Global Quartz Resonator Revenue billion Forecast, by Types 2020 & 2033
- Table 58: Global Quartz Resonator Volume K Forecast, by Types 2020 & 2033
- Table 59: Global Quartz Resonator Revenue billion Forecast, by Country 2020 & 2033
- Table 60: Global Quartz Resonator Volume K Forecast, by Country 2020 & 2033
- Table 61: Turkey Quartz Resonator Revenue (billion) Forecast, by Application 2020 & 2033
- Table 62: Turkey Quartz Resonator Volume (K) Forecast, by Application 2020 & 2033
- Table 63: Israel Quartz Resonator Revenue (billion) Forecast, by Application 2020 & 2033
- Table 64: Israel Quartz Resonator Volume (K) Forecast, by Application 2020 & 2033
- Table 65: GCC Quartz Resonator Revenue (billion) Forecast, by Application 2020 & 2033
- Table 66: GCC Quartz Resonator Volume (K) Forecast, by Application 2020 & 2033
- Table 67: North Africa Quartz Resonator Revenue (billion) Forecast, by Application 2020 & 2033
- Table 68: North Africa Quartz Resonator Volume (K) Forecast, by Application 2020 & 2033
- Table 69: South Africa Quartz Resonator Revenue (billion) Forecast, by Application 2020 & 2033
- Table 70: South Africa Quartz Resonator Volume (K) Forecast, by Application 2020 & 2033
- Table 71: Rest of Middle East & Africa Quartz Resonator Revenue (billion) Forecast, by Application 2020 & 2033
- Table 72: Rest of Middle East & Africa Quartz Resonator Volume (K) Forecast, by Application 2020 & 2033
- Table 73: Global Quartz Resonator Revenue billion Forecast, by Application 2020 & 2033
- Table 74: Global Quartz Resonator Volume K Forecast, by Application 2020 & 2033
- Table 75: Global Quartz Resonator Revenue billion Forecast, by Types 2020 & 2033
- Table 76: Global Quartz Resonator Volume K Forecast, by Types 2020 & 2033
- Table 77: Global Quartz Resonator Revenue billion Forecast, by Country 2020 & 2033
- Table 78: Global Quartz Resonator Volume K Forecast, by Country 2020 & 2033
- Table 79: China Quartz Resonator Revenue (billion) Forecast, by Application 2020 & 2033
- Table 80: China Quartz Resonator Volume (K) Forecast, by Application 2020 & 2033
- Table 81: India Quartz Resonator Revenue (billion) Forecast, by Application 2020 & 2033
- Table 82: India Quartz Resonator Volume (K) Forecast, by Application 2020 & 2033
- Table 83: Japan Quartz Resonator Revenue (billion) Forecast, by Application 2020 & 2033
- Table 84: Japan Quartz Resonator Volume (K) Forecast, by Application 2020 & 2033
- Table 85: South Korea Quartz Resonator Revenue (billion) Forecast, by Application 2020 & 2033
- Table 86: South Korea Quartz Resonator Volume (K) Forecast, by Application 2020 & 2033
- Table 87: ASEAN Quartz Resonator Revenue (billion) Forecast, by Application 2020 & 2033
- Table 88: ASEAN Quartz Resonator Volume (K) Forecast, by Application 2020 & 2033
- Table 89: Oceania Quartz Resonator Revenue (billion) Forecast, by Application 2020 & 2033
- Table 90: Oceania Quartz Resonator Volume (K) Forecast, by Application 2020 & 2033
- Table 91: Rest of Asia Pacific Quartz Resonator Revenue (billion) Forecast, by Application 2020 & 2033
- Table 92: Rest of Asia Pacific Quartz Resonator Volume (K) Forecast, by Application 2020 & 2033
Frequently Asked Questions
1. What is the projected Compound Annual Growth Rate (CAGR) of the Quartz Resonator?
The projected CAGR is approximately 4.8%.
2. Which companies are prominent players in the Quartz Resonator?
Key companies in the market include Epson, TXC, Robert Bosch, Markus Lutz, AEL Crystals, Taitien Electronics, New Japan Radio Company, Magic Crystal, Euroquartz, Jauch Quartz, KDS, Jingyangxin, TKD.
3. What are the main segments of the Quartz Resonator?
The market segments include Application, Types.
4. Can you provide details about the market size?
The market size is estimated to be USD 2.89 billion as of 2022.
5. What are some drivers contributing to market growth?
N/A
6. What are the notable trends driving market growth?
N/A
7. Are there any restraints impacting market growth?
N/A
8. Can you provide examples of recent developments in the market?
N/A
9. What pricing options are available for accessing the report?
Pricing options include single-user, multi-user, and enterprise licenses priced at USD 3950.00, USD 5925.00, and USD 7900.00 respectively.
10. Is the market size provided in terms of value or volume?
The market size is provided in terms of value, measured in billion and volume, measured in K.
11. Are there any specific market keywords associated with the report?
Yes, the market keyword associated with the report is "Quartz Resonator," which aids in identifying and referencing the specific market segment covered.
12. How do I determine which pricing option suits my needs best?
The pricing options vary based on user requirements and access needs. Individual users may opt for single-user licenses, while businesses requiring broader access may choose multi-user or enterprise licenses for cost-effective access to the report.
13. Are there any additional resources or data provided in the Quartz Resonator report?
While the report offers comprehensive insights, it's advisable to review the specific contents or supplementary materials provided to ascertain if additional resources or data are available.
14. How can I stay updated on further developments or reports in the Quartz Resonator?
To stay informed about further developments, trends, and reports in the Quartz Resonator, consider subscribing to industry newsletters, following relevant companies and organizations, or regularly checking reputable industry news sources and publications.
Methodology
Step 1 - Identification of Relevant Samples Size from Population Database


Step 2 - Approaches for Defining Global Market Size (Value, Volume* & Price*)

Note*: In applicable scenarios
Step 3 - Data Sources
Primary Research
- Web Analytics
- Survey Reports
- Research Institute
- Latest Research Reports
- Opinion Leaders
Secondary Research
- Annual Reports
- White Paper
- Latest Press Release
- Industry Association
- Paid Database
- Investor Presentations

Step 4 - Data Triangulation
Involves using different sources of information in order to increase the validity of a study
These sources are likely to be stakeholders in a program - participants, other researchers, program staff, other community members, and so on.
Then we put all data in single framework & apply various statistical tools to find out the dynamic on the market.
During the analysis stage, feedback from the stakeholder groups would be compared to determine areas of agreement as well as areas of divergence