

Key Insights
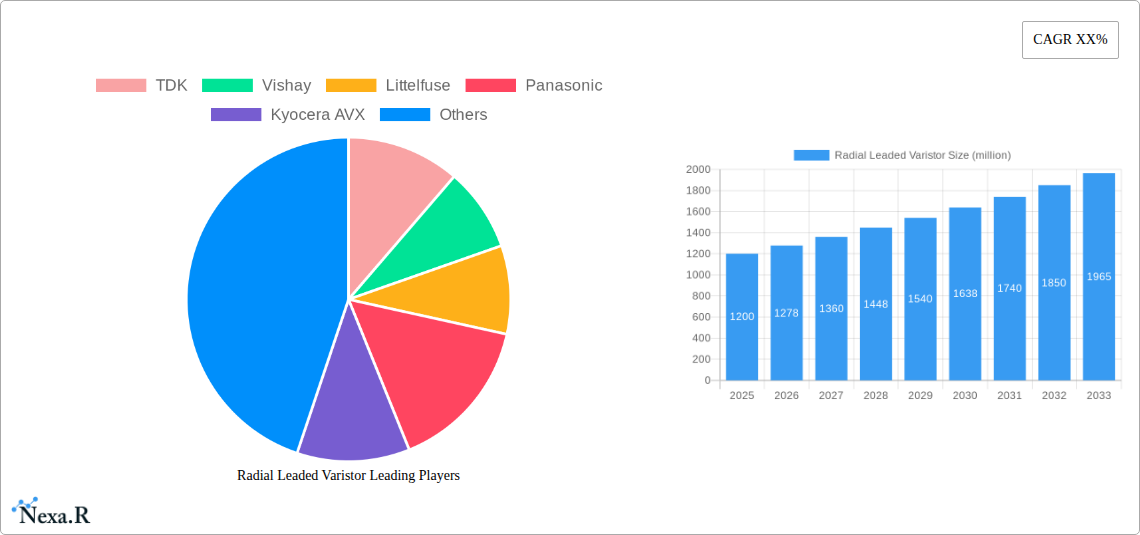
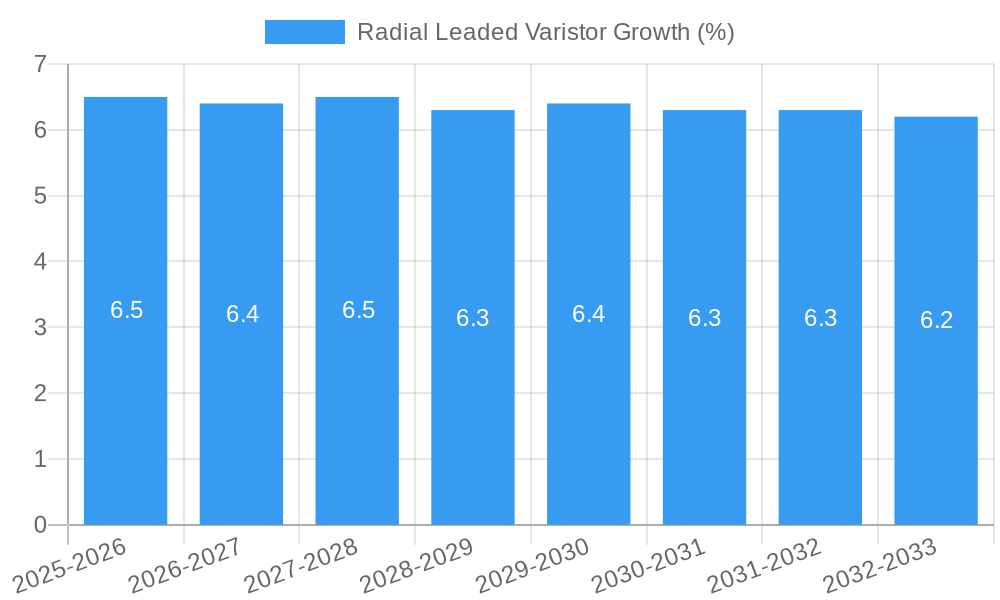
The global Radial Leaded Varistor market is projected to experience robust expansion, with an estimated market size of approximately $1.2 billion in 2025. This growth is underpinned by a compelling Compound Annual Growth Rate (CAGR) of around 6.5% expected throughout the forecast period of 2025-2033. This sustained upward trajectory is primarily fueled by the escalating demand across key application sectors. The automotive industry, with its increasing integration of advanced electronic systems and stringent safety regulations, stands out as a significant driver. Similarly, the aerospace sector's continuous pursuit of enhanced reliability and protection against electrical transients, coupled with the burgeoning communication infrastructure driven by 5G deployment and IoT proliferation, are pivotal contributors to market expansion. Consumer electronics, while a mature market, also continues to contribute steadily due to the ubiquitous presence of varistors for surge protection in a wide array of devices.
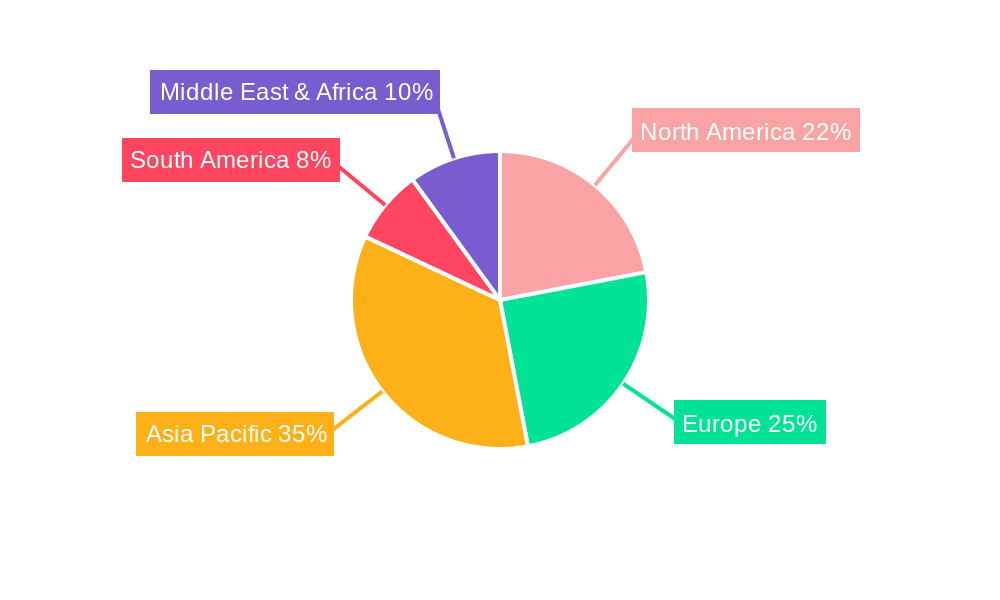
The market is characterized by distinct segments, with High Voltage varistors anticipated to exhibit stronger growth owing to their critical role in high-power applications within industrial and energy infrastructure. However, Medium and Low Voltage varistors will continue to command a substantial market share due to their widespread use in consumer electronics and automotive sub-systems. Key market restraints include the increasing competition from alternative surge protection technologies and potential fluctuations in raw material costs, which could impact manufacturing expenses. Geographically, the Asia Pacific region, led by China and India, is expected to dominate the market owing to its expansive manufacturing base, rapid industrialization, and significant investments in electronics and communication infrastructure. North America and Europe will remain significant markets, driven by technological advancements and strong regulatory frameworks emphasizing electronic component reliability and safety.
This comprehensive report provides an in-depth analysis of the global Radial Leaded Varistor market, meticulously detailing its dynamics, growth trajectories, and future outlook. Covering the historical period from 2019 to 2024, with a base year of 2025 and a robust forecast period extending to 2033, this study is an indispensable resource for stakeholders seeking to understand and capitalize on market opportunities. We analyze key segments, applications, and technological advancements, offering strategic insights into market penetration and competitive landscapes. The report integrates high-traffic keywords related to surge protection devices, transient voltage suppressors, overvoltage protection, and electronic components, ensuring maximum visibility for industry professionals.
Radial Leaded Varistor Market Dynamics & Structure
The global Radial Leaded Varistor market exhibits a moderately concentrated structure, with leading players like TDK, Vishay, Littelfuse, Panasonic, and Kyocera AVX holding significant market share. Technological innovation remains a primary driver, fueled by increasing demands for enhanced safety and reliability in electronic systems, particularly within the automotive and communication infrastructure segments. Stricter regulatory frameworks surrounding electrical safety and electromagnetic compatibility (EMC) are also bolstering market growth. Competitive product substitutes, though present, often fall short of the performance and cost-effectiveness offered by advanced radial leaded varistors. End-user demographics are expanding beyond traditional industrial applications to include a growing demand from consumer electronics and the burgeoning aerospace sector. Mergers and acquisitions (M&A) trends, while not dominating the market, have been observed as strategic moves by larger entities to consolidate market presence and expand product portfolios. The market's growth is intrinsically linked to the expansion of critical infrastructure and the increasing sophistication of electronic devices across all application sectors.
- Market Concentration: Moderately concentrated with a few key global manufacturers.
- Technological Innovation Drivers: Miniaturization, higher energy absorption capabilities, improved response times, and compliance with evolving safety standards.
- Regulatory Frameworks: Increasing adoption of IEC, UL, and other international safety standards driving demand for certified protection components.
- Competitive Product Substitutes: While alternatives exist (e.g., ceramic capacitors, transient suppression diodes), varistors offer a unique combination of high energy absorption and cost-effectiveness for specific surge protection needs.
- End-User Demographics: Diversifying from industrial to consumer electronics, automotive, medical devices, and renewable energy systems.
- M&A Trends: Strategic acquisitions focused on expanding product offerings and geographical reach.
Radial Leaded Varistor Growth Trends & Insights
The global Radial Leaded Varistor market is poised for substantial expansion, projected to grow at a Compound Annual Growth Rate (CAGR) of approximately 5.8% from 2025 to 2033. This robust growth trajectory is primarily attributed to the escalating integration of electronic components across a multitude of industries, each requiring dependable protection against voltage transients and surges. The automotive sector, in particular, is a significant growth engine, driven by the proliferation of Advanced Driver-Assistance Systems (ADAS), electric vehicle (EV) powertrains, and in-car infotainment systems, all of which necessitate sophisticated overvoltage protection to ensure operational integrity and passenger safety. Similarly, the expansion of communication infrastructure, including 5G deployments and data centers, demands highly reliable surge protection to safeguard sensitive network equipment from lightning strikes and power surges. Consumer electronics, characterized by their increasing complexity and interconnectedness, also represent a substantial market, with consumers and manufacturers alike prioritizing device longevity and data integrity.
Technological disruptions are continually reshaping the market. Innovations in material science have led to the development of varistors with higher energy absorption capacities, faster response times, and extended operational lifespans. These advancements are crucial for meeting the ever-increasing performance expectations in demanding applications. The shift towards miniaturization in electronic design also presents an opportunity for compact radial leaded varistors, allowing for space-constrained applications without compromising protection capabilities. Consumer behavior is increasingly influenced by the perceived reliability and durability of electronic products; thus, manufacturers are investing in superior surge protection solutions to enhance brand reputation and reduce warranty claims. This growing emphasis on product reliability directly translates into a stronger demand for high-performance radial leaded varistors. The aerospace industry, with its stringent safety and performance requirements, is also a notable contributor to market growth, as these critical systems demand the utmost protection against electrical disturbances. The "Others" segment, encompassing renewable energy systems (solar inverters, wind turbines) and industrial automation, further amplifies the market's growth potential, with each domain experiencing rapid technological adoption and a corresponding need for robust surge protection. The market penetration of radial leaded varistors is expected to deepen as awareness of their critical role in preventing component damage and ensuring system uptime continues to rise. The estimated market size for radial leaded varistors in the base year of 2025 stands at approximately $1.2 billion units, with projections indicating a significant increase by the end of the forecast period.
Dominant Regions, Countries, or Segments in Radial Leaded Varistor
The global Radial Leaded Varistor market is characterized by regional dominance, with Asia Pacific emerging as the largest and fastest-growing market. This supremacy is fueled by a confluence of factors including the region's robust manufacturing base for electronics, significant investments in communication infrastructure, and a burgeoning automotive sector. Countries like China, South Korea, and Japan are at the forefront, driven by the high volume production of consumer electronics, the rapid expansion of 5G networks, and a strong presence of automotive manufacturers investing in electric and hybrid vehicles. The demand for Medium and Low Voltage varistors within this region is particularly pronounced due to their widespread application in consumer electronics and automotive electronics, accounting for an estimated 70% of the total regional demand for varistors.
North America and Europe also represent significant markets, driven by advanced technological adoption and stringent safety regulations. In North America, the communication infrastructure segment, including the rollout of advanced networking technologies and the expansion of data centers, is a key growth driver. The automotive industry’s focus on electrification and autonomous driving further boosts demand for reliable surge protection. European markets, with their strong emphasis on industrial automation, renewable energy projects, and a mature automotive industry, also contribute substantially to the global demand. The High Voltage segment, though smaller in volume, is gaining traction in these regions due to critical infrastructure upgrades and the increasing complexity of power distribution systems.
Analyzing by application, Consumer Electronics remains a dominant segment globally, owing to the sheer volume of devices manufactured and consumed. However, the Automotive application segment is experiencing the most rapid growth, driven by the electrification trend and the increasing complexity of vehicle electronics. The need for comprehensive surge protection in EVs, with their high-voltage battery systems and sensitive control modules, is paramount. Communication Infrastructure is another pivotal segment, with ongoing investments in 5G deployment, fiber optic networks, and data center expansion worldwide necessitating resilient protection against transient overvoltages. The Aerospace segment, while smaller in volume, is characterized by high-value components and stringent reliability requirements, making it a consistent demand generator. The "Others" category, including industrial automation, medical equipment, and renewable energy systems (solar and wind power), also contributes to the diversified demand for radial leaded varistors.
- Dominant Region: Asia Pacific, driven by manufacturing, communication infrastructure, and automotive growth.
- Leading Countries: China, South Korea, Japan, USA, Germany.
- Dominant Segment by Type: Medium and Low Voltage varistors due to broad application in consumer and automotive electronics.
- Fastest Growing Segment by Application: Automotive, driven by EV and ADAS adoption.
- Key Drivers:
- Economic Policies: Government incentives for electronics manufacturing and infrastructure development in Asia Pacific.
- Infrastructure Development: Global rollout of 5G networks and expansion of data centers.
- Technological Advancements: Increased electronics integration in vehicles and consumer devices.
- Regulatory Compliance: Stringent safety standards demanding reliable surge protection.
- Market Share (Estimated): Asia Pacific (approx. 45%), North America (approx. 25%), Europe (approx. 20%), Rest of World (approx. 10%).
- Growth Potential: Automotive and Communication Infrastructure segments exhibit the highest growth potential due to technological evolution and infrastructure investment.
Radial Leaded Varistor Product Landscape
The product landscape for radial leaded varistors is continuously evolving, marked by advancements in material science and manufacturing processes. Innovations focus on enhancing energy handling capabilities, reducing capacitance, improving response times, and achieving higher operating temperatures for demanding environments. Key product developments include multi-layer varistors offering superior protection in compact footprints and ceramic varistors with specialized formulations for specific voltage and current ratings. Applications span a wide spectrum, from protecting sensitive integrated circuits in consumer electronics to safeguarding power supplies in communication base stations and ensuring the reliability of automotive electronic control units (ECUs). Unique selling propositions often revolve around product reliability, compliance with international standards (e.g., UL, IEC), and tailored solutions for specific application needs. Technological advancements are enabling the development of leaded varistors with precise clamping voltages and rapid response times, crucial for preventing damage from even the most fleeting voltage spikes.
Key Drivers, Barriers & Challenges in Radial Leaded Varistor
Key Drivers:
- Increasing Electronic Integration: The pervasive use of electronics in all sectors, from automotive to consumer goods, necessitates robust surge protection.
- Electrification of Transportation: The rapid growth of electric vehicles (EVs) and hybrid electric vehicles (HEVs) demands advanced overvoltage protection for their complex power systems.
- 5G Network Deployment: The expansion of 5G infrastructure requires reliable surge protection for base stations and network equipment to ensure uninterrupted service.
- Stringent Safety Regulations: Evolving and tightening safety standards globally mandate the use of certified surge protection devices, driving demand.
- Demand for Reliability and Longevity: Consumers and industries alike are increasingly prioritizing the durability and lifespan of electronic devices, making surge protection essential.
Key Barriers & Challenges:
- Supply Chain Disruptions: Geopolitical factors, raw material availability, and manufacturing bottlenecks can lead to price volatility and lead time extensions.
- Price Sensitivity: In some high-volume consumer applications, price remains a significant factor, creating a challenge for premium-priced, high-performance varistors.
- Competition from Alternatives: While varistors offer unique advantages, other surge suppression technologies can be competitive in specific niche applications.
- Technological Obsolescence: Rapid advancements in electronic components can sometimes lead to the obsolescence of older protection technologies if not continuously updated.
- Environmental Regulations: Increasing focus on sustainability and hazardous materials can pose challenges for manufacturing processes and material sourcing.
Emerging Opportunities in Radial Leaded Varistor
Emerging opportunities in the radial leaded varistor market are primarily centered around the growing demand for advanced protection in next-generation technologies. The expansion of the Internet of Things (IoT) ecosystem, encompassing smart home devices, industrial sensors, and connected vehicles, presents a vast untapped market for miniaturized and highly reliable varistors. The increasing adoption of renewable energy sources, such as solar power systems and wind turbines, also creates a significant opportunity, as these installations are exposed to variable grid conditions and potential lightning strikes. Furthermore, the development of smart grids and advanced energy storage solutions will require robust surge protection to ensure system stability and efficiency. The medical device industry, with its critical patient monitoring and diagnostic equipment, is another area ripe for growth as it increasingly relies on electronic components that require stringent overvoltage protection. The demand for varistors with enhanced thermal management capabilities and fail-safe features will also continue to grow, driven by these evolving application requirements.
Growth Accelerators in the Radial Leaded Varistor Industry
The radial leaded varistor industry's long-term growth is being significantly accelerated by several key catalysts. Technological breakthroughs in material science are enabling the development of varistors with superior energy absorption capabilities and faster response times, directly addressing the needs of increasingly complex electronic systems. Strategic partnerships between varistor manufacturers and electronic component distributors or system integrators are crucial for expanding market reach and ensuring the timely availability of these critical components. Furthermore, market expansion strategies focused on emerging economies and developing regions, where industrialization and technological adoption are rapidly increasing, are proving to be effective growth accelerators. The growing emphasis on product reliability and safety across all sectors, driven by both regulatory pressures and consumer expectations, acts as a sustained accelerator, creating a consistent demand for high-quality surge protection solutions. The continued innovation in automotive electronics, especially in the EV segment, is a major growth engine.
Key Players Shaping the Radial Leaded Varistor Market
- TDK Corporation
- Vishay Intertechnology, Inc.
- Littelfuse, Inc.
- Panasonic Corporation
- Kyocera AVX Components Corporation
- Bourns, Inc.
- Eaton Corporation
- Nippon Chemi-Con Corporation
- Thinking Electronic Industrial Co., Ltd.
- JOYIN Technology Co., Ltd.
- Fenghua (HK) Electronics Co., Ltd.
- Songtian Electronics Co., Ltd.
- Nanjing Shiheng Electronics Co., Ltd.
- Xiamen SET Electronics Co., Ltd.
- Sinochip Electronics Co., Ltd.
- SOCAY Electronic Co., Ltd.
- Semiware Semiconductor Inc.
Notable Milestones in Radial Leaded Varistor Sector
- 2019: Increased focus on developing varistors compliant with stricter automotive safety standards (e.g., AEC-Q200).
- 2020: Significant investment in R&D for higher energy absorption varistors to meet the demands of EV power management systems.
- 2021: Emergence of advanced manufacturing techniques leading to miniaturized varistors with improved thermal performance.
- 2022: Growing integration of varistors into smart grid infrastructure and renewable energy solutions.
- 2023: Enhanced focus on supply chain resilience and diversification by key manufacturers.
- 2024: Introduction of varistors with lower capacitance for high-frequency applications in communication infrastructure.
- Ongoing: Continuous development of varistors with improved surge current handling capabilities and faster response times across all segments.
In-Depth Radial Leaded Varistor Market Outlook
The outlook for the global Radial Leaded Varistor market remains exceptionally positive, driven by sustained technological advancements and expanding applications. Key growth accelerators include the continued electrification of transportation, the pervasive rollout of 5G networks, and the ever-increasing complexity of consumer electronics. The market's resilience is further bolstered by stringent global safety regulations that mandate robust overvoltage protection. Strategic partnerships and market expansion into emerging economies are poised to unlock new revenue streams. The industry's ability to innovate, particularly in developing varistors with enhanced energy absorption and faster response times, will be critical in meeting the demands of next-generation technologies such as IoT and smart grids. The forecast indicates a steady and significant increase in market value and volume over the next decade, positioning radial leaded varistors as an indispensable component in modern electronic systems.
Radial Leaded Varistor Segmentation
-
1. Application
- 1.1. Automotive
- 1.2. Aerospace
- 1.3. Communication Infrastructure
- 1.4. Consumer Electronics
- 1.5. Others
-
2. Types
- 2.1. Medium and Low Voltage
- 2.2. High Voltage
Radial Leaded Varistor Segmentation By Geography
-
1. North America
- 1.1. United States
- 1.2. Canada
- 1.3. Mexico
-
2. South America
- 2.1. Brazil
- 2.2. Argentina
- 2.3. Rest of South America
-
3. Europe
- 3.1. United Kingdom
- 3.2. Germany
- 3.3. France
- 3.4. Italy
- 3.5. Spain
- 3.6. Russia
- 3.7. Benelux
- 3.8. Nordics
- 3.9. Rest of Europe
-
4. Middle East & Africa
- 4.1. Turkey
- 4.2. Israel
- 4.3. GCC
- 4.4. North Africa
- 4.5. South Africa
- 4.6. Rest of Middle East & Africa
-
5. Asia Pacific
- 5.1. China
- 5.2. India
- 5.3. Japan
- 5.4. South Korea
- 5.5. ASEAN
- 5.6. Oceania
- 5.7. Rest of Asia Pacific
Radial Leaded Varistor REPORT HIGHLIGHTS
| Aspects | Details |
|---|---|
| Study Period | 2019-2033 |
| Base Year | 2024 |
| Estimated Year | 2025 |
| Forecast Period | 2025-2033 |
| Historical Period | 2019-2024 |
| Growth Rate | CAGR of XX% from 2019-2033 |
| Segmentation |
|
Table of Contents
- 1. Introduction
- 1.1. Research Scope
- 1.2. Market Segmentation
- 1.3. Research Methodology
- 1.4. Definitions and Assumptions
- 2. Executive Summary
- 2.1. Introduction
- 3. Market Dynamics
- 3.1. Introduction
- 3.2. Market Drivers
- 3.3. Market Restrains
- 3.4. Market Trends
- 4. Market Factor Analysis
- 4.1. Porters Five Forces
- 4.2. Supply/Value Chain
- 4.3. PESTEL analysis
- 4.4. Market Entropy
- 4.5. Patent/Trademark Analysis
- 5. Global Radial Leaded Varistor Analysis, Insights and Forecast, 2019-2031
- 5.1. Market Analysis, Insights and Forecast - by Application
- 5.1.1. Automotive
- 5.1.2. Aerospace
- 5.1.3. Communication Infrastructure
- 5.1.4. Consumer Electronics
- 5.1.5. Others
- 5.2. Market Analysis, Insights and Forecast - by Types
- 5.2.1. Medium and Low Voltage
- 5.2.2. High Voltage
- 5.3. Market Analysis, Insights and Forecast - by Region
- 5.3.1. North America
- 5.3.2. South America
- 5.3.3. Europe
- 5.3.4. Middle East & Africa
- 5.3.5. Asia Pacific
- 5.1. Market Analysis, Insights and Forecast - by Application
- 6. North America Radial Leaded Varistor Analysis, Insights and Forecast, 2019-2031
- 6.1. Market Analysis, Insights and Forecast - by Application
- 6.1.1. Automotive
- 6.1.2. Aerospace
- 6.1.3. Communication Infrastructure
- 6.1.4. Consumer Electronics
- 6.1.5. Others
- 6.2. Market Analysis, Insights and Forecast - by Types
- 6.2.1. Medium and Low Voltage
- 6.2.2. High Voltage
- 6.1. Market Analysis, Insights and Forecast - by Application
- 7. South America Radial Leaded Varistor Analysis, Insights and Forecast, 2019-2031
- 7.1. Market Analysis, Insights and Forecast - by Application
- 7.1.1. Automotive
- 7.1.2. Aerospace
- 7.1.3. Communication Infrastructure
- 7.1.4. Consumer Electronics
- 7.1.5. Others
- 7.2. Market Analysis, Insights and Forecast - by Types
- 7.2.1. Medium and Low Voltage
- 7.2.2. High Voltage
- 7.1. Market Analysis, Insights and Forecast - by Application
- 8. Europe Radial Leaded Varistor Analysis, Insights and Forecast, 2019-2031
- 8.1. Market Analysis, Insights and Forecast - by Application
- 8.1.1. Automotive
- 8.1.2. Aerospace
- 8.1.3. Communication Infrastructure
- 8.1.4. Consumer Electronics
- 8.1.5. Others
- 8.2. Market Analysis, Insights and Forecast - by Types
- 8.2.1. Medium and Low Voltage
- 8.2.2. High Voltage
- 8.1. Market Analysis, Insights and Forecast - by Application
- 9. Middle East & Africa Radial Leaded Varistor Analysis, Insights and Forecast, 2019-2031
- 9.1. Market Analysis, Insights and Forecast - by Application
- 9.1.1. Automotive
- 9.1.2. Aerospace
- 9.1.3. Communication Infrastructure
- 9.1.4. Consumer Electronics
- 9.1.5. Others
- 9.2. Market Analysis, Insights and Forecast - by Types
- 9.2.1. Medium and Low Voltage
- 9.2.2. High Voltage
- 9.1. Market Analysis, Insights and Forecast - by Application
- 10. Asia Pacific Radial Leaded Varistor Analysis, Insights and Forecast, 2019-2031
- 10.1. Market Analysis, Insights and Forecast - by Application
- 10.1.1. Automotive
- 10.1.2. Aerospace
- 10.1.3. Communication Infrastructure
- 10.1.4. Consumer Electronics
- 10.1.5. Others
- 10.2. Market Analysis, Insights and Forecast - by Types
- 10.2.1. Medium and Low Voltage
- 10.2.2. High Voltage
- 10.1. Market Analysis, Insights and Forecast - by Application
- 11. Competitive Analysis
- 11.1. Global Market Share Analysis 2024
- 11.2. Company Profiles
- 11.2.1 TDK
- 11.2.1.1. Overview
- 11.2.1.2. Products
- 11.2.1.3. SWOT Analysis
- 11.2.1.4. Recent Developments
- 11.2.1.5. Financials (Based on Availability)
- 11.2.2 Vishay
- 11.2.2.1. Overview
- 11.2.2.2. Products
- 11.2.2.3. SWOT Analysis
- 11.2.2.4. Recent Developments
- 11.2.2.5. Financials (Based on Availability)
- 11.2.3 Littelfuse
- 11.2.3.1. Overview
- 11.2.3.2. Products
- 11.2.3.3. SWOT Analysis
- 11.2.3.4. Recent Developments
- 11.2.3.5. Financials (Based on Availability)
- 11.2.4 Panasonic
- 11.2.4.1. Overview
- 11.2.4.2. Products
- 11.2.4.3. SWOT Analysis
- 11.2.4.4. Recent Developments
- 11.2.4.5. Financials (Based on Availability)
- 11.2.5 Kyocera AVX
- 11.2.5.1. Overview
- 11.2.5.2. Products
- 11.2.5.3. SWOT Analysis
- 11.2.5.4. Recent Developments
- 11.2.5.5. Financials (Based on Availability)
- 11.2.6 Bourns
- 11.2.6.1. Overview
- 11.2.6.2. Products
- 11.2.6.3. SWOT Analysis
- 11.2.6.4. Recent Developments
- 11.2.6.5. Financials (Based on Availability)
- 11.2.7 Eaton
- 11.2.7.1. Overview
- 11.2.7.2. Products
- 11.2.7.3. SWOT Analysis
- 11.2.7.4. Recent Developments
- 11.2.7.5. Financials (Based on Availability)
- 11.2.8 Nippon Chemi-Con
- 11.2.8.1. Overview
- 11.2.8.2. Products
- 11.2.8.3. SWOT Analysis
- 11.2.8.4. Recent Developments
- 11.2.8.5. Financials (Based on Availability)
- 11.2.9 Thinking Electronic
- 11.2.9.1. Overview
- 11.2.9.2. Products
- 11.2.9.3. SWOT Analysis
- 11.2.9.4. Recent Developments
- 11.2.9.5. Financials (Based on Availability)
- 11.2.10 JOYIN
- 11.2.10.1. Overview
- 11.2.10.2. Products
- 11.2.10.3. SWOT Analysis
- 11.2.10.4. Recent Developments
- 11.2.10.5. Financials (Based on Availability)
- 11.2.11 Fenghua (HK) Electronics
- 11.2.11.1. Overview
- 11.2.11.2. Products
- 11.2.11.3. SWOT Analysis
- 11.2.11.4. Recent Developments
- 11.2.11.5. Financials (Based on Availability)
- 11.2.12 Songtian Electronics
- 11.2.12.1. Overview
- 11.2.12.2. Products
- 11.2.12.3. SWOT Analysis
- 11.2.12.4. Recent Developments
- 11.2.12.5. Financials (Based on Availability)
- 11.2.13 Nanjing Shiheng Electronics
- 11.2.13.1. Overview
- 11.2.13.2. Products
- 11.2.13.3. SWOT Analysis
- 11.2.13.4. Recent Developments
- 11.2.13.5. Financials (Based on Availability)
- 11.2.14 Xiamen SET Electronics
- 11.2.14.1. Overview
- 11.2.14.2. Products
- 11.2.14.3. SWOT Analysis
- 11.2.14.4. Recent Developments
- 11.2.14.5. Financials (Based on Availability)
- 11.2.15 Sinochip Electronics
- 11.2.15.1. Overview
- 11.2.15.2. Products
- 11.2.15.3. SWOT Analysis
- 11.2.15.4. Recent Developments
- 11.2.15.5. Financials (Based on Availability)
- 11.2.16 SOCAY
- 11.2.16.1. Overview
- 11.2.16.2. Products
- 11.2.16.3. SWOT Analysis
- 11.2.16.4. Recent Developments
- 11.2.16.5. Financials (Based on Availability)
- 11.2.17 Semiware Semiconductor Inc.
- 11.2.17.1. Overview
- 11.2.17.2. Products
- 11.2.17.3. SWOT Analysis
- 11.2.17.4. Recent Developments
- 11.2.17.5. Financials (Based on Availability)
- 11.2.1 TDK
List of Figures
- Figure 1: Global Radial Leaded Varistor Revenue Breakdown (million, %) by Region 2024 & 2032
- Figure 2: Global Radial Leaded Varistor Volume Breakdown (K, %) by Region 2024 & 2032
- Figure 3: North America Radial Leaded Varistor Revenue (million), by Application 2024 & 2032
- Figure 4: North America Radial Leaded Varistor Volume (K), by Application 2024 & 2032
- Figure 5: North America Radial Leaded Varistor Revenue Share (%), by Application 2024 & 2032
- Figure 6: North America Radial Leaded Varistor Volume Share (%), by Application 2024 & 2032
- Figure 7: North America Radial Leaded Varistor Revenue (million), by Types 2024 & 2032
- Figure 8: North America Radial Leaded Varistor Volume (K), by Types 2024 & 2032
- Figure 9: North America Radial Leaded Varistor Revenue Share (%), by Types 2024 & 2032
- Figure 10: North America Radial Leaded Varistor Volume Share (%), by Types 2024 & 2032
- Figure 11: North America Radial Leaded Varistor Revenue (million), by Country 2024 & 2032
- Figure 12: North America Radial Leaded Varistor Volume (K), by Country 2024 & 2032
- Figure 13: North America Radial Leaded Varistor Revenue Share (%), by Country 2024 & 2032
- Figure 14: North America Radial Leaded Varistor Volume Share (%), by Country 2024 & 2032
- Figure 15: South America Radial Leaded Varistor Revenue (million), by Application 2024 & 2032
- Figure 16: South America Radial Leaded Varistor Volume (K), by Application 2024 & 2032
- Figure 17: South America Radial Leaded Varistor Revenue Share (%), by Application 2024 & 2032
- Figure 18: South America Radial Leaded Varistor Volume Share (%), by Application 2024 & 2032
- Figure 19: South America Radial Leaded Varistor Revenue (million), by Types 2024 & 2032
- Figure 20: South America Radial Leaded Varistor Volume (K), by Types 2024 & 2032
- Figure 21: South America Radial Leaded Varistor Revenue Share (%), by Types 2024 & 2032
- Figure 22: South America Radial Leaded Varistor Volume Share (%), by Types 2024 & 2032
- Figure 23: South America Radial Leaded Varistor Revenue (million), by Country 2024 & 2032
- Figure 24: South America Radial Leaded Varistor Volume (K), by Country 2024 & 2032
- Figure 25: South America Radial Leaded Varistor Revenue Share (%), by Country 2024 & 2032
- Figure 26: South America Radial Leaded Varistor Volume Share (%), by Country 2024 & 2032
- Figure 27: Europe Radial Leaded Varistor Revenue (million), by Application 2024 & 2032
- Figure 28: Europe Radial Leaded Varistor Volume (K), by Application 2024 & 2032
- Figure 29: Europe Radial Leaded Varistor Revenue Share (%), by Application 2024 & 2032
- Figure 30: Europe Radial Leaded Varistor Volume Share (%), by Application 2024 & 2032
- Figure 31: Europe Radial Leaded Varistor Revenue (million), by Types 2024 & 2032
- Figure 32: Europe Radial Leaded Varistor Volume (K), by Types 2024 & 2032
- Figure 33: Europe Radial Leaded Varistor Revenue Share (%), by Types 2024 & 2032
- Figure 34: Europe Radial Leaded Varistor Volume Share (%), by Types 2024 & 2032
- Figure 35: Europe Radial Leaded Varistor Revenue (million), by Country 2024 & 2032
- Figure 36: Europe Radial Leaded Varistor Volume (K), by Country 2024 & 2032
- Figure 37: Europe Radial Leaded Varistor Revenue Share (%), by Country 2024 & 2032
- Figure 38: Europe Radial Leaded Varistor Volume Share (%), by Country 2024 & 2032
- Figure 39: Middle East & Africa Radial Leaded Varistor Revenue (million), by Application 2024 & 2032
- Figure 40: Middle East & Africa Radial Leaded Varistor Volume (K), by Application 2024 & 2032
- Figure 41: Middle East & Africa Radial Leaded Varistor Revenue Share (%), by Application 2024 & 2032
- Figure 42: Middle East & Africa Radial Leaded Varistor Volume Share (%), by Application 2024 & 2032
- Figure 43: Middle East & Africa Radial Leaded Varistor Revenue (million), by Types 2024 & 2032
- Figure 44: Middle East & Africa Radial Leaded Varistor Volume (K), by Types 2024 & 2032
- Figure 45: Middle East & Africa Radial Leaded Varistor Revenue Share (%), by Types 2024 & 2032
- Figure 46: Middle East & Africa Radial Leaded Varistor Volume Share (%), by Types 2024 & 2032
- Figure 47: Middle East & Africa Radial Leaded Varistor Revenue (million), by Country 2024 & 2032
- Figure 48: Middle East & Africa Radial Leaded Varistor Volume (K), by Country 2024 & 2032
- Figure 49: Middle East & Africa Radial Leaded Varistor Revenue Share (%), by Country 2024 & 2032
- Figure 50: Middle East & Africa Radial Leaded Varistor Volume Share (%), by Country 2024 & 2032
- Figure 51: Asia Pacific Radial Leaded Varistor Revenue (million), by Application 2024 & 2032
- Figure 52: Asia Pacific Radial Leaded Varistor Volume (K), by Application 2024 & 2032
- Figure 53: Asia Pacific Radial Leaded Varistor Revenue Share (%), by Application 2024 & 2032
- Figure 54: Asia Pacific Radial Leaded Varistor Volume Share (%), by Application 2024 & 2032
- Figure 55: Asia Pacific Radial Leaded Varistor Revenue (million), by Types 2024 & 2032
- Figure 56: Asia Pacific Radial Leaded Varistor Volume (K), by Types 2024 & 2032
- Figure 57: Asia Pacific Radial Leaded Varistor Revenue Share (%), by Types 2024 & 2032
- Figure 58: Asia Pacific Radial Leaded Varistor Volume Share (%), by Types 2024 & 2032
- Figure 59: Asia Pacific Radial Leaded Varistor Revenue (million), by Country 2024 & 2032
- Figure 60: Asia Pacific Radial Leaded Varistor Volume (K), by Country 2024 & 2032
- Figure 61: Asia Pacific Radial Leaded Varistor Revenue Share (%), by Country 2024 & 2032
- Figure 62: Asia Pacific Radial Leaded Varistor Volume Share (%), by Country 2024 & 2032
List of Tables
- Table 1: Global Radial Leaded Varistor Revenue million Forecast, by Region 2019 & 2032
- Table 2: Global Radial Leaded Varistor Volume K Forecast, by Region 2019 & 2032
- Table 3: Global Radial Leaded Varistor Revenue million Forecast, by Application 2019 & 2032
- Table 4: Global Radial Leaded Varistor Volume K Forecast, by Application 2019 & 2032
- Table 5: Global Radial Leaded Varistor Revenue million Forecast, by Types 2019 & 2032
- Table 6: Global Radial Leaded Varistor Volume K Forecast, by Types 2019 & 2032
- Table 7: Global Radial Leaded Varistor Revenue million Forecast, by Region 2019 & 2032
- Table 8: Global Radial Leaded Varistor Volume K Forecast, by Region 2019 & 2032
- Table 9: Global Radial Leaded Varistor Revenue million Forecast, by Application 2019 & 2032
- Table 10: Global Radial Leaded Varistor Volume K Forecast, by Application 2019 & 2032
- Table 11: Global Radial Leaded Varistor Revenue million Forecast, by Types 2019 & 2032
- Table 12: Global Radial Leaded Varistor Volume K Forecast, by Types 2019 & 2032
- Table 13: Global Radial Leaded Varistor Revenue million Forecast, by Country 2019 & 2032
- Table 14: Global Radial Leaded Varistor Volume K Forecast, by Country 2019 & 2032
- Table 15: United States Radial Leaded Varistor Revenue (million) Forecast, by Application 2019 & 2032
- Table 16: United States Radial Leaded Varistor Volume (K) Forecast, by Application 2019 & 2032
- Table 17: Canada Radial Leaded Varistor Revenue (million) Forecast, by Application 2019 & 2032
- Table 18: Canada Radial Leaded Varistor Volume (K) Forecast, by Application 2019 & 2032
- Table 19: Mexico Radial Leaded Varistor Revenue (million) Forecast, by Application 2019 & 2032
- Table 20: Mexico Radial Leaded Varistor Volume (K) Forecast, by Application 2019 & 2032
- Table 21: Global Radial Leaded Varistor Revenue million Forecast, by Application 2019 & 2032
- Table 22: Global Radial Leaded Varistor Volume K Forecast, by Application 2019 & 2032
- Table 23: Global Radial Leaded Varistor Revenue million Forecast, by Types 2019 & 2032
- Table 24: Global Radial Leaded Varistor Volume K Forecast, by Types 2019 & 2032
- Table 25: Global Radial Leaded Varistor Revenue million Forecast, by Country 2019 & 2032
- Table 26: Global Radial Leaded Varistor Volume K Forecast, by Country 2019 & 2032
- Table 27: Brazil Radial Leaded Varistor Revenue (million) Forecast, by Application 2019 & 2032
- Table 28: Brazil Radial Leaded Varistor Volume (K) Forecast, by Application 2019 & 2032
- Table 29: Argentina Radial Leaded Varistor Revenue (million) Forecast, by Application 2019 & 2032
- Table 30: Argentina Radial Leaded Varistor Volume (K) Forecast, by Application 2019 & 2032
- Table 31: Rest of South America Radial Leaded Varistor Revenue (million) Forecast, by Application 2019 & 2032
- Table 32: Rest of South America Radial Leaded Varistor Volume (K) Forecast, by Application 2019 & 2032
- Table 33: Global Radial Leaded Varistor Revenue million Forecast, by Application 2019 & 2032
- Table 34: Global Radial Leaded Varistor Volume K Forecast, by Application 2019 & 2032
- Table 35: Global Radial Leaded Varistor Revenue million Forecast, by Types 2019 & 2032
- Table 36: Global Radial Leaded Varistor Volume K Forecast, by Types 2019 & 2032
- Table 37: Global Radial Leaded Varistor Revenue million Forecast, by Country 2019 & 2032
- Table 38: Global Radial Leaded Varistor Volume K Forecast, by Country 2019 & 2032
- Table 39: United Kingdom Radial Leaded Varistor Revenue (million) Forecast, by Application 2019 & 2032
- Table 40: United Kingdom Radial Leaded Varistor Volume (K) Forecast, by Application 2019 & 2032
- Table 41: Germany Radial Leaded Varistor Revenue (million) Forecast, by Application 2019 & 2032
- Table 42: Germany Radial Leaded Varistor Volume (K) Forecast, by Application 2019 & 2032
- Table 43: France Radial Leaded Varistor Revenue (million) Forecast, by Application 2019 & 2032
- Table 44: France Radial Leaded Varistor Volume (K) Forecast, by Application 2019 & 2032
- Table 45: Italy Radial Leaded Varistor Revenue (million) Forecast, by Application 2019 & 2032
- Table 46: Italy Radial Leaded Varistor Volume (K) Forecast, by Application 2019 & 2032
- Table 47: Spain Radial Leaded Varistor Revenue (million) Forecast, by Application 2019 & 2032
- Table 48: Spain Radial Leaded Varistor Volume (K) Forecast, by Application 2019 & 2032
- Table 49: Russia Radial Leaded Varistor Revenue (million) Forecast, by Application 2019 & 2032
- Table 50: Russia Radial Leaded Varistor Volume (K) Forecast, by Application 2019 & 2032
- Table 51: Benelux Radial Leaded Varistor Revenue (million) Forecast, by Application 2019 & 2032
- Table 52: Benelux Radial Leaded Varistor Volume (K) Forecast, by Application 2019 & 2032
- Table 53: Nordics Radial Leaded Varistor Revenue (million) Forecast, by Application 2019 & 2032
- Table 54: Nordics Radial Leaded Varistor Volume (K) Forecast, by Application 2019 & 2032
- Table 55: Rest of Europe Radial Leaded Varistor Revenue (million) Forecast, by Application 2019 & 2032
- Table 56: Rest of Europe Radial Leaded Varistor Volume (K) Forecast, by Application 2019 & 2032
- Table 57: Global Radial Leaded Varistor Revenue million Forecast, by Application 2019 & 2032
- Table 58: Global Radial Leaded Varistor Volume K Forecast, by Application 2019 & 2032
- Table 59: Global Radial Leaded Varistor Revenue million Forecast, by Types 2019 & 2032
- Table 60: Global Radial Leaded Varistor Volume K Forecast, by Types 2019 & 2032
- Table 61: Global Radial Leaded Varistor Revenue million Forecast, by Country 2019 & 2032
- Table 62: Global Radial Leaded Varistor Volume K Forecast, by Country 2019 & 2032
- Table 63: Turkey Radial Leaded Varistor Revenue (million) Forecast, by Application 2019 & 2032
- Table 64: Turkey Radial Leaded Varistor Volume (K) Forecast, by Application 2019 & 2032
- Table 65: Israel Radial Leaded Varistor Revenue (million) Forecast, by Application 2019 & 2032
- Table 66: Israel Radial Leaded Varistor Volume (K) Forecast, by Application 2019 & 2032
- Table 67: GCC Radial Leaded Varistor Revenue (million) Forecast, by Application 2019 & 2032
- Table 68: GCC Radial Leaded Varistor Volume (K) Forecast, by Application 2019 & 2032
- Table 69: North Africa Radial Leaded Varistor Revenue (million) Forecast, by Application 2019 & 2032
- Table 70: North Africa Radial Leaded Varistor Volume (K) Forecast, by Application 2019 & 2032
- Table 71: South Africa Radial Leaded Varistor Revenue (million) Forecast, by Application 2019 & 2032
- Table 72: South Africa Radial Leaded Varistor Volume (K) Forecast, by Application 2019 & 2032
- Table 73: Rest of Middle East & Africa Radial Leaded Varistor Revenue (million) Forecast, by Application 2019 & 2032
- Table 74: Rest of Middle East & Africa Radial Leaded Varistor Volume (K) Forecast, by Application 2019 & 2032
- Table 75: Global Radial Leaded Varistor Revenue million Forecast, by Application 2019 & 2032
- Table 76: Global Radial Leaded Varistor Volume K Forecast, by Application 2019 & 2032
- Table 77: Global Radial Leaded Varistor Revenue million Forecast, by Types 2019 & 2032
- Table 78: Global Radial Leaded Varistor Volume K Forecast, by Types 2019 & 2032
- Table 79: Global Radial Leaded Varistor Revenue million Forecast, by Country 2019 & 2032
- Table 80: Global Radial Leaded Varistor Volume K Forecast, by Country 2019 & 2032
- Table 81: China Radial Leaded Varistor Revenue (million) Forecast, by Application 2019 & 2032
- Table 82: China Radial Leaded Varistor Volume (K) Forecast, by Application 2019 & 2032
- Table 83: India Radial Leaded Varistor Revenue (million) Forecast, by Application 2019 & 2032
- Table 84: India Radial Leaded Varistor Volume (K) Forecast, by Application 2019 & 2032
- Table 85: Japan Radial Leaded Varistor Revenue (million) Forecast, by Application 2019 & 2032
- Table 86: Japan Radial Leaded Varistor Volume (K) Forecast, by Application 2019 & 2032
- Table 87: South Korea Radial Leaded Varistor Revenue (million) Forecast, by Application 2019 & 2032
- Table 88: South Korea Radial Leaded Varistor Volume (K) Forecast, by Application 2019 & 2032
- Table 89: ASEAN Radial Leaded Varistor Revenue (million) Forecast, by Application 2019 & 2032
- Table 90: ASEAN Radial Leaded Varistor Volume (K) Forecast, by Application 2019 & 2032
- Table 91: Oceania Radial Leaded Varistor Revenue (million) Forecast, by Application 2019 & 2032
- Table 92: Oceania Radial Leaded Varistor Volume (K) Forecast, by Application 2019 & 2032
- Table 93: Rest of Asia Pacific Radial Leaded Varistor Revenue (million) Forecast, by Application 2019 & 2032
- Table 94: Rest of Asia Pacific Radial Leaded Varistor Volume (K) Forecast, by Application 2019 & 2032
Frequently Asked Questions
1. What is the projected Compound Annual Growth Rate (CAGR) of the Radial Leaded Varistor?
The projected CAGR is approximately XX%.
2. Which companies are prominent players in the Radial Leaded Varistor?
Key companies in the market include TDK, Vishay, Littelfuse, Panasonic, Kyocera AVX, Bourns, Eaton, Nippon Chemi-Con, Thinking Electronic, JOYIN, Fenghua (HK) Electronics, Songtian Electronics, Nanjing Shiheng Electronics, Xiamen SET Electronics, Sinochip Electronics, SOCAY, Semiware Semiconductor Inc..
3. What are the main segments of the Radial Leaded Varistor?
The market segments include Application, Types.
4. Can you provide details about the market size?
The market size is estimated to be USD XXX million as of 2022.
5. What are some drivers contributing to market growth?
N/A
6. What are the notable trends driving market growth?
N/A
7. Are there any restraints impacting market growth?
N/A
8. Can you provide examples of recent developments in the market?
N/A
9. What pricing options are available for accessing the report?
Pricing options include single-user, multi-user, and enterprise licenses priced at USD 3950.00, USD 5925.00, and USD 7900.00 respectively.
10. Is the market size provided in terms of value or volume?
The market size is provided in terms of value, measured in million and volume, measured in K.
11. Are there any specific market keywords associated with the report?
Yes, the market keyword associated with the report is "Radial Leaded Varistor," which aids in identifying and referencing the specific market segment covered.
12. How do I determine which pricing option suits my needs best?
The pricing options vary based on user requirements and access needs. Individual users may opt for single-user licenses, while businesses requiring broader access may choose multi-user or enterprise licenses for cost-effective access to the report.
13. Are there any additional resources or data provided in the Radial Leaded Varistor report?
While the report offers comprehensive insights, it's advisable to review the specific contents or supplementary materials provided to ascertain if additional resources or data are available.
14. How can I stay updated on further developments or reports in the Radial Leaded Varistor?
To stay informed about further developments, trends, and reports in the Radial Leaded Varistor, consider subscribing to industry newsletters, following relevant companies and organizations, or regularly checking reputable industry news sources and publications.
Methodology
Step 1 - Identification of Relevant Samples Size from Population Database


Step 2 - Approaches for Defining Global Market Size (Value, Volume* & Price*)

Note*: In applicable scenarios
Step 3 - Data Sources
Primary Research
- Web Analytics
- Survey Reports
- Research Institute
- Latest Research Reports
- Opinion Leaders
Secondary Research
- Annual Reports
- White Paper
- Latest Press Release
- Industry Association
- Paid Database
- Investor Presentations

Step 4 - Data Triangulation
Involves using different sources of information in order to increase the validity of a study
These sources are likely to be stakeholders in a program - participants, other researchers, program staff, other community members, and so on.
Then we put all data in single framework & apply various statistical tools to find out the dynamic on the market.
During the analysis stage, feedback from the stakeholder groups would be compared to determine areas of agreement as well as areas of divergence
