

Key Insights
The recovered paper industry, exhibiting a CAGR of 2.70%, presents a significant market opportunity. Driven by increasing environmental awareness and stringent regulations promoting recycling, the demand for recovered paper is steadily growing. Key segments like printing and writing paper, newsprint, and containerboard contribute substantially to the overall market value, with printing and writing paper likely holding the largest share due to its widespread use in offices and homes. The tissue segment is also experiencing robust growth, fueled by rising hygiene standards and increased disposable income. Growth is geographically diverse, with North America and Europe currently holding significant market share due to established recycling infrastructure and consumer behavior. However, Asia-Pacific, particularly China and India, are emerging as key growth regions, driven by rapid industrialization and urbanization, leading to increased paper consumption and subsequent waste generation. Major players like International Paper, Smurfit Kappa, and Nine Dragons Paper are strategically investing in capacity expansion and technological advancements to meet this rising demand. Challenges include fluctuating paper prices, dependence on consistent wastepaper collection, and the need for continuous innovation in recycling technologies to enhance efficiency and quality. The industry is likely to witness further consolidation through mergers and acquisitions, driving innovation and efficiency gains. Over the forecast period (2025-2033), the market is expected to experience sustained growth, driven by a combination of robust demand and ongoing efforts towards a circular economy.
The industry's growth trajectory is further influenced by several factors. The rising cost of virgin pulp is pushing businesses to opt for more cost-effective recycled paper alternatives. Simultaneously, advancements in sorting and processing technologies are improving the quality of recovered paper, making it suitable for a wider range of applications. Government initiatives promoting sustainable practices and stricter waste management regulations are also providing further impetus. However, inconsistencies in waste collection systems and the presence of contaminants in recovered paper streams present ongoing challenges. Future growth will depend on the effective management of these challenges, along with continuous technological advancements that address issues like contamination and improve the overall quality and efficiency of the recycling process.
Recovered Paper Industry Market Report: 2019-2033
This comprehensive report provides a detailed analysis of the Recovered Paper Industry, encompassing market dynamics, growth trends, regional dominance, product landscape, key players, and future outlook. The study period covers 2019-2033, with 2025 as the base and estimated year. The forecast period extends from 2025 to 2033, and the historical period analyzed is 2019-2024. The report is invaluable for industry professionals, investors, and strategists seeking to understand and capitalize on opportunities within this dynamic sector. The total market size in 2025 is estimated at xx Million units.
Recovered Paper Industry Market Dynamics & Structure
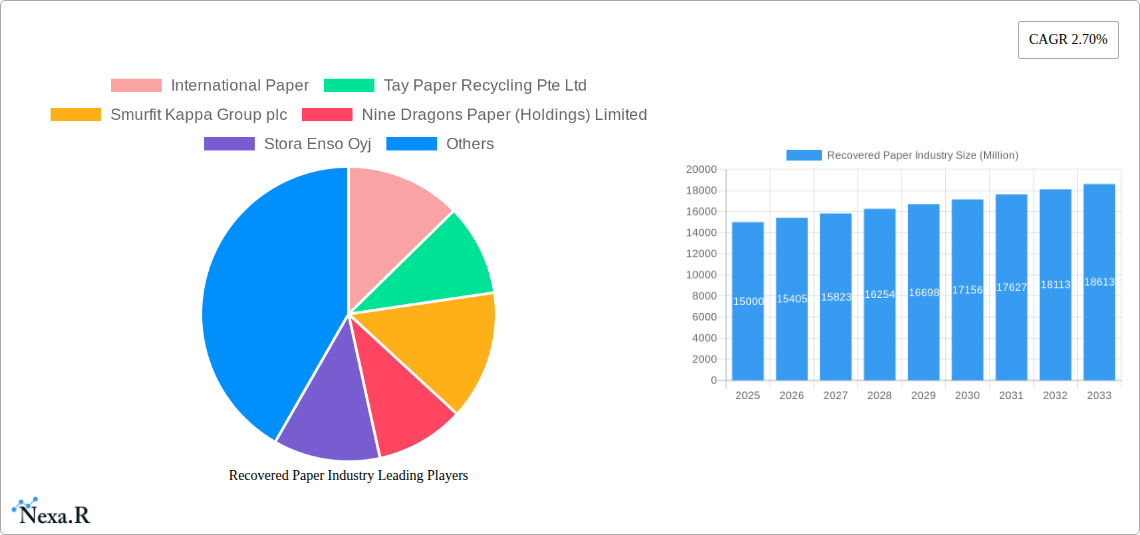
The Recovered Paper Industry is characterized by moderate concentration, with key players like International Paper, Smurfit Kappa, and Nine Dragons holding significant market share. The industry witnesses consistent technological innovation focused on improving sorting, pulping, and de-inking processes to enhance paper quality and reduce environmental impact. Stringent environmental regulations, particularly concerning recycling targets and waste management, are key drivers, while fluctuating raw material prices and competition from alternative packaging materials pose significant challenges. Mergers and acquisitions (M&A) activity is moderate, with larger players consolidating their positions.
- Market Concentration: Highly concentrated with top 5 players holding approximately xx% of market share in 2025.
- Technological Innovation: Focus on automation, AI-powered sorting, and improved pulping technologies to enhance efficiency and quality.
- Regulatory Framework: Stringent environmental regulations drive growth, but compliance costs can be significant.
- Competitive Substitutes: Plastic packaging presents a major competitive threat.
- End-User Demographics: Primarily driven by packaging and printing industries, with growing demand from tissue and newsprint segments.
- M&A Trends: Moderate M&A activity, primarily driven by consolidation among larger players and expansion into new markets. The total M&A deal volume in the period 2019-2024 was approximately xx Million units.
Recovered Paper Industry Growth Trends & Insights
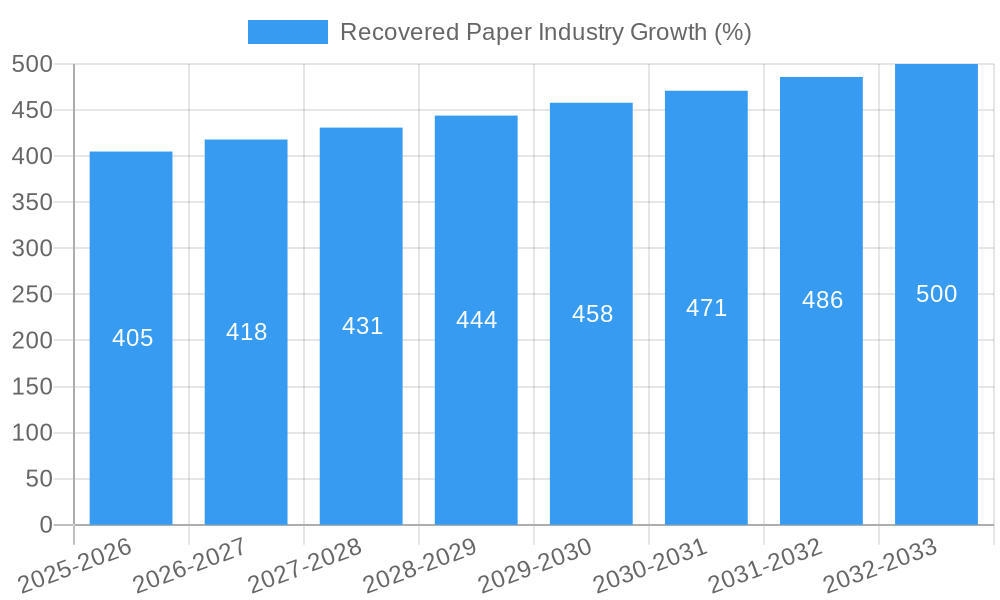
The Recovered Paper Industry demonstrates steady growth, driven by increasing environmental awareness, stringent recycling mandates, and the rising demand for sustainable packaging solutions. The market size expanded from xx Million units in 2019 to an estimated xx Million units in 2025. Technological advancements, such as improved sorting and pulping technologies, have enhanced the quality and usability of recovered paper, thereby fueling market adoption. Shifting consumer preferences towards eco-friendly products further contribute to this growth trajectory. The compound annual growth rate (CAGR) for the period 2019-2025 is estimated to be xx%, with projected growth continuing at a CAGR of xx% during 2025-2033. Market penetration in key regions is expected to further increase driven by government initiatives and increased consumer awareness.
Dominant Regions, Countries, or Segments in Recovered Paper Industry
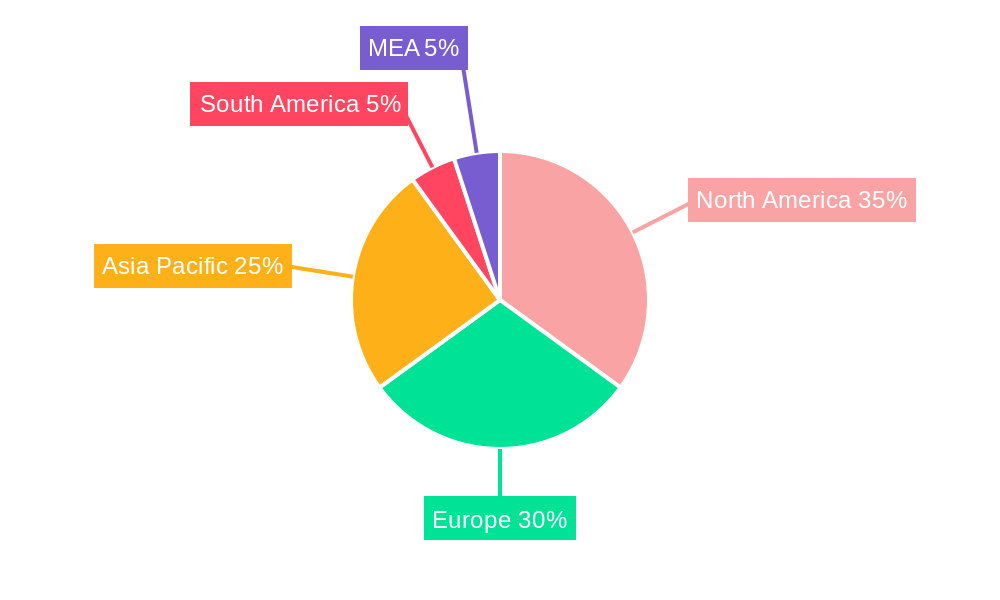
North America and Europe currently dominate the Recovered Paper Industry, driven by well-established recycling infrastructure, stringent environmental regulations, and a high concentration of key players. Within the product segments, Containerboard displays the highest growth potential, followed by Printing and Writing Paper.
- Key Drivers:
- North America: Robust recycling infrastructure, stringent environmental regulations, and high demand for packaging materials.
- Europe: Stringent EU waste management directives and established recycling programs.
- Containerboard Segment: Driven by e-commerce growth and demand for sustainable packaging.
- Dominance Factors: High population density, strong industrial base, supportive government policies, and established recycling infrastructure.
- Growth Potential: Emerging economies in Asia and Latin America present significant untapped growth potential.
Recovered Paper Industry Product Landscape
The recovered paper market offers various grades tailored to different applications, including printing and writing paper, newsprint, tissue, and containerboard. Recent innovations focus on enhancing the quality of recycled fibers, making them comparable to virgin pulp for various applications. This involves advancements in de-inking and bleaching technologies to produce brighter and stronger paper. The industry is also witnessing the emergence of specialized recycled paper grades with enhanced properties, catering to specific customer needs and promoting sustainability.
Key Drivers, Barriers & Challenges in Recovered Paper Industry
Key Drivers:
- Growing environmental awareness and stringent government regulations promoting recycling.
- Increasing demand for sustainable packaging solutions driven by the e-commerce boom.
- Technological advancements improving the quality and efficiency of recovered paper production.
Key Challenges:
- Fluctuating raw material prices and supply chain disruptions.
- Competition from alternative packaging materials, such as plastics.
- Regulatory hurdles and compliance costs associated with environmental regulations. The estimated cost of compliance with new regulations in 2025 is xx Million units.
Emerging Opportunities in Recovered Paper Industry
- Expanding into new applications, such as bio-based materials and specialty papers.
- Targeting untapped markets in developing economies with growing populations and increasing demand for packaging.
- Developing innovative recycling technologies and solutions to address challenges in processing complex waste streams.
Growth Accelerators in the Recovered Paper Industry
Technological breakthroughs, particularly in AI-powered sorting and advanced pulping techniques, will significantly enhance the efficiency and quality of recovered paper production. Strategic partnerships between paper manufacturers, recyclers, and technology providers will drive innovation and market expansion. Increased investment in recycling infrastructure and government support for sustainable initiatives will also significantly accelerate industry growth.
Key Players Shaping the Recovered Paper Industry Market
- International Paper
- Tay Paper Recycling Pte Ltd
- Smurfit Kappa Group plc
- Nine Dragons Paper (Holdings) Limited
- Stora Enso Oyj
- S A Industrias Celulosa Aragonesa (SAICA)
- Visy Industrie
- DS Smith Plc
Notable Milestones in Recovered Paper Industry Sector
- 2021: Several major players invested heavily in advanced sorting technologies.
- 2022: New EU regulations on plastic packaging spurred increased demand for recycled paper.
- 2023: A significant merger occurred between two medium-sized recyclers, leading to increased market consolidation.
- 2024: A leading paper manufacturer launched a new range of sustainable packaging materials made from 100% recycled paper.
In-Depth Recovered Paper Industry Market Outlook
The Recovered Paper Industry is poised for continued growth driven by the increasing demand for sustainable packaging, stricter environmental regulations, and technological advancements in recycling technologies. Strategic investments in research and development, expansion into new markets, and sustainable supply chain practices will be crucial for companies to capture opportunities and enhance their competitive advantage. The long-term market potential is significant, and opportunities exist for both established players and emerging innovators.
Recovered Paper Industry Segmentation
-
1. Type
- 1.1. Printing and Writing Paper
- 1.2. Newsprint
- 1.3. Tissue
- 1.4. Containerboard
- 1.5. Other Types
Recovered Paper Industry Segmentation By Geography
- 1. North America
- 2. Europe
- 3. Asia Pacific
- 4. Latin America
- 5. Middle East and Africa
Recovered Paper Industry REPORT HIGHLIGHTS
| Aspects | Details |
|---|---|
| Study Period | 2019-2033 |
| Base Year | 2024 |
| Estimated Year | 2025 |
| Forecast Period | 2025-2033 |
| Historical Period | 2019-2024 |
| Growth Rate | CAGR of 2.70% from 2019-2033 |
| Segmentation |
|
Table of Contents
- 1. Introduction
- 1.1. Research Scope
- 1.2. Market Segmentation
- 1.3. Research Methodology
- 1.4. Definitions and Assumptions
- 2. Executive Summary
- 2.1. Introduction
- 3. Market Dynamics
- 3.1. Introduction
- 3.2. Market Drivers
- 3.2.1. Growth in E-commerce Sales in China; Rising Demand from the Food-service Sector; Growing Consumer Awareness on Paper Packaging; Recycling Initiatives Involving Closed-loop Systems to Aid Market Adoption of Paper Packaging-based Materials
- 3.3. Market Restrains
- 3.3.1 Recycling
- 3.3.2 Raw Material Supply Chain Management
- 3.3.3 and Challenges in the Paper Packaging Industry; Effects of Deforestation on Paper Packaging; Increasing Raw Material Costs and Outsourcing
- 3.4. Market Trends
- 3.4.1. Containerboard to Dominate the Market
- 4. Market Factor Analysis
- 4.1. Porters Five Forces
- 4.2. Supply/Value Chain
- 4.3. PESTEL analysis
- 4.4. Market Entropy
- 4.5. Patent/Trademark Analysis
- 5. Global Recovered Paper Industry Analysis, Insights and Forecast, 2019-2031
- 5.1. Market Analysis, Insights and Forecast - by Type
- 5.1.1. Printing and Writing Paper
- 5.1.2. Newsprint
- 5.1.3. Tissue
- 5.1.4. Containerboard
- 5.1.5. Other Types
- 5.2. Market Analysis, Insights and Forecast - by Region
- 5.2.1. North America
- 5.2.2. Europe
- 5.2.3. Asia Pacific
- 5.2.4. Latin America
- 5.2.5. Middle East and Africa
- 5.1. Market Analysis, Insights and Forecast - by Type
- 6. North America Recovered Paper Industry Analysis, Insights and Forecast, 2019-2031
- 6.1. Market Analysis, Insights and Forecast - by Type
- 6.1.1. Printing and Writing Paper
- 6.1.2. Newsprint
- 6.1.3. Tissue
- 6.1.4. Containerboard
- 6.1.5. Other Types
- 6.1. Market Analysis, Insights and Forecast - by Type
- 7. Europe Recovered Paper Industry Analysis, Insights and Forecast, 2019-2031
- 7.1. Market Analysis, Insights and Forecast - by Type
- 7.1.1. Printing and Writing Paper
- 7.1.2. Newsprint
- 7.1.3. Tissue
- 7.1.4. Containerboard
- 7.1.5. Other Types
- 7.1. Market Analysis, Insights and Forecast - by Type
- 8. Asia Pacific Recovered Paper Industry Analysis, Insights and Forecast, 2019-2031
- 8.1. Market Analysis, Insights and Forecast - by Type
- 8.1.1. Printing and Writing Paper
- 8.1.2. Newsprint
- 8.1.3. Tissue
- 8.1.4. Containerboard
- 8.1.5. Other Types
- 8.1. Market Analysis, Insights and Forecast - by Type
- 9. Latin America Recovered Paper Industry Analysis, Insights and Forecast, 2019-2031
- 9.1. Market Analysis, Insights and Forecast - by Type
- 9.1.1. Printing and Writing Paper
- 9.1.2. Newsprint
- 9.1.3. Tissue
- 9.1.4. Containerboard
- 9.1.5. Other Types
- 9.1. Market Analysis, Insights and Forecast - by Type
- 10. Middle East and Africa Recovered Paper Industry Analysis, Insights and Forecast, 2019-2031
- 10.1. Market Analysis, Insights and Forecast - by Type
- 10.1.1. Printing and Writing Paper
- 10.1.2. Newsprint
- 10.1.3. Tissue
- 10.1.4. Containerboard
- 10.1.5. Other Types
- 10.1. Market Analysis, Insights and Forecast - by Type
- 11. North America Recovered Paper Industry Analysis, Insights and Forecast, 2019-2031
- 11.1. Market Analysis, Insights and Forecast - By Country/Sub-region
- 11.1.1 United States
- 11.1.2 Canada
- 11.1.3 Mexico
- 12. Europe Recovered Paper Industry Analysis, Insights and Forecast, 2019-2031
- 12.1. Market Analysis, Insights and Forecast - By Country/Sub-region
- 12.1.1 Germany
- 12.1.2 United Kingdom
- 12.1.3 France
- 12.1.4 Spain
- 12.1.5 Italy
- 12.1.6 Spain
- 12.1.7 Belgium
- 12.1.8 Netherland
- 12.1.9 Nordics
- 12.1.10 Rest of Europe
- 13. Asia Pacific Recovered Paper Industry Analysis, Insights and Forecast, 2019-2031
- 13.1. Market Analysis, Insights and Forecast - By Country/Sub-region
- 13.1.1 China
- 13.1.2 Japan
- 13.1.3 India
- 13.1.4 South Korea
- 13.1.5 Southeast Asia
- 13.1.6 Australia
- 13.1.7 Indonesia
- 13.1.8 Phillipes
- 13.1.9 Singapore
- 13.1.10 Thailandc
- 13.1.11 Rest of Asia Pacific
- 14. South America Recovered Paper Industry Analysis, Insights and Forecast, 2019-2031
- 14.1. Market Analysis, Insights and Forecast - By Country/Sub-region
- 14.1.1 Brazil
- 14.1.2 Argentina
- 14.1.3 Peru
- 14.1.4 Chile
- 14.1.5 Colombia
- 14.1.6 Ecuador
- 14.1.7 Venezuela
- 14.1.8 Rest of South America
- 15. North America Recovered Paper Industry Analysis, Insights and Forecast, 2019-2031
- 15.1. Market Analysis, Insights and Forecast - By Country/Sub-region
- 15.1.1 United States
- 15.1.2 Canada
- 15.1.3 Mexico
- 16. MEA Recovered Paper Industry Analysis, Insights and Forecast, 2019-2031
- 16.1. Market Analysis, Insights and Forecast - By Country/Sub-region
- 16.1.1 United Arab Emirates
- 16.1.2 Saudi Arabia
- 16.1.3 South Africa
- 16.1.4 Rest of Middle East and Africa
- 17. Competitive Analysis
- 17.1. Global Market Share Analysis 2024
- 17.2. Company Profiles
- 17.2.1 International Paper
- 17.2.1.1. Overview
- 17.2.1.2. Products
- 17.2.1.3. SWOT Analysis
- 17.2.1.4. Recent Developments
- 17.2.1.5. Financials (Based on Availability)
- 17.2.2 Tay Paper Recycling Pte Ltd
- 17.2.2.1. Overview
- 17.2.2.2. Products
- 17.2.2.3. SWOT Analysis
- 17.2.2.4. Recent Developments
- 17.2.2.5. Financials (Based on Availability)
- 17.2.3 Smurfit Kappa Group plc
- 17.2.3.1. Overview
- 17.2.3.2. Products
- 17.2.3.3. SWOT Analysis
- 17.2.3.4. Recent Developments
- 17.2.3.5. Financials (Based on Availability)
- 17.2.4 Nine Dragons Paper (Holdings) Limited
- 17.2.4.1. Overview
- 17.2.4.2. Products
- 17.2.4.3. SWOT Analysis
- 17.2.4.4. Recent Developments
- 17.2.4.5. Financials (Based on Availability)
- 17.2.5 Stora Enso Oyj
- 17.2.5.1. Overview
- 17.2.5.2. Products
- 17.2.5.3. SWOT Analysis
- 17.2.5.4. Recent Developments
- 17.2.5.5. Financials (Based on Availability)
- 17.2.6 S A Industrias Celulosa Aragonesa (SAICA)
- 17.2.6.1. Overview
- 17.2.6.2. Products
- 17.2.6.3. SWOT Analysis
- 17.2.6.4. Recent Developments
- 17.2.6.5. Financials (Based on Availability)
- 17.2.7 Visy Industrie
- 17.2.7.1. Overview
- 17.2.7.2. Products
- 17.2.7.3. SWOT Analysis
- 17.2.7.4. Recent Developments
- 17.2.7.5. Financials (Based on Availability)
- 17.2.8 DS Smith Plc
- 17.2.8.1. Overview
- 17.2.8.2. Products
- 17.2.8.3. SWOT Analysis
- 17.2.8.4. Recent Developments
- 17.2.8.5. Financials (Based on Availability)
- 17.2.1 International Paper
List of Figures
- Figure 1: Global Recovered Paper Industry Revenue Breakdown (Million, %) by Region 2024 & 2032
- Figure 2: North America Recovered Paper Industry Revenue (Million), by Country 2024 & 2032
- Figure 3: North America Recovered Paper Industry Revenue Share (%), by Country 2024 & 2032
- Figure 4: Europe Recovered Paper Industry Revenue (Million), by Country 2024 & 2032
- Figure 5: Europe Recovered Paper Industry Revenue Share (%), by Country 2024 & 2032
- Figure 6: Asia Pacific Recovered Paper Industry Revenue (Million), by Country 2024 & 2032
- Figure 7: Asia Pacific Recovered Paper Industry Revenue Share (%), by Country 2024 & 2032
- Figure 8: South America Recovered Paper Industry Revenue (Million), by Country 2024 & 2032
- Figure 9: South America Recovered Paper Industry Revenue Share (%), by Country 2024 & 2032
- Figure 10: North America Recovered Paper Industry Revenue (Million), by Country 2024 & 2032
- Figure 11: North America Recovered Paper Industry Revenue Share (%), by Country 2024 & 2032
- Figure 12: MEA Recovered Paper Industry Revenue (Million), by Country 2024 & 2032
- Figure 13: MEA Recovered Paper Industry Revenue Share (%), by Country 2024 & 2032
- Figure 14: North America Recovered Paper Industry Revenue (Million), by Type 2024 & 2032
- Figure 15: North America Recovered Paper Industry Revenue Share (%), by Type 2024 & 2032
- Figure 16: North America Recovered Paper Industry Revenue (Million), by Country 2024 & 2032
- Figure 17: North America Recovered Paper Industry Revenue Share (%), by Country 2024 & 2032
- Figure 18: Europe Recovered Paper Industry Revenue (Million), by Type 2024 & 2032
- Figure 19: Europe Recovered Paper Industry Revenue Share (%), by Type 2024 & 2032
- Figure 20: Europe Recovered Paper Industry Revenue (Million), by Country 2024 & 2032
- Figure 21: Europe Recovered Paper Industry Revenue Share (%), by Country 2024 & 2032
- Figure 22: Asia Pacific Recovered Paper Industry Revenue (Million), by Type 2024 & 2032
- Figure 23: Asia Pacific Recovered Paper Industry Revenue Share (%), by Type 2024 & 2032
- Figure 24: Asia Pacific Recovered Paper Industry Revenue (Million), by Country 2024 & 2032
- Figure 25: Asia Pacific Recovered Paper Industry Revenue Share (%), by Country 2024 & 2032
- Figure 26: Latin America Recovered Paper Industry Revenue (Million), by Type 2024 & 2032
- Figure 27: Latin America Recovered Paper Industry Revenue Share (%), by Type 2024 & 2032
- Figure 28: Latin America Recovered Paper Industry Revenue (Million), by Country 2024 & 2032
- Figure 29: Latin America Recovered Paper Industry Revenue Share (%), by Country 2024 & 2032
- Figure 30: Middle East and Africa Recovered Paper Industry Revenue (Million), by Type 2024 & 2032
- Figure 31: Middle East and Africa Recovered Paper Industry Revenue Share (%), by Type 2024 & 2032
- Figure 32: Middle East and Africa Recovered Paper Industry Revenue (Million), by Country 2024 & 2032
- Figure 33: Middle East and Africa Recovered Paper Industry Revenue Share (%), by Country 2024 & 2032
List of Tables
- Table 1: Global Recovered Paper Industry Revenue Million Forecast, by Region 2019 & 2032
- Table 2: Global Recovered Paper Industry Revenue Million Forecast, by Type 2019 & 2032
- Table 3: Global Recovered Paper Industry Revenue Million Forecast, by Region 2019 & 2032
- Table 4: Global Recovered Paper Industry Revenue Million Forecast, by Country 2019 & 2032
- Table 5: United States Recovered Paper Industry Revenue (Million) Forecast, by Application 2019 & 2032
- Table 6: Canada Recovered Paper Industry Revenue (Million) Forecast, by Application 2019 & 2032
- Table 7: Mexico Recovered Paper Industry Revenue (Million) Forecast, by Application 2019 & 2032
- Table 8: Global Recovered Paper Industry Revenue Million Forecast, by Country 2019 & 2032
- Table 9: Germany Recovered Paper Industry Revenue (Million) Forecast, by Application 2019 & 2032
- Table 10: United Kingdom Recovered Paper Industry Revenue (Million) Forecast, by Application 2019 & 2032
- Table 11: France Recovered Paper Industry Revenue (Million) Forecast, by Application 2019 & 2032
- Table 12: Spain Recovered Paper Industry Revenue (Million) Forecast, by Application 2019 & 2032
- Table 13: Italy Recovered Paper Industry Revenue (Million) Forecast, by Application 2019 & 2032
- Table 14: Spain Recovered Paper Industry Revenue (Million) Forecast, by Application 2019 & 2032
- Table 15: Belgium Recovered Paper Industry Revenue (Million) Forecast, by Application 2019 & 2032
- Table 16: Netherland Recovered Paper Industry Revenue (Million) Forecast, by Application 2019 & 2032
- Table 17: Nordics Recovered Paper Industry Revenue (Million) Forecast, by Application 2019 & 2032
- Table 18: Rest of Europe Recovered Paper Industry Revenue (Million) Forecast, by Application 2019 & 2032
- Table 19: Global Recovered Paper Industry Revenue Million Forecast, by Country 2019 & 2032
- Table 20: China Recovered Paper Industry Revenue (Million) Forecast, by Application 2019 & 2032
- Table 21: Japan Recovered Paper Industry Revenue (Million) Forecast, by Application 2019 & 2032
- Table 22: India Recovered Paper Industry Revenue (Million) Forecast, by Application 2019 & 2032
- Table 23: South Korea Recovered Paper Industry Revenue (Million) Forecast, by Application 2019 & 2032
- Table 24: Southeast Asia Recovered Paper Industry Revenue (Million) Forecast, by Application 2019 & 2032
- Table 25: Australia Recovered Paper Industry Revenue (Million) Forecast, by Application 2019 & 2032
- Table 26: Indonesia Recovered Paper Industry Revenue (Million) Forecast, by Application 2019 & 2032
- Table 27: Phillipes Recovered Paper Industry Revenue (Million) Forecast, by Application 2019 & 2032
- Table 28: Singapore Recovered Paper Industry Revenue (Million) Forecast, by Application 2019 & 2032
- Table 29: Thailandc Recovered Paper Industry Revenue (Million) Forecast, by Application 2019 & 2032
- Table 30: Rest of Asia Pacific Recovered Paper Industry Revenue (Million) Forecast, by Application 2019 & 2032
- Table 31: Global Recovered Paper Industry Revenue Million Forecast, by Country 2019 & 2032
- Table 32: Brazil Recovered Paper Industry Revenue (Million) Forecast, by Application 2019 & 2032
- Table 33: Argentina Recovered Paper Industry Revenue (Million) Forecast, by Application 2019 & 2032
- Table 34: Peru Recovered Paper Industry Revenue (Million) Forecast, by Application 2019 & 2032
- Table 35: Chile Recovered Paper Industry Revenue (Million) Forecast, by Application 2019 & 2032
- Table 36: Colombia Recovered Paper Industry Revenue (Million) Forecast, by Application 2019 & 2032
- Table 37: Ecuador Recovered Paper Industry Revenue (Million) Forecast, by Application 2019 & 2032
- Table 38: Venezuela Recovered Paper Industry Revenue (Million) Forecast, by Application 2019 & 2032
- Table 39: Rest of South America Recovered Paper Industry Revenue (Million) Forecast, by Application 2019 & 2032
- Table 40: Global Recovered Paper Industry Revenue Million Forecast, by Country 2019 & 2032
- Table 41: United States Recovered Paper Industry Revenue (Million) Forecast, by Application 2019 & 2032
- Table 42: Canada Recovered Paper Industry Revenue (Million) Forecast, by Application 2019 & 2032
- Table 43: Mexico Recovered Paper Industry Revenue (Million) Forecast, by Application 2019 & 2032
- Table 44: Global Recovered Paper Industry Revenue Million Forecast, by Country 2019 & 2032
- Table 45: United Arab Emirates Recovered Paper Industry Revenue (Million) Forecast, by Application 2019 & 2032
- Table 46: Saudi Arabia Recovered Paper Industry Revenue (Million) Forecast, by Application 2019 & 2032
- Table 47: South Africa Recovered Paper Industry Revenue (Million) Forecast, by Application 2019 & 2032
- Table 48: Rest of Middle East and Africa Recovered Paper Industry Revenue (Million) Forecast, by Application 2019 & 2032
- Table 49: Global Recovered Paper Industry Revenue Million Forecast, by Type 2019 & 2032
- Table 50: Global Recovered Paper Industry Revenue Million Forecast, by Country 2019 & 2032
- Table 51: Global Recovered Paper Industry Revenue Million Forecast, by Type 2019 & 2032
- Table 52: Global Recovered Paper Industry Revenue Million Forecast, by Country 2019 & 2032
- Table 53: Global Recovered Paper Industry Revenue Million Forecast, by Type 2019 & 2032
- Table 54: Global Recovered Paper Industry Revenue Million Forecast, by Country 2019 & 2032
- Table 55: Global Recovered Paper Industry Revenue Million Forecast, by Type 2019 & 2032
- Table 56: Global Recovered Paper Industry Revenue Million Forecast, by Country 2019 & 2032
- Table 57: Global Recovered Paper Industry Revenue Million Forecast, by Type 2019 & 2032
- Table 58: Global Recovered Paper Industry Revenue Million Forecast, by Country 2019 & 2032
Frequently Asked Questions
1. What is the projected Compound Annual Growth Rate (CAGR) of the Recovered Paper Industry?
The projected CAGR is approximately 2.70%.
2. Which companies are prominent players in the Recovered Paper Industry?
Key companies in the market include International Paper, Tay Paper Recycling Pte Ltd, Smurfit Kappa Group plc, Nine Dragons Paper (Holdings) Limited, Stora Enso Oyj, S A Industrias Celulosa Aragonesa (SAICA), Visy Industrie, DS Smith Plc.
3. What are the main segments of the Recovered Paper Industry?
The market segments include Type.
4. Can you provide details about the market size?
The market size is estimated to be USD XX Million as of 2022.
5. What are some drivers contributing to market growth?
Growth in E-commerce Sales in China; Rising Demand from the Food-service Sector; Growing Consumer Awareness on Paper Packaging; Recycling Initiatives Involving Closed-loop Systems to Aid Market Adoption of Paper Packaging-based Materials.
6. What are the notable trends driving market growth?
Containerboard to Dominate the Market.
7. Are there any restraints impacting market growth?
Recycling. Raw Material Supply Chain Management. and Challenges in the Paper Packaging Industry; Effects of Deforestation on Paper Packaging; Increasing Raw Material Costs and Outsourcing.
8. Can you provide examples of recent developments in the market?
N/A
9. What pricing options are available for accessing the report?
Pricing options include single-user, multi-user, and enterprise licenses priced at USD 4750, USD 5250, and USD 8750 respectively.
10. Is the market size provided in terms of value or volume?
The market size is provided in terms of value, measured in Million.
11. Are there any specific market keywords associated with the report?
Yes, the market keyword associated with the report is "Recovered Paper Industry," which aids in identifying and referencing the specific market segment covered.
12. How do I determine which pricing option suits my needs best?
The pricing options vary based on user requirements and access needs. Individual users may opt for single-user licenses, while businesses requiring broader access may choose multi-user or enterprise licenses for cost-effective access to the report.
13. Are there any additional resources or data provided in the Recovered Paper Industry report?
While the report offers comprehensive insights, it's advisable to review the specific contents or supplementary materials provided to ascertain if additional resources or data are available.
14. How can I stay updated on further developments or reports in the Recovered Paper Industry?
To stay informed about further developments, trends, and reports in the Recovered Paper Industry, consider subscribing to industry newsletters, following relevant companies and organizations, or regularly checking reputable industry news sources and publications.
Methodology
Step 1 - Identification of Relevant Samples Size from Population Database


Step 2 - Approaches for Defining Global Market Size (Value, Volume* & Price*)

Note*: In applicable scenarios
Step 3 - Data Sources
Primary Research
- Web Analytics
- Survey Reports
- Research Institute
- Latest Research Reports
- Opinion Leaders
Secondary Research
- Annual Reports
- White Paper
- Latest Press Release
- Industry Association
- Paid Database
- Investor Presentations

Step 4 - Data Triangulation
Involves using different sources of information in order to increase the validity of a study
These sources are likely to be stakeholders in a program - participants, other researchers, program staff, other community members, and so on.
Then we put all data in single framework & apply various statistical tools to find out the dynamic on the market.
During the analysis stage, feedback from the stakeholder groups would be compared to determine areas of agreement as well as areas of divergence
