

Key Insights
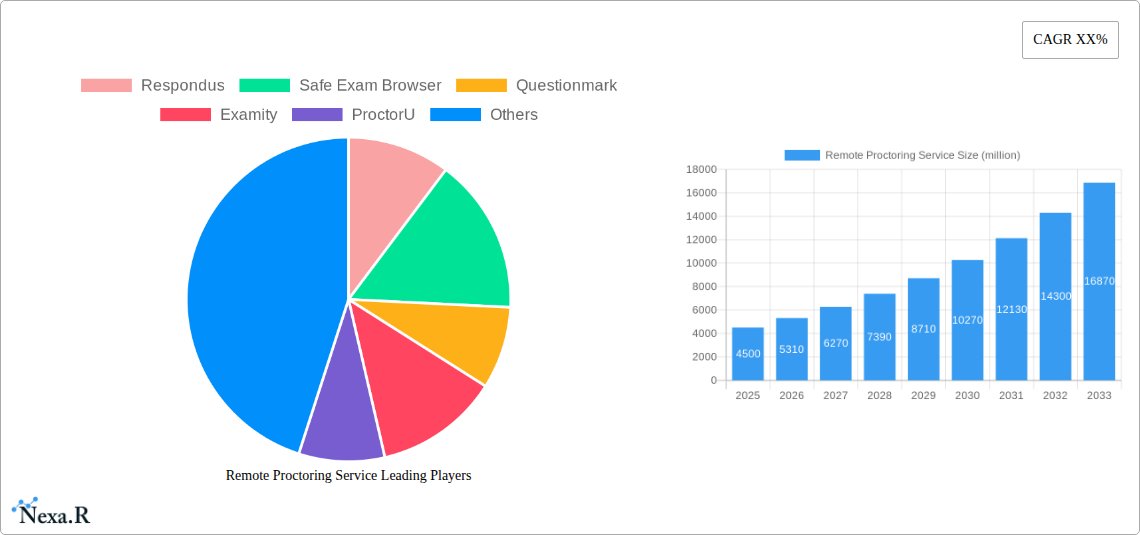
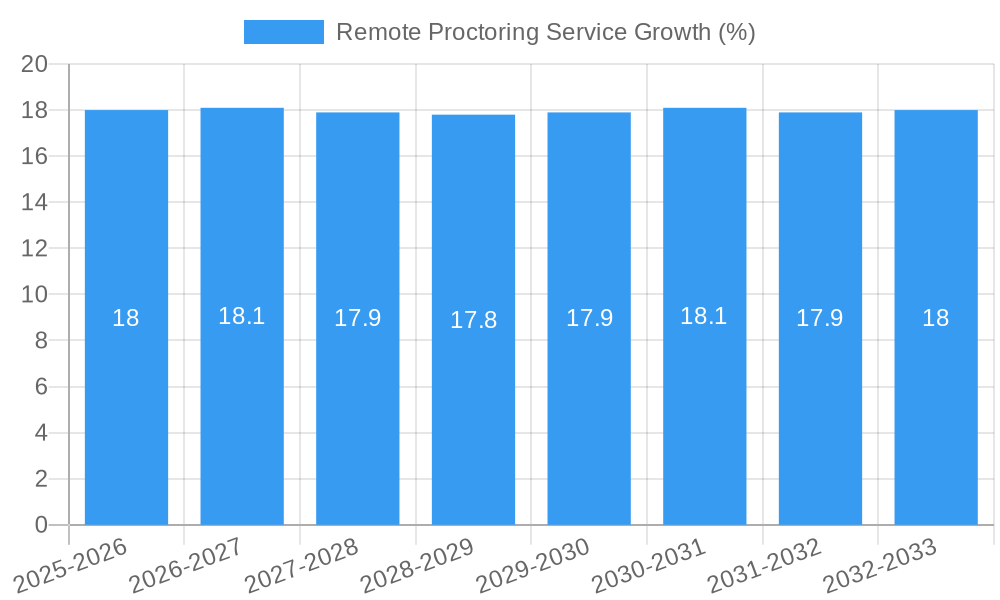
The global Remote Proctoring Service market is poised for significant expansion, projected to reach a substantial market size of approximately $4,500 million by 2025, with a robust Compound Annual Growth Rate (CAGR) of around 18% anticipated over the forecast period from 2025 to 2033. This dynamic growth is largely fueled by the escalating adoption of online learning and digital assessments across educational institutions and professional certification bodies. The imperative for academic integrity and the assurance of fair examination practices in a distributed learning environment have propelled the demand for sophisticated proctoring solutions. Key market drivers include the increasing prevalence of remote work and online education, a growing need for secure and scalable assessment solutions, and technological advancements in AI and machine learning that enhance the capabilities of automated proctoring systems. The market is segmented into Browser Lockdown Systems, Live Proctoring Solutions, and Automated Proctoring Solutions, with automated systems gaining considerable traction due to their cost-effectiveness and scalability for large-scale examinations.
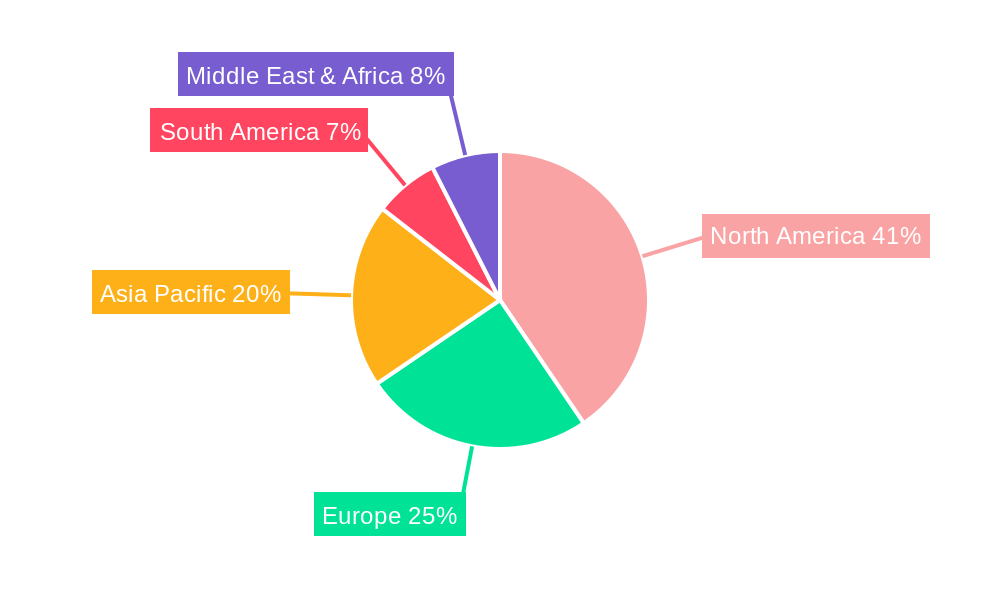
The market landscape is characterized by a competitive environment with prominent players like Respondus, Examity, and ProctorU driving innovation. The study period from 2019 to 2033, with a base year of 2025, indicates a strong historical growth trajectory that is expected to continue. While the market exhibits strong growth, certain restraints, such as concerns regarding data privacy and the potential for algorithmic bias in automated systems, need to be addressed by service providers. Geographically, North America, particularly the United States, currently holds a dominant market share, driven by early adoption and a mature online education ecosystem. However, the Asia Pacific region, with its rapidly expanding digital education infrastructure and a large student population, is expected to emerge as a high-growth market. Continued investment in R&D and strategic partnerships will be crucial for companies to maintain their competitive edge and capitalize on the evolving demands of the remote proctoring service market.
Remote Proctoring Service Market Report: Unlocking Digital Assessment Integrity
This comprehensive report delves into the dynamic Remote Proctoring Service market, providing critical insights for educational institutions, assessment providers, and technology vendors. Explore market trends, growth drivers, and competitive landscapes shaping the future of secure online examinations.
Remote Proctoring Service Market Dynamics & Structure
The global Remote Proctoring Service market exhibits a moderately concentrated structure, with key players like Respondus, Examity, and ProctorU holding significant influence. Technological innovation is a primary driver, fueled by the demand for robust, AI-powered automated proctoring solutions and sophisticated browser lockdown systems. Regulatory frameworks, particularly data privacy and academic integrity mandates, are increasingly shaping service offerings and implementation strategies. Competitive product substitutes include traditional in-person proctoring and lower-fidelity online assessment tools, though these are being outpaced by the comprehensive security and scalability of remote solutions. End-user demographics are expanding beyond traditional K-12 and higher education to include vocational training, professional certifications, and corporate onboarding, reflecting a broader shift towards digital learning and credentialing. Mergers and acquisitions (M&A) are becoming more prevalent as larger entities seek to consolidate market share and expand their technological capabilities, indicating a maturing industry.
- Market Concentration: Moderate, with top players dominating market share.
- Innovation Drivers: AI in automated proctoring, advanced browser lockdown, biometric authentication.
- Regulatory Influence: Data privacy (GDPR, CCPA), academic integrity policies, evolving accreditation standards.
- Competitive Landscape: Traditional proctoring, in-house assessment solutions, simpler online testing platforms.
- End-User Expansion: Higher Education, K-12, Vocational Education, Professional Certifications, Corporate Training.
- M&A Trends: Consolidation for expanded service portfolios and technological integration.
Remote Proctoring Service Growth Trends & Insights
The Remote Proctoring Service market is experiencing substantial growth, driven by the accelerated adoption of online education and the imperative for secure, verifiable digital assessments. The market size, which stood at an estimated $1,500 million in 2024, is projected to surge, reaching over $5,000 million by 2033, exhibiting a robust Compound Annual Growth Rate (CAGR) of approximately 15%. This upward trajectory is underpinned by increasing penetration rates in higher education institutions and vocational training centers, as they continue to expand their online course offerings and remote examination capabilities. Technological disruptions, such as the integration of Artificial Intelligence (AI) for anomaly detection, natural language processing for sentiment analysis during exams, and advanced facial recognition, are enhancing the accuracy and efficiency of proctoring solutions. Consumer behavior shifts are also playing a pivotal role; students and professionals increasingly expect flexible, accessible, and secure assessment methods that accommodate diverse learning and work environments. The pandemic acted as a significant catalyst, accelerating the transition to remote proctoring and solidifying its position as a mainstream assessment solution. Furthermore, the growing emphasis on academic integrity and the need to prevent cheating in high-stakes online examinations are compelling organizations to invest in sophisticated remote proctoring technologies. The market penetration for remote proctoring services is expected to exceed 70% in the higher education sector by the end of the forecast period. The ongoing evolution of AI algorithms and their ability to interpret complex human behaviors in real-time will continue to be a key differentiator, driving further market expansion and adoption.
Dominant Regions, Countries, or Segments in Remote Proctoring Service
The Schools & Universities segment, within the Application categorization, emerges as the dominant force in the global Remote Proctoring Service market, consistently driving significant growth and adoption. This dominance is attributed to several interconnected factors. The sheer scale of higher education institutions worldwide, coupled with the increasing shift towards blended and fully online learning models, necessitates robust and scalable remote assessment solutions. The market share for remote proctoring within the Schools & Universities segment is estimated to be over 65% of the total market revenue. North America, particularly the United States, stands out as a leading country in this segment due to early adoption of online learning technologies and substantial investments in educational infrastructure.
Key Drivers for Dominance in Schools & Universities:
- Accelerated Online Learning Adoption: Universities globally are expanding their online course portfolios, requiring secure remote examination capabilities.
- Academic Integrity Concerns: High-stakes degrees and certifications demand stringent measures to prevent academic dishonesty in online settings.
- Government and Institutional Funding: Increased allocation of budgets towards digital transformation in education.
- Technological Integration: Seamless integration of proctoring solutions with Learning Management Systems (LMS) like Canvas, Blackboard, and Moodle.
- Scalability and Flexibility: The ability to administer exams to a large and geographically dispersed student body efficiently.
Within the Types of remote proctoring, Live Proctoring Solutions currently hold a substantial market share, estimated at approximately 45%, due to their perceived comprehensiveness in human oversight. However, Automated Proctoring Solutions, powered by AI, are experiencing rapid growth and are projected to overtake live proctoring in the coming years, boasting a CAGR of over 18%. The combination of live and automated proctoring, often referred to as hybrid solutions, is also gaining traction, offering a balanced approach to security and cost-effectiveness.
Dominant Countries & Regions:
- North America (especially USA): Early adopter, strong investment in EdTech, established infrastructure.
- Europe: Growing adoption driven by government initiatives for digital education and increasing online course offerings.
- Asia-Pacific: Rapidly expanding market with increasing internet penetration and a growing demand for quality online education.
The continuous innovation in AI and the drive for cost-efficiency are propelling the growth of automated and hybrid solutions, further solidifying the market's expansion across educational applications worldwide.
Remote Proctoring Service Product Landscape
The product landscape of remote proctoring services is characterized by continuous innovation aimed at enhancing security, user experience, and efficiency. Leading solutions offer sophisticated browser lockdown capabilities, preventing unauthorized access to external websites or applications during exams. Live proctoring solutions provide real-time human oversight, ensuring adherence to exam protocols. Automated proctoring solutions leverage AI for facial recognition, voice analysis, and keystroke monitoring, flagging suspicious activities for review. Companies are also developing integrated platforms that combine multiple proctoring modalities, offering customizable security levels. Innovations include advanced plagiarism detection, AI-powered essay scoring, and seamless integration with various Learning Management Systems, thereby providing a holistic and secure digital assessment ecosystem.
Key Drivers, Barriers & Challenges in Remote Proctoring Service
Key Drivers:
- Rising demand for online education: The surge in e-learning necessitates secure and credible assessment methods.
- Technological advancements: AI and machine learning are improving the accuracy and efficiency of automated proctoring.
- Global academic integrity concerns: Increasing focus on preventing cheating in online assessments.
- Cost-effectiveness and scalability: Remote proctoring offers a more economical and scalable solution compared to traditional methods.
- Government and institutional support: Initiatives promoting digital transformation in education.
Barriers & Challenges:
- Privacy concerns: Handling sensitive student data requires robust security and compliance measures, estimated to impact market adoption by 10-15% if not addressed.
- Technological disparities: Unequal access to reliable internet and compatible hardware among students can create a digital divide, potentially limiting reach by 5-10%.
- Cost of implementation: Initial investment in sophisticated proctoring systems can be a barrier for smaller institutions.
- User acceptance and training: Ensuring educators and students are comfortable and proficient with new technologies.
- Evolving cheating methods: Constant need to adapt proctoring technologies to counter new sophisticated cheating techniques.
- Regulatory compliance: Navigating diverse international data protection laws.
Emerging Opportunities in Remote Proctoring Service
Emerging opportunities lie in the expansion of remote proctoring to new sectors beyond traditional education, such as corporate compliance training, professional licensing exams, and high-stakes standardized testing for job recruitment. The development of more sophisticated AI algorithms that can accurately detect subtle indicators of academic dishonesty with minimal false positives presents a significant opportunity. Furthermore, offering hybrid proctoring models that combine the strengths of human oversight with AI efficiency is becoming increasingly desirable. The integration of biometric authentication technologies like fingerprint or iris scans for enhanced identity verification represents another promising avenue. Untapped markets in developing economies with growing online education footprints also offer substantial growth potential.
Growth Accelerators in the Remote Proctoring Service Industry
The remote proctoring industry is experiencing robust growth fueled by several key accelerators. The increasing reliance on AI and machine learning for sophisticated anomaly detection and behavioral analysis is a major catalyst, enhancing the efficacy and scalability of automated solutions. Strategic partnerships between proctoring service providers and Learning Management System (LMS) developers are streamlining integration, making adoption more seamless for educational institutions. Furthermore, the growing demand for specialized proctoring solutions tailored to specific disciplines or exam formats, such as coding tests or language proficiency assessments, is driving market expansion. The continuous drive for cost optimization through advanced automation is also making these services more accessible to a wider range of institutions.
Key Players Shaping the Remote Proctoring Service Market
- Respondus
- Safe Exam Browser
- Questionmark
- Examity
- ProctorU
- PSI Services
- BVirtual
- Kryterion
- Loyalist Exam Services
- ProctorExam
- Comprobo
- Honorlock
- ProctorFree
Notable Milestones in Remote Proctoring Service Sector
- 2019: Increased integration of AI in automated proctoring solutions for enhanced efficiency and accuracy.
- 2020: Unprecedented surge in demand and adoption due to the global shift to remote learning.
- 2021: Introduction of advanced biometric authentication methods for stronger identity verification.
- 2022: Expansion of hybrid proctoring models combining live and automated proctoring.
- 2023: Enhanced data security protocols and compliance with evolving global privacy regulations.
- 2024: Focus on AI-driven analytics for deeper insights into student behavior and assessment integrity.
In-Depth Remote Proctoring Service Market Outlook
The remote proctoring service market is poised for sustained growth, driven by the irreversible trend towards digital education and the paramount importance of academic integrity. AI-powered automated proctoring solutions will continue to mature, offering greater accuracy and efficiency, while hybrid models will cater to diverse institutional needs. Strategic collaborations with EdTech providers and a focus on user experience will be critical for market leadership. The expanding application in vocational training and professional certifications indicates a diversification of revenue streams. Emerging markets in Asia-Pacific and Latin America present significant untapped potential, further accelerating overall industry expansion. The market outlook remains exceptionally strong, with continuous innovation ensuring its relevance in the evolving educational and assessment landscape.
Remote Proctoring Service Segmentation
-
1. Application
- 1.1. Schools & Universities
- 1.2. Vocational Education
- 1.3. Others
-
2. Types
- 2.1. Browser Lockdown Systems
- 2.2. Live Proctoring Solutions
- 2.3. Automated Proctoring Solutions
Remote Proctoring Service Segmentation By Geography
-
1. North America
- 1.1. United States
- 1.2. Canada
- 1.3. Mexico
-
2. South America
- 2.1. Brazil
- 2.2. Argentina
- 2.3. Rest of South America
-
3. Europe
- 3.1. United Kingdom
- 3.2. Germany
- 3.3. France
- 3.4. Italy
- 3.5. Spain
- 3.6. Russia
- 3.7. Benelux
- 3.8. Nordics
- 3.9. Rest of Europe
-
4. Middle East & Africa
- 4.1. Turkey
- 4.2. Israel
- 4.3. GCC
- 4.4. North Africa
- 4.5. South Africa
- 4.6. Rest of Middle East & Africa
-
5. Asia Pacific
- 5.1. China
- 5.2. India
- 5.3. Japan
- 5.4. South Korea
- 5.5. ASEAN
- 5.6. Oceania
- 5.7. Rest of Asia Pacific
Remote Proctoring Service REPORT HIGHLIGHTS
| Aspects | Details |
|---|---|
| Study Period | 2019-2033 |
| Base Year | 2024 |
| Estimated Year | 2025 |
| Forecast Period | 2025-2033 |
| Historical Period | 2019-2024 |
| Growth Rate | CAGR of XX% from 2019-2033 |
| Segmentation |
|
Table of Contents
- 1. Introduction
- 1.1. Research Scope
- 1.2. Market Segmentation
- 1.3. Research Methodology
- 1.4. Definitions and Assumptions
- 2. Executive Summary
- 2.1. Introduction
- 3. Market Dynamics
- 3.1. Introduction
- 3.2. Market Drivers
- 3.3. Market Restrains
- 3.4. Market Trends
- 4. Market Factor Analysis
- 4.1. Porters Five Forces
- 4.2. Supply/Value Chain
- 4.3. PESTEL analysis
- 4.4. Market Entropy
- 4.5. Patent/Trademark Analysis
- 5. Global Remote Proctoring Service Analysis, Insights and Forecast, 2019-2031
- 5.1. Market Analysis, Insights and Forecast - by Application
- 5.1.1. Schools & Universities
- 5.1.2. Vocational Education
- 5.1.3. Others
- 5.2. Market Analysis, Insights and Forecast - by Types
- 5.2.1. Browser Lockdown Systems
- 5.2.2. Live Proctoring Solutions
- 5.2.3. Automated Proctoring Solutions
- 5.3. Market Analysis, Insights and Forecast - by Region
- 5.3.1. North America
- 5.3.2. South America
- 5.3.3. Europe
- 5.3.4. Middle East & Africa
- 5.3.5. Asia Pacific
- 5.1. Market Analysis, Insights and Forecast - by Application
- 6. North America Remote Proctoring Service Analysis, Insights and Forecast, 2019-2031
- 6.1. Market Analysis, Insights and Forecast - by Application
- 6.1.1. Schools & Universities
- 6.1.2. Vocational Education
- 6.1.3. Others
- 6.2. Market Analysis, Insights and Forecast - by Types
- 6.2.1. Browser Lockdown Systems
- 6.2.2. Live Proctoring Solutions
- 6.2.3. Automated Proctoring Solutions
- 6.1. Market Analysis, Insights and Forecast - by Application
- 7. South America Remote Proctoring Service Analysis, Insights and Forecast, 2019-2031
- 7.1. Market Analysis, Insights and Forecast - by Application
- 7.1.1. Schools & Universities
- 7.1.2. Vocational Education
- 7.1.3. Others
- 7.2. Market Analysis, Insights and Forecast - by Types
- 7.2.1. Browser Lockdown Systems
- 7.2.2. Live Proctoring Solutions
- 7.2.3. Automated Proctoring Solutions
- 7.1. Market Analysis, Insights and Forecast - by Application
- 8. Europe Remote Proctoring Service Analysis, Insights and Forecast, 2019-2031
- 8.1. Market Analysis, Insights and Forecast - by Application
- 8.1.1. Schools & Universities
- 8.1.2. Vocational Education
- 8.1.3. Others
- 8.2. Market Analysis, Insights and Forecast - by Types
- 8.2.1. Browser Lockdown Systems
- 8.2.2. Live Proctoring Solutions
- 8.2.3. Automated Proctoring Solutions
- 8.1. Market Analysis, Insights and Forecast - by Application
- 9. Middle East & Africa Remote Proctoring Service Analysis, Insights and Forecast, 2019-2031
- 9.1. Market Analysis, Insights and Forecast - by Application
- 9.1.1. Schools & Universities
- 9.1.2. Vocational Education
- 9.1.3. Others
- 9.2. Market Analysis, Insights and Forecast - by Types
- 9.2.1. Browser Lockdown Systems
- 9.2.2. Live Proctoring Solutions
- 9.2.3. Automated Proctoring Solutions
- 9.1. Market Analysis, Insights and Forecast - by Application
- 10. Asia Pacific Remote Proctoring Service Analysis, Insights and Forecast, 2019-2031
- 10.1. Market Analysis, Insights and Forecast - by Application
- 10.1.1. Schools & Universities
- 10.1.2. Vocational Education
- 10.1.3. Others
- 10.2. Market Analysis, Insights and Forecast - by Types
- 10.2.1. Browser Lockdown Systems
- 10.2.2. Live Proctoring Solutions
- 10.2.3. Automated Proctoring Solutions
- 10.1. Market Analysis, Insights and Forecast - by Application
- 11. Competitive Analysis
- 11.1. Global Market Share Analysis 2024
- 11.2. Company Profiles
- 11.2.1 Respondus
- 11.2.1.1. Overview
- 11.2.1.2. Products
- 11.2.1.3. SWOT Analysis
- 11.2.1.4. Recent Developments
- 11.2.1.5. Financials (Based on Availability)
- 11.2.2 Safe Exam Browser
- 11.2.2.1. Overview
- 11.2.2.2. Products
- 11.2.2.3. SWOT Analysis
- 11.2.2.4. Recent Developments
- 11.2.2.5. Financials (Based on Availability)
- 11.2.3 Questionmark
- 11.2.3.1. Overview
- 11.2.3.2. Products
- 11.2.3.3. SWOT Analysis
- 11.2.3.4. Recent Developments
- 11.2.3.5. Financials (Based on Availability)
- 11.2.4 Examity
- 11.2.4.1. Overview
- 11.2.4.2. Products
- 11.2.4.3. SWOT Analysis
- 11.2.4.4. Recent Developments
- 11.2.4.5. Financials (Based on Availability)
- 11.2.5 ProctorU
- 11.2.5.1. Overview
- 11.2.5.2. Products
- 11.2.5.3. SWOT Analysis
- 11.2.5.4. Recent Developments
- 11.2.5.5. Financials (Based on Availability)
- 11.2.6 PSI Services
- 11.2.6.1. Overview
- 11.2.6.2. Products
- 11.2.6.3. SWOT Analysis
- 11.2.6.4. Recent Developments
- 11.2.6.5. Financials (Based on Availability)
- 11.2.7 BVirtual
- 11.2.7.1. Overview
- 11.2.7.2. Products
- 11.2.7.3. SWOT Analysis
- 11.2.7.4. Recent Developments
- 11.2.7.5. Financials (Based on Availability)
- 11.2.8 Kryterion
- 11.2.8.1. Overview
- 11.2.8.2. Products
- 11.2.8.3. SWOT Analysis
- 11.2.8.4. Recent Developments
- 11.2.8.5. Financials (Based on Availability)
- 11.2.9 Loyalist Exam Services
- 11.2.9.1. Overview
- 11.2.9.2. Products
- 11.2.9.3. SWOT Analysis
- 11.2.9.4. Recent Developments
- 11.2.9.5. Financials (Based on Availability)
- 11.2.10 ProctorExam
- 11.2.10.1. Overview
- 11.2.10.2. Products
- 11.2.10.3. SWOT Analysis
- 11.2.10.4. Recent Developments
- 11.2.10.5. Financials (Based on Availability)
- 11.2.11 Comprobo
- 11.2.11.1. Overview
- 11.2.11.2. Products
- 11.2.11.3. SWOT Analysis
- 11.2.11.4. Recent Developments
- 11.2.11.5. Financials (Based on Availability)
- 11.2.12 Honorlock
- 11.2.12.1. Overview
- 11.2.12.2. Products
- 11.2.12.3. SWOT Analysis
- 11.2.12.4. Recent Developments
- 11.2.12.5. Financials (Based on Availability)
- 11.2.13 ProctorFree
- 11.2.13.1. Overview
- 11.2.13.2. Products
- 11.2.13.3. SWOT Analysis
- 11.2.13.4. Recent Developments
- 11.2.13.5. Financials (Based on Availability)
- 11.2.1 Respondus
List of Figures
- Figure 1: Global Remote Proctoring Service Revenue Breakdown (million, %) by Region 2024 & 2032
- Figure 2: North America Remote Proctoring Service Revenue (million), by Application 2024 & 2032
- Figure 3: North America Remote Proctoring Service Revenue Share (%), by Application 2024 & 2032
- Figure 4: North America Remote Proctoring Service Revenue (million), by Types 2024 & 2032
- Figure 5: North America Remote Proctoring Service Revenue Share (%), by Types 2024 & 2032
- Figure 6: North America Remote Proctoring Service Revenue (million), by Country 2024 & 2032
- Figure 7: North America Remote Proctoring Service Revenue Share (%), by Country 2024 & 2032
- Figure 8: South America Remote Proctoring Service Revenue (million), by Application 2024 & 2032
- Figure 9: South America Remote Proctoring Service Revenue Share (%), by Application 2024 & 2032
- Figure 10: South America Remote Proctoring Service Revenue (million), by Types 2024 & 2032
- Figure 11: South America Remote Proctoring Service Revenue Share (%), by Types 2024 & 2032
- Figure 12: South America Remote Proctoring Service Revenue (million), by Country 2024 & 2032
- Figure 13: South America Remote Proctoring Service Revenue Share (%), by Country 2024 & 2032
- Figure 14: Europe Remote Proctoring Service Revenue (million), by Application 2024 & 2032
- Figure 15: Europe Remote Proctoring Service Revenue Share (%), by Application 2024 & 2032
- Figure 16: Europe Remote Proctoring Service Revenue (million), by Types 2024 & 2032
- Figure 17: Europe Remote Proctoring Service Revenue Share (%), by Types 2024 & 2032
- Figure 18: Europe Remote Proctoring Service Revenue (million), by Country 2024 & 2032
- Figure 19: Europe Remote Proctoring Service Revenue Share (%), by Country 2024 & 2032
- Figure 20: Middle East & Africa Remote Proctoring Service Revenue (million), by Application 2024 & 2032
- Figure 21: Middle East & Africa Remote Proctoring Service Revenue Share (%), by Application 2024 & 2032
- Figure 22: Middle East & Africa Remote Proctoring Service Revenue (million), by Types 2024 & 2032
- Figure 23: Middle East & Africa Remote Proctoring Service Revenue Share (%), by Types 2024 & 2032
- Figure 24: Middle East & Africa Remote Proctoring Service Revenue (million), by Country 2024 & 2032
- Figure 25: Middle East & Africa Remote Proctoring Service Revenue Share (%), by Country 2024 & 2032
- Figure 26: Asia Pacific Remote Proctoring Service Revenue (million), by Application 2024 & 2032
- Figure 27: Asia Pacific Remote Proctoring Service Revenue Share (%), by Application 2024 & 2032
- Figure 28: Asia Pacific Remote Proctoring Service Revenue (million), by Types 2024 & 2032
- Figure 29: Asia Pacific Remote Proctoring Service Revenue Share (%), by Types 2024 & 2032
- Figure 30: Asia Pacific Remote Proctoring Service Revenue (million), by Country 2024 & 2032
- Figure 31: Asia Pacific Remote Proctoring Service Revenue Share (%), by Country 2024 & 2032
List of Tables
- Table 1: Global Remote Proctoring Service Revenue million Forecast, by Region 2019 & 2032
- Table 2: Global Remote Proctoring Service Revenue million Forecast, by Application 2019 & 2032
- Table 3: Global Remote Proctoring Service Revenue million Forecast, by Types 2019 & 2032
- Table 4: Global Remote Proctoring Service Revenue million Forecast, by Region 2019 & 2032
- Table 5: Global Remote Proctoring Service Revenue million Forecast, by Application 2019 & 2032
- Table 6: Global Remote Proctoring Service Revenue million Forecast, by Types 2019 & 2032
- Table 7: Global Remote Proctoring Service Revenue million Forecast, by Country 2019 & 2032
- Table 8: United States Remote Proctoring Service Revenue (million) Forecast, by Application 2019 & 2032
- Table 9: Canada Remote Proctoring Service Revenue (million) Forecast, by Application 2019 & 2032
- Table 10: Mexico Remote Proctoring Service Revenue (million) Forecast, by Application 2019 & 2032
- Table 11: Global Remote Proctoring Service Revenue million Forecast, by Application 2019 & 2032
- Table 12: Global Remote Proctoring Service Revenue million Forecast, by Types 2019 & 2032
- Table 13: Global Remote Proctoring Service Revenue million Forecast, by Country 2019 & 2032
- Table 14: Brazil Remote Proctoring Service Revenue (million) Forecast, by Application 2019 & 2032
- Table 15: Argentina Remote Proctoring Service Revenue (million) Forecast, by Application 2019 & 2032
- Table 16: Rest of South America Remote Proctoring Service Revenue (million) Forecast, by Application 2019 & 2032
- Table 17: Global Remote Proctoring Service Revenue million Forecast, by Application 2019 & 2032
- Table 18: Global Remote Proctoring Service Revenue million Forecast, by Types 2019 & 2032
- Table 19: Global Remote Proctoring Service Revenue million Forecast, by Country 2019 & 2032
- Table 20: United Kingdom Remote Proctoring Service Revenue (million) Forecast, by Application 2019 & 2032
- Table 21: Germany Remote Proctoring Service Revenue (million) Forecast, by Application 2019 & 2032
- Table 22: France Remote Proctoring Service Revenue (million) Forecast, by Application 2019 & 2032
- Table 23: Italy Remote Proctoring Service Revenue (million) Forecast, by Application 2019 & 2032
- Table 24: Spain Remote Proctoring Service Revenue (million) Forecast, by Application 2019 & 2032
- Table 25: Russia Remote Proctoring Service Revenue (million) Forecast, by Application 2019 & 2032
- Table 26: Benelux Remote Proctoring Service Revenue (million) Forecast, by Application 2019 & 2032
- Table 27: Nordics Remote Proctoring Service Revenue (million) Forecast, by Application 2019 & 2032
- Table 28: Rest of Europe Remote Proctoring Service Revenue (million) Forecast, by Application 2019 & 2032
- Table 29: Global Remote Proctoring Service Revenue million Forecast, by Application 2019 & 2032
- Table 30: Global Remote Proctoring Service Revenue million Forecast, by Types 2019 & 2032
- Table 31: Global Remote Proctoring Service Revenue million Forecast, by Country 2019 & 2032
- Table 32: Turkey Remote Proctoring Service Revenue (million) Forecast, by Application 2019 & 2032
- Table 33: Israel Remote Proctoring Service Revenue (million) Forecast, by Application 2019 & 2032
- Table 34: GCC Remote Proctoring Service Revenue (million) Forecast, by Application 2019 & 2032
- Table 35: North Africa Remote Proctoring Service Revenue (million) Forecast, by Application 2019 & 2032
- Table 36: South Africa Remote Proctoring Service Revenue (million) Forecast, by Application 2019 & 2032
- Table 37: Rest of Middle East & Africa Remote Proctoring Service Revenue (million) Forecast, by Application 2019 & 2032
- Table 38: Global Remote Proctoring Service Revenue million Forecast, by Application 2019 & 2032
- Table 39: Global Remote Proctoring Service Revenue million Forecast, by Types 2019 & 2032
- Table 40: Global Remote Proctoring Service Revenue million Forecast, by Country 2019 & 2032
- Table 41: China Remote Proctoring Service Revenue (million) Forecast, by Application 2019 & 2032
- Table 42: India Remote Proctoring Service Revenue (million) Forecast, by Application 2019 & 2032
- Table 43: Japan Remote Proctoring Service Revenue (million) Forecast, by Application 2019 & 2032
- Table 44: South Korea Remote Proctoring Service Revenue (million) Forecast, by Application 2019 & 2032
- Table 45: ASEAN Remote Proctoring Service Revenue (million) Forecast, by Application 2019 & 2032
- Table 46: Oceania Remote Proctoring Service Revenue (million) Forecast, by Application 2019 & 2032
- Table 47: Rest of Asia Pacific Remote Proctoring Service Revenue (million) Forecast, by Application 2019 & 2032
Frequently Asked Questions
1. What is the projected Compound Annual Growth Rate (CAGR) of the Remote Proctoring Service?
The projected CAGR is approximately XX%.
2. Which companies are prominent players in the Remote Proctoring Service?
Key companies in the market include Respondus, Safe Exam Browser, Questionmark, Examity, ProctorU, PSI Services, BVirtual, Kryterion, Loyalist Exam Services, ProctorExam, Comprobo, Honorlock, ProctorFree.
3. What are the main segments of the Remote Proctoring Service?
The market segments include Application, Types.
4. Can you provide details about the market size?
The market size is estimated to be USD XXX million as of 2022.
5. What are some drivers contributing to market growth?
N/A
6. What are the notable trends driving market growth?
N/A
7. Are there any restraints impacting market growth?
N/A
8. Can you provide examples of recent developments in the market?
N/A
9. What pricing options are available for accessing the report?
Pricing options include single-user, multi-user, and enterprise licenses priced at USD 2900.00, USD 4350.00, and USD 5800.00 respectively.
10. Is the market size provided in terms of value or volume?
The market size is provided in terms of value, measured in million.
11. Are there any specific market keywords associated with the report?
Yes, the market keyword associated with the report is "Remote Proctoring Service," which aids in identifying and referencing the specific market segment covered.
12. How do I determine which pricing option suits my needs best?
The pricing options vary based on user requirements and access needs. Individual users may opt for single-user licenses, while businesses requiring broader access may choose multi-user or enterprise licenses for cost-effective access to the report.
13. Are there any additional resources or data provided in the Remote Proctoring Service report?
While the report offers comprehensive insights, it's advisable to review the specific contents or supplementary materials provided to ascertain if additional resources or data are available.
14. How can I stay updated on further developments or reports in the Remote Proctoring Service?
To stay informed about further developments, trends, and reports in the Remote Proctoring Service, consider subscribing to industry newsletters, following relevant companies and organizations, or regularly checking reputable industry news sources and publications.
Methodology
Step 1 - Identification of Relevant Samples Size from Population Database


Step 2 - Approaches for Defining Global Market Size (Value, Volume* & Price*)

Note*: In applicable scenarios
Step 3 - Data Sources
Primary Research
- Web Analytics
- Survey Reports
- Research Institute
- Latest Research Reports
- Opinion Leaders
Secondary Research
- Annual Reports
- White Paper
- Latest Press Release
- Industry Association
- Paid Database
- Investor Presentations

Step 4 - Data Triangulation
Involves using different sources of information in order to increase the validity of a study
These sources are likely to be stakeholders in a program - participants, other researchers, program staff, other community members, and so on.
Then we put all data in single framework & apply various statistical tools to find out the dynamic on the market.
During the analysis stage, feedback from the stakeholder groups would be compared to determine areas of agreement as well as areas of divergence
