

Key Insights
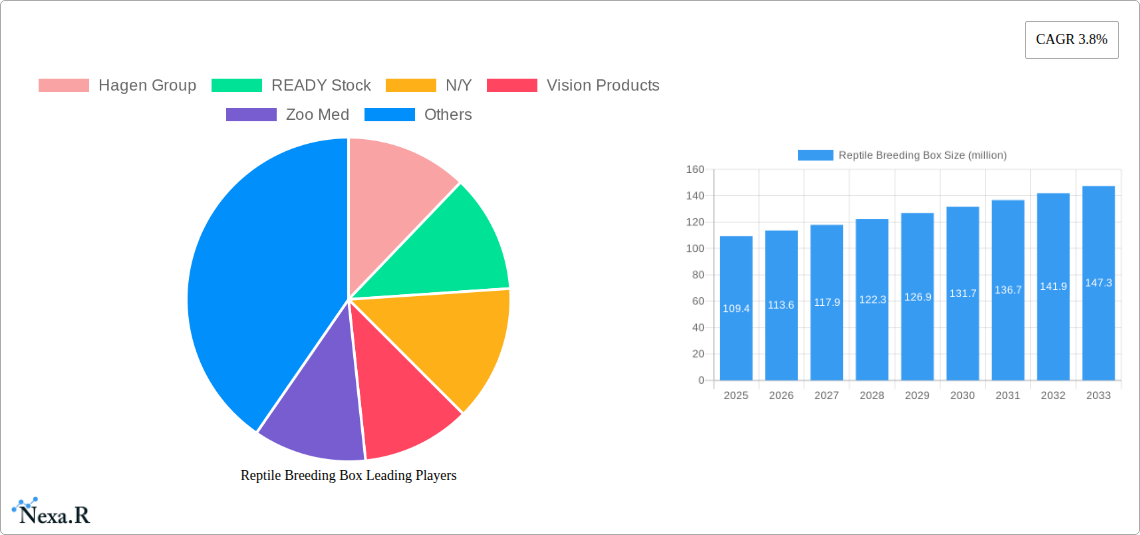
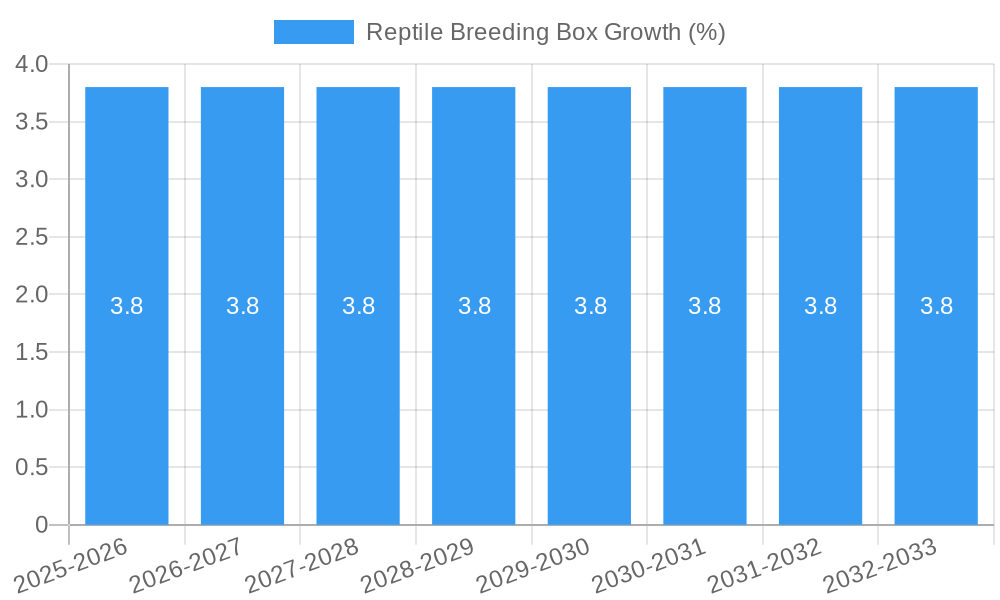
The global Reptile Breeding Box market is poised for steady expansion, projected to reach a significant valuation with a Compound Annual Growth Rate (CAGR) of 3.8% between 2025 and 2033. This growth is fueled by a confluence of factors, including the escalating popularity of reptile keeping as a hobby, driven by their unique appeal and perceived low maintenance compared to traditional pets. The increasing adoption of advanced breeding techniques and a growing understanding of reptile husbandry among enthusiasts are also contributing to market demand. Furthermore, the expansion of online retail channels and specialized pet supply stores has made these essential breeding enclosures more accessible to a wider consumer base. The market's value is currently estimated at approximately $109.4 million, with expectations to see a consistent upward trajectory in the coming years.
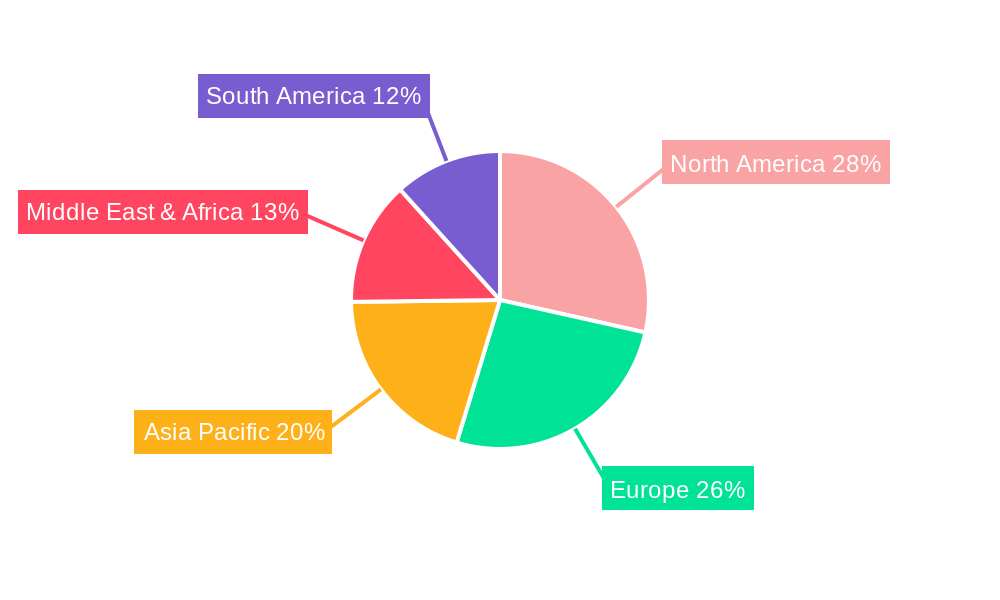
The market is segmented by application into Supermarkets, Pet Stores, Household, and Others. Pet stores and household applications are anticipated to represent the largest share, reflecting the primary consumer base for reptile breeding boxes. By type, the market is categorized into Large Breeding Boxes (Above 100cm), Medium Breeding Boxes (50-100cm), and Small Breeding Boxes (Below 50cm). The demand for medium and large breeding boxes is expected to grow robustly as more hobbyists invest in creating optimal environments for their reptiles, including breeding pairs. Key players such as Hagen Group, Zoo Med, and Vision Products are actively innovating and expanding their product portfolios to cater to evolving consumer needs. Regional analysis indicates strong market presence in North America and Europe, with emerging markets in Asia Pacific showing promising growth potential due to increasing disposable incomes and a rising interest in exotic pets.
Reptile Breeding Box Market Report: Comprehensive Analysis and Future Outlook (2019–2033)
This in-depth report provides a comprehensive analysis of the global Reptile Breeding Box market, covering market dynamics, growth trends, regional dominance, product landscape, key players, and future outlook. With a study period spanning from 2019 to 2033, and the base year set at 2025, this report offers valuable insights for industry professionals, manufacturers, and investors.
Reptile Breeding Box Market Dynamics & Structure
The global Reptile Breeding Box market exhibits a moderately concentrated structure, with a few prominent players holding significant market share. Hagen Group, Vision Products, and Zoo Med are key contributors to this landscape. Technological innovation is a significant driver, with advancements focusing on enhanced ventilation, temperature control, and user-friendly designs to improve reptile welfare and breeding success. Regulatory frameworks, particularly those concerning animal welfare and biosecurity, play a crucial role in shaping product development and market entry. Competitive product substitutes include DIY solutions and repurposed containers, although specialized breeding boxes offer superior functionality and controlled environments.
- Market Concentration: Dominated by established brands, but with increasing opportunities for niche players.
- Technological Innovation: Focus on smart features, automated systems, and sustainable materials.
- Regulatory Frameworks: Evolving standards for reptile housing and health impacting product design.
- Competitive Product Substitutes: DIY solutions and general pet enclosures present a competitive challenge.
- End-User Demographics: Growing segment of hobbyists, professional breeders, and zoological institutions.
- M&A Trends: Potential for consolidation to leverage economies of scale and expand product portfolios.
Reptile Breeding Box Growth Trends & Insights
The Reptile Breeding Box market is poised for substantial growth, projected to reach over 700 million units by 2033. This expansion is fueled by a confluence of rising pet ownership, particularly of exotic reptiles, and the increasing professionalization of reptile breeding. The market penetration of specialized reptile breeding boxes is set to surge, driven by a growing awareness among owners and breeders about the critical importance of providing optimal environments for reproduction and juvenile development. Technological disruptions are also playing a pivotal role, with innovations such as integrated heating, humidity control, and advanced ventilation systems becoming increasingly common. Consumer behavior is shifting towards a greater emphasis on animal welfare, leading to a higher demand for high-quality, purpose-built breeding solutions.
The compound annual growth rate (CAGR) for the Reptile Breeding Box market is estimated to be around 6.8% from 2025 to 2033. This growth trajectory is supported by several key factors. Firstly, the burgeoning reptile pet industry, fueled by social media trends and a desire for unique pets, directly translates into increased demand for breeding equipment. Secondly, advancements in material science are leading to more durable, lightweight, and cost-effective breeding box designs. Thirdly, the expanding online retail channel provides wider accessibility to these products, reaching a global consumer base. The market is also witnessing a rise in smart breeding boxes that offer remote monitoring capabilities and automated environmental controls, appealing to tech-savvy breeders and hobbyists seeking convenience and precision.
Looking at the historical period of 2019–2024, the market experienced steady growth, with an estimated market size of over 450 million units in 2024. This period saw the initial emergence of more sophisticated breeding solutions beyond basic enclosures. The forecast period (2025–2033) anticipates an acceleration in this growth, driven by increased investment in research and development by leading companies and a growing recognition of the specialized needs of various reptile species. The adoption of eco-friendly and sustainable materials in manufacturing is also an emerging trend that will influence market dynamics, appealing to environmentally conscious consumers.
Dominant Regions, Countries, or Segments in Reptile Breeding Box
North America and Europe currently lead the global Reptile Breeding Box market, driven by high disposable incomes, established pet care industries, and a significant population of reptile enthusiasts and professional breeders. Within these regions, the Pet store segment is the dominant application, accounting for an estimated 45% market share. This is attributed to the accessibility of specialized reptile products in dedicated pet stores and the role these stores play in educating new owners about proper reptile care and breeding. The Household segment also holds a substantial share, estimated at 30%, as more individuals incorporate reptiles into their homes.
The Medium Breeding Box (50-100cm) segment is a key driver of market growth, representing approximately 40% of the market share. These sizes are versatile and cater to a wide range of popular reptile species, from small to medium-sized snakes and lizards, making them a popular choice for both hobbyists and intermediate breeders. The demand for Large Breeding Boxes (Above 100cm) is growing at a faster pace due to the increasing popularity of larger reptile species like pythons and monitor lizards, though it currently holds a smaller market share of around 20%. Small Breeding Boxes (Below 50cm), primarily used for incubation and very young juveniles, constitute the remaining 40% of the market.
Asia-Pacific is emerging as a rapidly growing region, with countries like China and Japan witnessing significant increases in reptile ownership and breeding activities. Economic policies supporting the pet industry and a growing middle class with increased spending power on pet care are contributing factors. Infrastructure development for specialized pet retail outlets and online distribution networks further bolsters market expansion in this region. The growing trend of keeping exotic pets in urban environments, coupled with advancements in breeding technology, is expected to propel the Reptile Breeding Box market in Asia-Pacific to achieve a CAGR of over 7.5% during the forecast period.
Key drivers of dominance in these regions include:
- Strong Pet Culture: A deeply ingrained culture of pet ownership and a growing interest in exotic pets.
- Advanced Retail Infrastructure: Well-established pet store chains and robust e-commerce platforms.
- High Disposable Income: Enabling consumers to invest in premium pet care products.
- Technological Adoption: Early adoption of innovative breeding solutions and smart pet care devices.
- Regulatory Support: Favorable regulations and industry standards that promote responsible pet keeping and breeding.
Reptile Breeding Box Product Landscape
The Reptile Breeding Box market is characterized by continuous product innovation, with manufacturers focusing on enhanced functionality, safety, and ease of use. Current product offerings range from basic, durable plastic enclosures to advanced, climate-controlled units designed for specific species' breeding requirements. Key product innovations include improved ventilation systems that prevent moisture buildup, integrated heating and lighting solutions for optimal incubation and growth, and secure locking mechanisms to ensure animal safety. Many products now feature transparent viewing panels for easy monitoring without disturbing the inhabitants. Performance metrics are increasingly focused on temperature and humidity stability, material durability, and ease of cleaning. Unique selling propositions often revolve around species-specific designs, modularity for expansion, and the integration of smart technology for remote environmental monitoring and control, setting apart premium offerings in a competitive landscape.
Key Drivers, Barriers & Challenges in Reptile Breeding Box
The Reptile Breeding Box market is propelled by several key drivers: the escalating popularity of exotic reptiles as pets, leading to increased demand for specialized breeding equipment; advancements in breeding technologies that enhance success rates; and a growing awareness of reptile welfare, driving the adoption of high-quality enclosures. The expanding e-commerce landscape also acts as a significant growth accelerator, providing wider market reach.
- Technological Advancements: Smart features, climate control, and improved materials.
- Rising Pet Ownership: Increasing numbers of reptile enthusiasts and collectors.
- Welfare Awareness: Growing emphasis on optimal breeding conditions.
- E-commerce Expansion: Greater accessibility to a global consumer base.
However, the market faces significant barriers and challenges. High production costs for specialized, feature-rich breeding boxes can limit affordability for some consumers. Stringent regulations regarding the import and export of certain reptile species can impact breeding programs and, consequently, the demand for breeding boxes. Supply chain disruptions, particularly for specialized components, can lead to production delays and increased costs. The availability of cheaper, less specialized alternatives also presents a competitive hurdle, especially in emerging markets.
- High Production Costs: Premium features can increase the price point.
- Regulatory Hurdles: Restrictions on species and interstate/international transport.
- Supply Chain Volatility: Potential for material shortages and delivery delays.
- Competition from Alternatives: Basic enclosures and DIY solutions.
- Economic Fluctuations: Disposable income impacts discretionary spending on pet products.
Emerging Opportunities in Reptile Breeding Box
Emerging opportunities in the Reptile Breeding Box market lie in the development of eco-friendly and sustainable breeding solutions, utilizing recycled materials and energy-efficient designs. The untapped potential in developing regions with a growing interest in exotic pets presents a significant growth avenue. Furthermore, the creation of highly specialized breeding boxes tailored for specific, rare, or increasingly popular reptile species, complete with integrated species-specific environmental controls, offers a niche but highly lucrative market. The integration of advanced IoT (Internet of Things) capabilities, allowing for predictive maintenance and AI-driven environmental optimization, represents a future frontier. The rise of custom breeding solutions for professional breeders seeking bespoke setups also signifies an important emerging segment.
Growth Accelerators in the Reptile Breeding Box Industry
Long-term growth in the Reptile Breeding Box industry is being significantly accelerated by ongoing technological breakthroughs, particularly in the realm of automation and environmental control. The increasing adoption of smart technologies, enabling remote monitoring and precise regulation of temperature, humidity, and ventilation, is transforming breeding practices and appealing to a wider audience. Strategic partnerships between leading manufacturers and herpetological associations or research institutions are fostering innovation and driving the development of scientifically validated breeding solutions. Furthermore, market expansion strategies that focus on educating consumers about the benefits of specialized breeding boxes and promoting responsible reptile ownership are crucial growth catalysts. The development of modular and scalable breeding systems that can adapt to the evolving needs of breeders also contributes to sustained growth.
Key Players Shaping the Reptile Breeding Box Market
- Hagen Group
- READY Stock
- N/Y
- Vision Products
- Zoo Med
- Giganterra
- Reptizoo
- Coaste
- OMEM
- Logozoe
- PINVNBY
- Boaphile Plastics
- Animal Plastics
- HerpCult
Notable Milestones in Reptile Breeding Box Sector
- 2019: Launch of advanced ventilation systems in medium-sized breeding boxes, reducing moisture-related health issues for young reptiles.
- 2020: Introduction of modular, stackable breeding box designs, catering to breeders with limited space.
- 2021: Increased focus on sustainable materials and eco-friendly manufacturing processes by several key players.
- 2022: Rollout of smart breeding boxes with integrated Wi-Fi connectivity for remote monitoring of temperature and humidity.
- 2023: Significant increase in product offerings for species-specific breeding needs, addressing the growing diversity of reptile pets.
- 2024: Development of highly secure, escape-proof breeding solutions for particularly agile reptile species.
In-Depth Reptile Breeding Box Market Outlook
The future outlook for the Reptile Breeding Box market is exceptionally positive, driven by sustained growth in reptile pet ownership and increasing demand for advanced, welfare-focused breeding solutions. The report's analysis of growth accelerators highlights the continued impact of technological innovation, particularly in smart home integration for pet care and the development of highly specialized, species-specific breeding environments. Emerging opportunities in sustainable products and untapped geographical markets will further diversify and expand the market. Strategic partnerships and a continued emphasis on breeder education will solidify the market's trajectory, ensuring a robust and expanding future for high-quality reptile breeding equipment, with an estimated market value of over 1.2 billion units projected by the end of 2033.
Reptile Breeding Box Segmentation
-
1. Application
- 1.1. Supermarket
- 1.2. Pet store
- 1.3. Household
- 1.4. Other
-
2. Types
- 2.1. Large Breeding Box: Above 100cm
- 2.2. Medium Breeding Box: 50-100cm
- 2.3. Small Breeding Box: Below 50cm
Reptile Breeding Box Segmentation By Geography
-
1. North America
- 1.1. United States
- 1.2. Canada
- 1.3. Mexico
-
2. South America
- 2.1. Brazil
- 2.2. Argentina
- 2.3. Rest of South America
-
3. Europe
- 3.1. United Kingdom
- 3.2. Germany
- 3.3. France
- 3.4. Italy
- 3.5. Spain
- 3.6. Russia
- 3.7. Benelux
- 3.8. Nordics
- 3.9. Rest of Europe
-
4. Middle East & Africa
- 4.1. Turkey
- 4.2. Israel
- 4.3. GCC
- 4.4. North Africa
- 4.5. South Africa
- 4.6. Rest of Middle East & Africa
-
5. Asia Pacific
- 5.1. China
- 5.2. India
- 5.3. Japan
- 5.4. South Korea
- 5.5. ASEAN
- 5.6. Oceania
- 5.7. Rest of Asia Pacific
Reptile Breeding Box REPORT HIGHLIGHTS
| Aspects | Details |
|---|---|
| Study Period | 2019-2033 |
| Base Year | 2024 |
| Estimated Year | 2025 |
| Forecast Period | 2025-2033 |
| Historical Period | 2019-2024 |
| Growth Rate | CAGR of 3.8% from 2019-2033 |
| Segmentation |
|
Table of Contents
- 1. Introduction
- 1.1. Research Scope
- 1.2. Market Segmentation
- 1.3. Research Methodology
- 1.4. Definitions and Assumptions
- 2. Executive Summary
- 2.1. Introduction
- 3. Market Dynamics
- 3.1. Introduction
- 3.2. Market Drivers
- 3.3. Market Restrains
- 3.4. Market Trends
- 4. Market Factor Analysis
- 4.1. Porters Five Forces
- 4.2. Supply/Value Chain
- 4.3. PESTEL analysis
- 4.4. Market Entropy
- 4.5. Patent/Trademark Analysis
- 5. Global Reptile Breeding Box Analysis, Insights and Forecast, 2019-2031
- 5.1. Market Analysis, Insights and Forecast - by Application
- 5.1.1. Supermarket
- 5.1.2. Pet store
- 5.1.3. Household
- 5.1.4. Other
- 5.2. Market Analysis, Insights and Forecast - by Types
- 5.2.1. Large Breeding Box: Above 100cm
- 5.2.2. Medium Breeding Box: 50-100cm
- 5.2.3. Small Breeding Box: Below 50cm
- 5.3. Market Analysis, Insights and Forecast - by Region
- 5.3.1. North America
- 5.3.2. South America
- 5.3.3. Europe
- 5.3.4. Middle East & Africa
- 5.3.5. Asia Pacific
- 5.1. Market Analysis, Insights and Forecast - by Application
- 6. North America Reptile Breeding Box Analysis, Insights and Forecast, 2019-2031
- 6.1. Market Analysis, Insights and Forecast - by Application
- 6.1.1. Supermarket
- 6.1.2. Pet store
- 6.1.3. Household
- 6.1.4. Other
- 6.2. Market Analysis, Insights and Forecast - by Types
- 6.2.1. Large Breeding Box: Above 100cm
- 6.2.2. Medium Breeding Box: 50-100cm
- 6.2.3. Small Breeding Box: Below 50cm
- 6.1. Market Analysis, Insights and Forecast - by Application
- 7. South America Reptile Breeding Box Analysis, Insights and Forecast, 2019-2031
- 7.1. Market Analysis, Insights and Forecast - by Application
- 7.1.1. Supermarket
- 7.1.2. Pet store
- 7.1.3. Household
- 7.1.4. Other
- 7.2. Market Analysis, Insights and Forecast - by Types
- 7.2.1. Large Breeding Box: Above 100cm
- 7.2.2. Medium Breeding Box: 50-100cm
- 7.2.3. Small Breeding Box: Below 50cm
- 7.1. Market Analysis, Insights and Forecast - by Application
- 8. Europe Reptile Breeding Box Analysis, Insights and Forecast, 2019-2031
- 8.1. Market Analysis, Insights and Forecast - by Application
- 8.1.1. Supermarket
- 8.1.2. Pet store
- 8.1.3. Household
- 8.1.4. Other
- 8.2. Market Analysis, Insights and Forecast - by Types
- 8.2.1. Large Breeding Box: Above 100cm
- 8.2.2. Medium Breeding Box: 50-100cm
- 8.2.3. Small Breeding Box: Below 50cm
- 8.1. Market Analysis, Insights and Forecast - by Application
- 9. Middle East & Africa Reptile Breeding Box Analysis, Insights and Forecast, 2019-2031
- 9.1. Market Analysis, Insights and Forecast - by Application
- 9.1.1. Supermarket
- 9.1.2. Pet store
- 9.1.3. Household
- 9.1.4. Other
- 9.2. Market Analysis, Insights and Forecast - by Types
- 9.2.1. Large Breeding Box: Above 100cm
- 9.2.2. Medium Breeding Box: 50-100cm
- 9.2.3. Small Breeding Box: Below 50cm
- 9.1. Market Analysis, Insights and Forecast - by Application
- 10. Asia Pacific Reptile Breeding Box Analysis, Insights and Forecast, 2019-2031
- 10.1. Market Analysis, Insights and Forecast - by Application
- 10.1.1. Supermarket
- 10.1.2. Pet store
- 10.1.3. Household
- 10.1.4. Other
- 10.2. Market Analysis, Insights and Forecast - by Types
- 10.2.1. Large Breeding Box: Above 100cm
- 10.2.2. Medium Breeding Box: 50-100cm
- 10.2.3. Small Breeding Box: Below 50cm
- 10.1. Market Analysis, Insights and Forecast - by Application
- 11. Competitive Analysis
- 11.1. Global Market Share Analysis 2024
- 11.2. Company Profiles
- 11.2.1 Hagen Group
- 11.2.1.1. Overview
- 11.2.1.2. Products
- 11.2.1.3. SWOT Analysis
- 11.2.1.4. Recent Developments
- 11.2.1.5. Financials (Based on Availability)
- 11.2.2 READY Stock
- 11.2.2.1. Overview
- 11.2.2.2. Products
- 11.2.2.3. SWOT Analysis
- 11.2.2.4. Recent Developments
- 11.2.2.5. Financials (Based on Availability)
- 11.2.3 N/Y
- 11.2.3.1. Overview
- 11.2.3.2. Products
- 11.2.3.3. SWOT Analysis
- 11.2.3.4. Recent Developments
- 11.2.3.5. Financials (Based on Availability)
- 11.2.4 Vision Products
- 11.2.4.1. Overview
- 11.2.4.2. Products
- 11.2.4.3. SWOT Analysis
- 11.2.4.4. Recent Developments
- 11.2.4.5. Financials (Based on Availability)
- 11.2.5 Zoo Med
- 11.2.5.1. Overview
- 11.2.5.2. Products
- 11.2.5.3. SWOT Analysis
- 11.2.5.4. Recent Developments
- 11.2.5.5. Financials (Based on Availability)
- 11.2.6 Giganterra
- 11.2.6.1. Overview
- 11.2.6.2. Products
- 11.2.6.3. SWOT Analysis
- 11.2.6.4. Recent Developments
- 11.2.6.5. Financials (Based on Availability)
- 11.2.7 Reptizoo
- 11.2.7.1. Overview
- 11.2.7.2. Products
- 11.2.7.3. SWOT Analysis
- 11.2.7.4. Recent Developments
- 11.2.7.5. Financials (Based on Availability)
- 11.2.8 Coaste
- 11.2.8.1. Overview
- 11.2.8.2. Products
- 11.2.8.3. SWOT Analysis
- 11.2.8.4. Recent Developments
- 11.2.8.5. Financials (Based on Availability)
- 11.2.9 OMEM
- 11.2.9.1. Overview
- 11.2.9.2. Products
- 11.2.9.3. SWOT Analysis
- 11.2.9.4. Recent Developments
- 11.2.9.5. Financials (Based on Availability)
- 11.2.10 Logozoe
- 11.2.10.1. Overview
- 11.2.10.2. Products
- 11.2.10.3. SWOT Analysis
- 11.2.10.4. Recent Developments
- 11.2.10.5. Financials (Based on Availability)
- 11.2.11 PINVNBY
- 11.2.11.1. Overview
- 11.2.11.2. Products
- 11.2.11.3. SWOT Analysis
- 11.2.11.4. Recent Developments
- 11.2.11.5. Financials (Based on Availability)
- 11.2.12 Boaphile Plastics
- 11.2.12.1. Overview
- 11.2.12.2. Products
- 11.2.12.3. SWOT Analysis
- 11.2.12.4. Recent Developments
- 11.2.12.5. Financials (Based on Availability)
- 11.2.13 Animal Plastics
- 11.2.13.1. Overview
- 11.2.13.2. Products
- 11.2.13.3. SWOT Analysis
- 11.2.13.4. Recent Developments
- 11.2.13.5. Financials (Based on Availability)
- 11.2.14 HerpCult
- 11.2.14.1. Overview
- 11.2.14.2. Products
- 11.2.14.3. SWOT Analysis
- 11.2.14.4. Recent Developments
- 11.2.14.5. Financials (Based on Availability)
- 11.2.1 Hagen Group
List of Figures
- Figure 1: Global Reptile Breeding Box Revenue Breakdown (million, %) by Region 2024 & 2032
- Figure 2: Global Reptile Breeding Box Volume Breakdown (K, %) by Region 2024 & 2032
- Figure 3: North America Reptile Breeding Box Revenue (million), by Application 2024 & 2032
- Figure 4: North America Reptile Breeding Box Volume (K), by Application 2024 & 2032
- Figure 5: North America Reptile Breeding Box Revenue Share (%), by Application 2024 & 2032
- Figure 6: North America Reptile Breeding Box Volume Share (%), by Application 2024 & 2032
- Figure 7: North America Reptile Breeding Box Revenue (million), by Types 2024 & 2032
- Figure 8: North America Reptile Breeding Box Volume (K), by Types 2024 & 2032
- Figure 9: North America Reptile Breeding Box Revenue Share (%), by Types 2024 & 2032
- Figure 10: North America Reptile Breeding Box Volume Share (%), by Types 2024 & 2032
- Figure 11: North America Reptile Breeding Box Revenue (million), by Country 2024 & 2032
- Figure 12: North America Reptile Breeding Box Volume (K), by Country 2024 & 2032
- Figure 13: North America Reptile Breeding Box Revenue Share (%), by Country 2024 & 2032
- Figure 14: North America Reptile Breeding Box Volume Share (%), by Country 2024 & 2032
- Figure 15: South America Reptile Breeding Box Revenue (million), by Application 2024 & 2032
- Figure 16: South America Reptile Breeding Box Volume (K), by Application 2024 & 2032
- Figure 17: South America Reptile Breeding Box Revenue Share (%), by Application 2024 & 2032
- Figure 18: South America Reptile Breeding Box Volume Share (%), by Application 2024 & 2032
- Figure 19: South America Reptile Breeding Box Revenue (million), by Types 2024 & 2032
- Figure 20: South America Reptile Breeding Box Volume (K), by Types 2024 & 2032
- Figure 21: South America Reptile Breeding Box Revenue Share (%), by Types 2024 & 2032
- Figure 22: South America Reptile Breeding Box Volume Share (%), by Types 2024 & 2032
- Figure 23: South America Reptile Breeding Box Revenue (million), by Country 2024 & 2032
- Figure 24: South America Reptile Breeding Box Volume (K), by Country 2024 & 2032
- Figure 25: South America Reptile Breeding Box Revenue Share (%), by Country 2024 & 2032
- Figure 26: South America Reptile Breeding Box Volume Share (%), by Country 2024 & 2032
- Figure 27: Europe Reptile Breeding Box Revenue (million), by Application 2024 & 2032
- Figure 28: Europe Reptile Breeding Box Volume (K), by Application 2024 & 2032
- Figure 29: Europe Reptile Breeding Box Revenue Share (%), by Application 2024 & 2032
- Figure 30: Europe Reptile Breeding Box Volume Share (%), by Application 2024 & 2032
- Figure 31: Europe Reptile Breeding Box Revenue (million), by Types 2024 & 2032
- Figure 32: Europe Reptile Breeding Box Volume (K), by Types 2024 & 2032
- Figure 33: Europe Reptile Breeding Box Revenue Share (%), by Types 2024 & 2032
- Figure 34: Europe Reptile Breeding Box Volume Share (%), by Types 2024 & 2032
- Figure 35: Europe Reptile Breeding Box Revenue (million), by Country 2024 & 2032
- Figure 36: Europe Reptile Breeding Box Volume (K), by Country 2024 & 2032
- Figure 37: Europe Reptile Breeding Box Revenue Share (%), by Country 2024 & 2032
- Figure 38: Europe Reptile Breeding Box Volume Share (%), by Country 2024 & 2032
- Figure 39: Middle East & Africa Reptile Breeding Box Revenue (million), by Application 2024 & 2032
- Figure 40: Middle East & Africa Reptile Breeding Box Volume (K), by Application 2024 & 2032
- Figure 41: Middle East & Africa Reptile Breeding Box Revenue Share (%), by Application 2024 & 2032
- Figure 42: Middle East & Africa Reptile Breeding Box Volume Share (%), by Application 2024 & 2032
- Figure 43: Middle East & Africa Reptile Breeding Box Revenue (million), by Types 2024 & 2032
- Figure 44: Middle East & Africa Reptile Breeding Box Volume (K), by Types 2024 & 2032
- Figure 45: Middle East & Africa Reptile Breeding Box Revenue Share (%), by Types 2024 & 2032
- Figure 46: Middle East & Africa Reptile Breeding Box Volume Share (%), by Types 2024 & 2032
- Figure 47: Middle East & Africa Reptile Breeding Box Revenue (million), by Country 2024 & 2032
- Figure 48: Middle East & Africa Reptile Breeding Box Volume (K), by Country 2024 & 2032
- Figure 49: Middle East & Africa Reptile Breeding Box Revenue Share (%), by Country 2024 & 2032
- Figure 50: Middle East & Africa Reptile Breeding Box Volume Share (%), by Country 2024 & 2032
- Figure 51: Asia Pacific Reptile Breeding Box Revenue (million), by Application 2024 & 2032
- Figure 52: Asia Pacific Reptile Breeding Box Volume (K), by Application 2024 & 2032
- Figure 53: Asia Pacific Reptile Breeding Box Revenue Share (%), by Application 2024 & 2032
- Figure 54: Asia Pacific Reptile Breeding Box Volume Share (%), by Application 2024 & 2032
- Figure 55: Asia Pacific Reptile Breeding Box Revenue (million), by Types 2024 & 2032
- Figure 56: Asia Pacific Reptile Breeding Box Volume (K), by Types 2024 & 2032
- Figure 57: Asia Pacific Reptile Breeding Box Revenue Share (%), by Types 2024 & 2032
- Figure 58: Asia Pacific Reptile Breeding Box Volume Share (%), by Types 2024 & 2032
- Figure 59: Asia Pacific Reptile Breeding Box Revenue (million), by Country 2024 & 2032
- Figure 60: Asia Pacific Reptile Breeding Box Volume (K), by Country 2024 & 2032
- Figure 61: Asia Pacific Reptile Breeding Box Revenue Share (%), by Country 2024 & 2032
- Figure 62: Asia Pacific Reptile Breeding Box Volume Share (%), by Country 2024 & 2032
List of Tables
- Table 1: Global Reptile Breeding Box Revenue million Forecast, by Region 2019 & 2032
- Table 2: Global Reptile Breeding Box Volume K Forecast, by Region 2019 & 2032
- Table 3: Global Reptile Breeding Box Revenue million Forecast, by Application 2019 & 2032
- Table 4: Global Reptile Breeding Box Volume K Forecast, by Application 2019 & 2032
- Table 5: Global Reptile Breeding Box Revenue million Forecast, by Types 2019 & 2032
- Table 6: Global Reptile Breeding Box Volume K Forecast, by Types 2019 & 2032
- Table 7: Global Reptile Breeding Box Revenue million Forecast, by Region 2019 & 2032
- Table 8: Global Reptile Breeding Box Volume K Forecast, by Region 2019 & 2032
- Table 9: Global Reptile Breeding Box Revenue million Forecast, by Application 2019 & 2032
- Table 10: Global Reptile Breeding Box Volume K Forecast, by Application 2019 & 2032
- Table 11: Global Reptile Breeding Box Revenue million Forecast, by Types 2019 & 2032
- Table 12: Global Reptile Breeding Box Volume K Forecast, by Types 2019 & 2032
- Table 13: Global Reptile Breeding Box Revenue million Forecast, by Country 2019 & 2032
- Table 14: Global Reptile Breeding Box Volume K Forecast, by Country 2019 & 2032
- Table 15: United States Reptile Breeding Box Revenue (million) Forecast, by Application 2019 & 2032
- Table 16: United States Reptile Breeding Box Volume (K) Forecast, by Application 2019 & 2032
- Table 17: Canada Reptile Breeding Box Revenue (million) Forecast, by Application 2019 & 2032
- Table 18: Canada Reptile Breeding Box Volume (K) Forecast, by Application 2019 & 2032
- Table 19: Mexico Reptile Breeding Box Revenue (million) Forecast, by Application 2019 & 2032
- Table 20: Mexico Reptile Breeding Box Volume (K) Forecast, by Application 2019 & 2032
- Table 21: Global Reptile Breeding Box Revenue million Forecast, by Application 2019 & 2032
- Table 22: Global Reptile Breeding Box Volume K Forecast, by Application 2019 & 2032
- Table 23: Global Reptile Breeding Box Revenue million Forecast, by Types 2019 & 2032
- Table 24: Global Reptile Breeding Box Volume K Forecast, by Types 2019 & 2032
- Table 25: Global Reptile Breeding Box Revenue million Forecast, by Country 2019 & 2032
- Table 26: Global Reptile Breeding Box Volume K Forecast, by Country 2019 & 2032
- Table 27: Brazil Reptile Breeding Box Revenue (million) Forecast, by Application 2019 & 2032
- Table 28: Brazil Reptile Breeding Box Volume (K) Forecast, by Application 2019 & 2032
- Table 29: Argentina Reptile Breeding Box Revenue (million) Forecast, by Application 2019 & 2032
- Table 30: Argentina Reptile Breeding Box Volume (K) Forecast, by Application 2019 & 2032
- Table 31: Rest of South America Reptile Breeding Box Revenue (million) Forecast, by Application 2019 & 2032
- Table 32: Rest of South America Reptile Breeding Box Volume (K) Forecast, by Application 2019 & 2032
- Table 33: Global Reptile Breeding Box Revenue million Forecast, by Application 2019 & 2032
- Table 34: Global Reptile Breeding Box Volume K Forecast, by Application 2019 & 2032
- Table 35: Global Reptile Breeding Box Revenue million Forecast, by Types 2019 & 2032
- Table 36: Global Reptile Breeding Box Volume K Forecast, by Types 2019 & 2032
- Table 37: Global Reptile Breeding Box Revenue million Forecast, by Country 2019 & 2032
- Table 38: Global Reptile Breeding Box Volume K Forecast, by Country 2019 & 2032
- Table 39: United Kingdom Reptile Breeding Box Revenue (million) Forecast, by Application 2019 & 2032
- Table 40: United Kingdom Reptile Breeding Box Volume (K) Forecast, by Application 2019 & 2032
- Table 41: Germany Reptile Breeding Box Revenue (million) Forecast, by Application 2019 & 2032
- Table 42: Germany Reptile Breeding Box Volume (K) Forecast, by Application 2019 & 2032
- Table 43: France Reptile Breeding Box Revenue (million) Forecast, by Application 2019 & 2032
- Table 44: France Reptile Breeding Box Volume (K) Forecast, by Application 2019 & 2032
- Table 45: Italy Reptile Breeding Box Revenue (million) Forecast, by Application 2019 & 2032
- Table 46: Italy Reptile Breeding Box Volume (K) Forecast, by Application 2019 & 2032
- Table 47: Spain Reptile Breeding Box Revenue (million) Forecast, by Application 2019 & 2032
- Table 48: Spain Reptile Breeding Box Volume (K) Forecast, by Application 2019 & 2032
- Table 49: Russia Reptile Breeding Box Revenue (million) Forecast, by Application 2019 & 2032
- Table 50: Russia Reptile Breeding Box Volume (K) Forecast, by Application 2019 & 2032
- Table 51: Benelux Reptile Breeding Box Revenue (million) Forecast, by Application 2019 & 2032
- Table 52: Benelux Reptile Breeding Box Volume (K) Forecast, by Application 2019 & 2032
- Table 53: Nordics Reptile Breeding Box Revenue (million) Forecast, by Application 2019 & 2032
- Table 54: Nordics Reptile Breeding Box Volume (K) Forecast, by Application 2019 & 2032
- Table 55: Rest of Europe Reptile Breeding Box Revenue (million) Forecast, by Application 2019 & 2032
- Table 56: Rest of Europe Reptile Breeding Box Volume (K) Forecast, by Application 2019 & 2032
- Table 57: Global Reptile Breeding Box Revenue million Forecast, by Application 2019 & 2032
- Table 58: Global Reptile Breeding Box Volume K Forecast, by Application 2019 & 2032
- Table 59: Global Reptile Breeding Box Revenue million Forecast, by Types 2019 & 2032
- Table 60: Global Reptile Breeding Box Volume K Forecast, by Types 2019 & 2032
- Table 61: Global Reptile Breeding Box Revenue million Forecast, by Country 2019 & 2032
- Table 62: Global Reptile Breeding Box Volume K Forecast, by Country 2019 & 2032
- Table 63: Turkey Reptile Breeding Box Revenue (million) Forecast, by Application 2019 & 2032
- Table 64: Turkey Reptile Breeding Box Volume (K) Forecast, by Application 2019 & 2032
- Table 65: Israel Reptile Breeding Box Revenue (million) Forecast, by Application 2019 & 2032
- Table 66: Israel Reptile Breeding Box Volume (K) Forecast, by Application 2019 & 2032
- Table 67: GCC Reptile Breeding Box Revenue (million) Forecast, by Application 2019 & 2032
- Table 68: GCC Reptile Breeding Box Volume (K) Forecast, by Application 2019 & 2032
- Table 69: North Africa Reptile Breeding Box Revenue (million) Forecast, by Application 2019 & 2032
- Table 70: North Africa Reptile Breeding Box Volume (K) Forecast, by Application 2019 & 2032
- Table 71: South Africa Reptile Breeding Box Revenue (million) Forecast, by Application 2019 & 2032
- Table 72: South Africa Reptile Breeding Box Volume (K) Forecast, by Application 2019 & 2032
- Table 73: Rest of Middle East & Africa Reptile Breeding Box Revenue (million) Forecast, by Application 2019 & 2032
- Table 74: Rest of Middle East & Africa Reptile Breeding Box Volume (K) Forecast, by Application 2019 & 2032
- Table 75: Global Reptile Breeding Box Revenue million Forecast, by Application 2019 & 2032
- Table 76: Global Reptile Breeding Box Volume K Forecast, by Application 2019 & 2032
- Table 77: Global Reptile Breeding Box Revenue million Forecast, by Types 2019 & 2032
- Table 78: Global Reptile Breeding Box Volume K Forecast, by Types 2019 & 2032
- Table 79: Global Reptile Breeding Box Revenue million Forecast, by Country 2019 & 2032
- Table 80: Global Reptile Breeding Box Volume K Forecast, by Country 2019 & 2032
- Table 81: China Reptile Breeding Box Revenue (million) Forecast, by Application 2019 & 2032
- Table 82: China Reptile Breeding Box Volume (K) Forecast, by Application 2019 & 2032
- Table 83: India Reptile Breeding Box Revenue (million) Forecast, by Application 2019 & 2032
- Table 84: India Reptile Breeding Box Volume (K) Forecast, by Application 2019 & 2032
- Table 85: Japan Reptile Breeding Box Revenue (million) Forecast, by Application 2019 & 2032
- Table 86: Japan Reptile Breeding Box Volume (K) Forecast, by Application 2019 & 2032
- Table 87: South Korea Reptile Breeding Box Revenue (million) Forecast, by Application 2019 & 2032
- Table 88: South Korea Reptile Breeding Box Volume (K) Forecast, by Application 2019 & 2032
- Table 89: ASEAN Reptile Breeding Box Revenue (million) Forecast, by Application 2019 & 2032
- Table 90: ASEAN Reptile Breeding Box Volume (K) Forecast, by Application 2019 & 2032
- Table 91: Oceania Reptile Breeding Box Revenue (million) Forecast, by Application 2019 & 2032
- Table 92: Oceania Reptile Breeding Box Volume (K) Forecast, by Application 2019 & 2032
- Table 93: Rest of Asia Pacific Reptile Breeding Box Revenue (million) Forecast, by Application 2019 & 2032
- Table 94: Rest of Asia Pacific Reptile Breeding Box Volume (K) Forecast, by Application 2019 & 2032
Frequently Asked Questions
1. What is the projected Compound Annual Growth Rate (CAGR) of the Reptile Breeding Box?
The projected CAGR is approximately 3.8%.
2. Which companies are prominent players in the Reptile Breeding Box?
Key companies in the market include Hagen Group, READY Stock, N/Y, Vision Products, Zoo Med, Giganterra, Reptizoo, Coaste, OMEM, Logozoe, PINVNBY, Boaphile Plastics, Animal Plastics, HerpCult.
3. What are the main segments of the Reptile Breeding Box?
The market segments include Application, Types.
4. Can you provide details about the market size?
The market size is estimated to be USD 109.4 million as of 2022.
5. What are some drivers contributing to market growth?
N/A
6. What are the notable trends driving market growth?
N/A
7. Are there any restraints impacting market growth?
N/A
8. Can you provide examples of recent developments in the market?
N/A
9. What pricing options are available for accessing the report?
Pricing options include single-user, multi-user, and enterprise licenses priced at USD 3950.00, USD 5925.00, and USD 7900.00 respectively.
10. Is the market size provided in terms of value or volume?
The market size is provided in terms of value, measured in million and volume, measured in K.
11. Are there any specific market keywords associated with the report?
Yes, the market keyword associated with the report is "Reptile Breeding Box," which aids in identifying and referencing the specific market segment covered.
12. How do I determine which pricing option suits my needs best?
The pricing options vary based on user requirements and access needs. Individual users may opt for single-user licenses, while businesses requiring broader access may choose multi-user or enterprise licenses for cost-effective access to the report.
13. Are there any additional resources or data provided in the Reptile Breeding Box report?
While the report offers comprehensive insights, it's advisable to review the specific contents or supplementary materials provided to ascertain if additional resources or data are available.
14. How can I stay updated on further developments or reports in the Reptile Breeding Box?
To stay informed about further developments, trends, and reports in the Reptile Breeding Box, consider subscribing to industry newsletters, following relevant companies and organizations, or regularly checking reputable industry news sources and publications.
Methodology
Step 1 - Identification of Relevant Samples Size from Population Database


Step 2 - Approaches for Defining Global Market Size (Value, Volume* & Price*)

Note*: In applicable scenarios
Step 3 - Data Sources
Primary Research
- Web Analytics
- Survey Reports
- Research Institute
- Latest Research Reports
- Opinion Leaders
Secondary Research
- Annual Reports
- White Paper
- Latest Press Release
- Industry Association
- Paid Database
- Investor Presentations

Step 4 - Data Triangulation
Involves using different sources of information in order to increase the validity of a study
These sources are likely to be stakeholders in a program - participants, other researchers, program staff, other community members, and so on.
Then we put all data in single framework & apply various statistical tools to find out the dynamic on the market.
During the analysis stage, feedback from the stakeholder groups would be compared to determine areas of agreement as well as areas of divergence
