

Key Insights
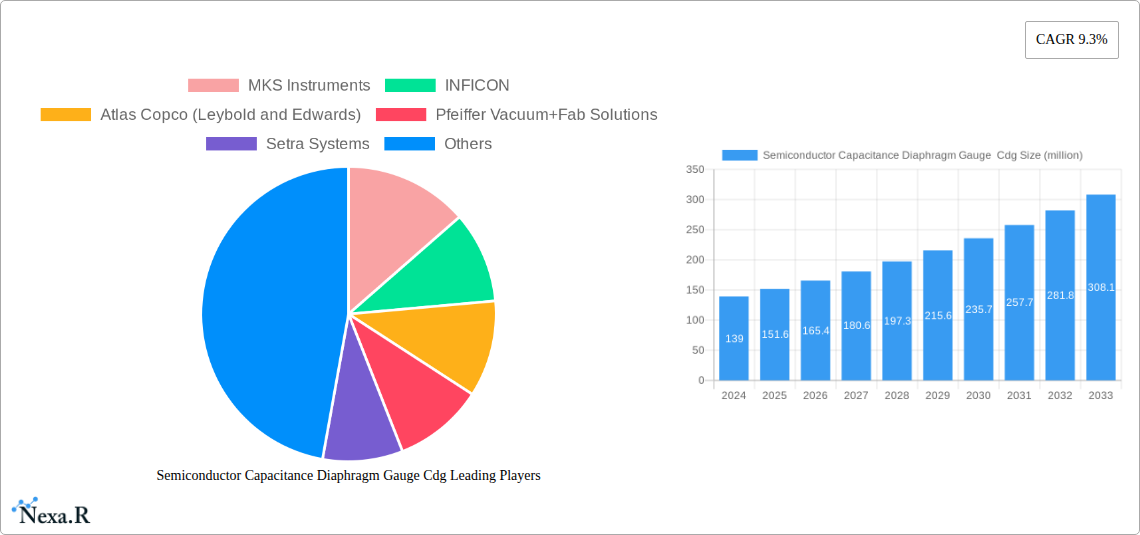
The global market for Semiconductor Capacitance Diaphragm Gauges (CDG) is poised for significant expansion, driven by the ever-increasing demand for advanced semiconductor manufacturing processes. With a substantial market size of $139 million and a robust Compound Annual Growth Rate (CAGR) of 9.3%, the CDG market is set to reach an estimated value of $240 million by 2033. This impressive growth trajectory is fueled by the critical role CDGs play in ensuring precise pressure control during various stages of semiconductor fabrication, including deposition, etching, and ion implantation. The burgeoning demand for sophisticated microchips across a multitude of industries, from consumer electronics and automotive to telecommunications and artificial intelligence, directly translates into a heightened need for reliable and accurate pressure measurement solutions like CDGs. Furthermore, ongoing advancements in semiconductor technology, leading to smaller and more complex chip designs, necessitate even tighter process tolerances, thereby reinforcing the indispensable nature of high-performance CDGs.
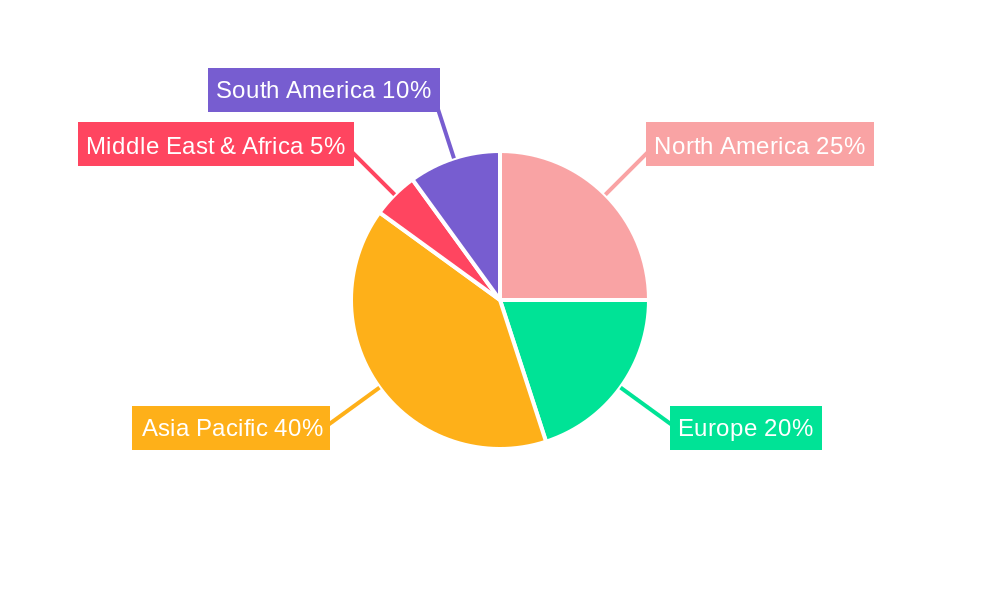
The market's growth is further stimulated by key trends such as the increasing adoption of heated type CDGs for enhanced performance and stability in challenging process environments. While the market exhibits strong upward momentum, certain restraints, such as the high initial cost of advanced CDG systems and the availability of alternative pressure measurement technologies for less demanding applications, may present moderate challenges. However, the inherent precision, reliability, and durability of Capacitance Diaphragm Gauges, especially in vacuum and low-pressure applications critical to semiconductor manufacturing, are expected to outweigh these limitations. The competitive landscape is characterized by the presence of established global players and emerging regional manufacturers, all vying for market share through product innovation, strategic partnerships, and expanding distribution networks to cater to the growing semiconductor hubs worldwide. Asia Pacific is anticipated to dominate the market due to its substantial semiconductor manufacturing base, followed by North America and Europe.
The global Semiconductor Capacitance Diaphragm Gauge (CDG) market is characterized by a moderate to highly concentrated structure, with leading players like MKS Instruments, INFICON, Atlas Copco (Leybold and Edwards), and Pfeiffer Vacuum holding significant market shares. Technological innovation remains a primary driver, fueled by the relentless pursuit of higher precision, faster response times, and enhanced durability in vacuum measurement for advanced semiconductor manufacturing processes such as deposition, etching, and ion implantation. Robust regulatory frameworks, primarily driven by stringent quality control and safety standards in the semiconductor industry, influence product development and market entry. Competitive product substitutes, while present, often fall short in offering the same level of accuracy and reliability demanded by high-end semiconductor applications. End-user demographics are dominated by Original Equipment Manufacturers (OEMs) and contract manufacturing organizations (CMOs) within the semiconductor fabrication sector. Mergers and acquisitions (M&A) trends, though not as voluminous as in broader industrial markets, are strategic and focused on acquiring specialized technologies or expanding geographical reach. For instance, there were an estimated 5 significant M&A deals in the past five years, primarily involving smaller technology firms being absorbed by larger players to gain intellectual property and market access. Innovation barriers are primarily related to the high cost of research and development, the need for specialized expertise, and the long product qualification cycles within the semiconductor industry.
Semiconductor Capacitance Diaphragm Gauge Cdg Growth Trends & Insights
The global Semiconductor Capacitance Diaphragm Gauge (CDG) market is poised for substantial growth, projected to expand from an estimated $1,500 million in 2024 to reach $2,800 million by 2033, exhibiting a Compound Annual Growth Rate (CAGR) of approximately 7.1% during the forecast period of 2025-2033. This upward trajectory is underpinned by the surging demand for advanced semiconductor devices, driven by the proliferation of 5G technology, artificial intelligence (AI), the Internet of Things (IoT), and high-performance computing. The increasing complexity of semiconductor manufacturing processes, requiring tighter vacuum control and higher precision measurements, directly translates to a greater adoption rate of advanced CDGs. Technological disruptions, such as the development of more robust sensor materials and improved signal processing capabilities, are further enhancing the performance and reliability of these gauges, making them indispensable in modern fabrication facilities. Consumer behavior shifts, particularly the growing preference for smaller, more powerful, and energy-efficient electronic devices, indirectly fuel the demand for sophisticated semiconductor manufacturing equipment, consequently boosting the CDG market. The market penetration of CDGs is expected to rise, especially in emerging semiconductor manufacturing hubs, as new fabs are established and existing ones are upgraded. The continuous drive for yield enhancement and process optimization in semiconductor fabrication necessitates precise and stable vacuum measurements, ensuring that CDGs are not merely accessories but critical components in the manufacturing chain. The overall market size evolution is a direct reflection of the health and expansion of the global semiconductor industry, which remains a cornerstone of technological advancement and economic progress.

Dominant Regions, Countries, or Segments in Semiconductor Capacitance Diaphragm Gauge Cdg
The Asia Pacific region, particularly countries like China, South Korea, Taiwan, and Japan, stands as the dominant force in the Semiconductor Capacitance Diaphragm Gauge (CDG) market, primarily driven by its status as the global epicenter of semiconductor manufacturing. The region commands an estimated 55% of the global CDG market share, with China alone accounting for a significant portion of this due to aggressive investments in domestic semiconductor production capabilities.
Key Drivers of Dominance in Asia Pacific:
- Robust Semiconductor Manufacturing Ecosystem: The presence of major chip manufacturers and their extensive supply chains creates an insatiable demand for vacuum measurement solutions like CDGs. Countries like Taiwan and South Korea are home to leading foundries, while China is rapidly expanding its indigenous semiconductor production capacity.
- Government Initiatives and Subsidies: Numerous governments in the Asia Pacific region, especially China, have implemented ambitious policies and offered substantial financial incentives to foster domestic semiconductor manufacturing and R&D, directly stimulating the demand for advanced vacuum components.
- Growing Demand for Advanced Electronics: The burgeoning consumer electronics market in the region, coupled with the rapid adoption of 5G, AI, and IoT technologies, necessitates the production of increasingly sophisticated semiconductor chips, requiring high-precision CDGs.
- Strategic Investments in New Fabs: Significant capital expenditure on building new semiconductor fabrication plants across Asia Pacific directly translates to a substantial influx of demand for CDGs, as these are essential components for all vacuum processes.
Within the Application segment, Deposition processes, including Chemical Vapor Deposition (CVD) and Physical Vapor Deposition (PVD), are the largest contributors to CDG demand, accounting for approximately 40% of the market. This is due to the critical need for precise pressure control to ensure the uniform and defect-free deposition of thin films on wafers. Etching and Cleaning applications follow closely, representing around 35% of the market, as these processes also rely heavily on accurate vacuum measurements for consistent wafer processing. Ion Implantation applications contribute about 15%, where controlled vacuum environments are crucial for beam stability and process uniformity. The "Others" category, encompassing applications like wafer bonding and annealing, makes up the remaining 10%.
In terms of Type, the Heated Type CDGs are experiencing higher growth rates and are gradually capturing more market share, estimated at 60% of the market value. This is attributed to their superior performance in preventing condensation and ensuring measurement accuracy in processes involving higher temperatures or volatile process gases. The Unheated Type CDGs, while still significant and more cost-effective for certain applications, represent the remaining 40% of the market.
Semiconductor Capacitance Diaphragm Gauge Cdg Product Landscape
The Semiconductor Capacitance Diaphragm Gauge (CDG) product landscape is characterized by continuous innovation focused on enhancing measurement accuracy, stability, and resistance to harsh process environments. Manufacturers are actively developing CDGs with extended temperature ranges, faster response times, and improved data logging capabilities to meet the ever-increasing demands of advanced semiconductor fabrication. Unique selling propositions often revolve around superior long-term stability, reduced drift, and compatibility with corrosive process gases. Technological advancements include the integration of digital communication protocols for seamless data transfer to process control systems and the development of self-diagnostic features for proactive maintenance.
Key Drivers, Barriers & Challenges in Semiconductor Capacitance Diaphragm Gauge Cdg
Key Drivers:
- Expanding Semiconductor Manufacturing Capacity: Global investments in new semiconductor fabrication plants (fabs) worldwide, particularly in Asia Pacific, are a primary growth catalyst.
- Technological Advancements in Semiconductor Devices: The demand for smaller, more powerful, and energy-efficient chips in areas like AI, 5G, and IoT necessitates advanced manufacturing processes requiring precise vacuum control.
- Increasing Process Complexity: Modern semiconductor manufacturing techniques involve more intricate steps requiring higher accuracy and reliability in vacuum measurement.
- Stringent Quality Control Standards: The semiconductor industry's unwavering commitment to yield and defect reduction mandates the use of high-performance CDGs.
Key Barriers & Challenges:
- High Cost of R&D and Manufacturing: Developing and producing highly accurate and durable CDGs requires significant investment in specialized technology and expertise.
- Long Product Qualification Cycles: Semiconductor manufacturers have lengthy and rigorous qualification processes for new equipment, extending time-to-market for new CDG products.
- Intense Competition and Price Pressure: While innovation is key, a competitive market can lead to price pressures, especially for standard applications.
- Supply Chain Volatility: Geopolitical factors, raw material shortages, and logistical disruptions can impact the availability and cost of components for CDG manufacturing.
- Skilled Workforce Shortage: The semiconductor industry, including vacuum technology expertise, faces a global shortage of skilled professionals.
Emerging Opportunities in Semiconductor Capacitance Diaphragm Gauge Cdg
Emerging opportunities in the Semiconductor Capacitance Diaphragm Gauge (CDG) market lie in the development of ultra-high precision CDGs for next-generation lithography techniques like EUV, which demand unprecedented vacuum stability. The growing demand for advanced packaging solutions, requiring precise atmospheric and vacuum control, presents another avenue. Furthermore, the expansion of semiconductor manufacturing into new geographical regions, such as Southeast Asia and parts of Europe, offers untapped market potential. The integration of AI and machine learning into CDG diagnostics and predictive maintenance also presents a significant opportunity for enhanced operational efficiency and reduced downtime for fab operators.
Growth Accelerators in the Semiconductor Capacitance Diaphragm Gauge Cdg Industry
Growth accelerators in the Semiconductor Capacitance Diaphragm Gauge (CDG) industry are predominantly driven by relentless technological breakthroughs enabling enhanced performance and new application possibilities. Strategic partnerships between CDG manufacturers and semiconductor equipment OEMs are crucial for co-development and ensuring seamless integration into advanced fabrication platforms. Market expansion strategies, including penetrating emerging semiconductor markets and catering to specialized niche applications within the semiconductor ecosystem, will further fuel long-term growth. The increasing adoption of advanced materials for sensor diaphragms and housings, offering improved chemical resistance and thermal stability, will also act as a significant growth accelerator.
Key Players Shaping the Semiconductor Capacitance Diaphragm Gauge Cdg Market
- MKS Instruments
- INFICON
- Atlas Copco
- Pfeiffer Vacuum
- Fab Solutions
- Setra Systems
- Canon Anelva
- Brooks Instrument
- ZHENTAI INSTRUMENT
- ULVAC
- Azbil
- Agilent
- Kurt J. Lesker
- EBARA
- ASAIR
- Atovac
- SATO VAC
Notable Milestones in Semiconductor Capacitance Diaphragm Gauge Cdg Sector
- 2019: Introduction of advanced diaphragm materials offering enhanced chemical resistance.
- 2020: Launch of CDGs with improved digital communication protocols for Industry 4.0 integration.
- 2021: Significant investment in R&D for next-generation CDGs supporting sub-nm wafer processing.
- 2022: Emergence of CDGs with integrated self-diagnostic and predictive maintenance features.
- 2023: Expansion of manufacturing capabilities by key players to meet rising global demand.
- 2024 (Q1): Introduction of compact and energy-efficient CDG designs for advanced etch and deposition systems.
In-Depth Semiconductor Capacitance Diaphragm Gauge Cdg Market Outlook
The future outlook for the Semiconductor Capacitance Diaphragm Gauge (CDG) market is exceptionally bright, driven by the accelerating global demand for semiconductors across diverse industries. Growth accelerators will continue to be powered by innovation in sensor technology, leading to ultra-high precision measurements essential for the shrinking node technologies. Strategic alliances and collaborations will be pivotal in navigating the complex semiconductor supply chain and ensuring product relevance. Market expansion into new geographical territories and a deeper penetration into specialized applications will further solidify the market's growth trajectory, promising sustained expansion and profitability for key stakeholders.
Semiconductor Capacitance Diaphragm Gauge Cdg Segmentation
-
1. Application
- 1.1. Deposition
- 1.2. Etching and Cleaning
- 1.3. Ion Implantation
- 1.4. Others
-
2. Type
- 2.1. Unheated Type
- 2.2. Heated Type
Semiconductor Capacitance Diaphragm Gauge Cdg Segmentation By Geography
-
1. North America
- 1.1. United States
- 1.2. Canada
- 1.3. Mexico
-
2. South America
- 2.1. Brazil
- 2.2. Argentina
- 2.3. Rest of South America
-
3. Europe
- 3.1. United Kingdom
- 3.2. Germany
- 3.3. France
- 3.4. Italy
- 3.5. Spain
- 3.6. Russia
- 3.7. Benelux
- 3.8. Nordics
- 3.9. Rest of Europe
-
4. Middle East & Africa
- 4.1. Turkey
- 4.2. Israel
- 4.3. GCC
- 4.4. North Africa
- 4.5. South Africa
- 4.6. Rest of Middle East & Africa
-
5. Asia Pacific
- 5.1. China
- 5.2. India
- 5.3. Japan
- 5.4. South Korea
- 5.5. ASEAN
- 5.6. Oceania
- 5.7. Rest of Asia Pacific
Semiconductor Capacitance Diaphragm Gauge Cdg REPORT HIGHLIGHTS
| Aspects | Details |
|---|---|
| Study Period | 2019-2033 |
| Base Year | 2024 |
| Estimated Year | 2025 |
| Forecast Period | 2025-2033 |
| Historical Period | 2019-2024 |
| Growth Rate | CAGR of 9.3% from 2019-2033 |
| Segmentation |
|
Table of Contents
- 1. Introduction
- 1.1. Research Scope
- 1.2. Market Segmentation
- 1.3. Research Methodology
- 1.4. Definitions and Assumptions
- 2. Executive Summary
- 2.1. Introduction
- 3. Market Dynamics
- 3.1. Introduction
- 3.2. Market Drivers
- 3.3. Market Restrains
- 3.4. Market Trends
- 4. Market Factor Analysis
- 4.1. Porters Five Forces
- 4.2. Supply/Value Chain
- 4.3. PESTEL analysis
- 4.4. Market Entropy
- 4.5. Patent/Trademark Analysis
- 5. Global Semiconductor Capacitance Diaphragm Gauge Cdg Analysis, Insights and Forecast, 2019-2031
- 5.1. Market Analysis, Insights and Forecast - by Application
- 5.1.1. Deposition
- 5.1.2. Etching and Cleaning
- 5.1.3. Ion Implantation
- 5.1.4. Others
- 5.2. Market Analysis, Insights and Forecast - by Type
- 5.2.1. Unheated Type
- 5.2.2. Heated Type
- 5.3. Market Analysis, Insights and Forecast - by Region
- 5.3.1. North America
- 5.3.2. South America
- 5.3.3. Europe
- 5.3.4. Middle East & Africa
- 5.3.5. Asia Pacific
- 5.1. Market Analysis, Insights and Forecast - by Application
- 6. North America Semiconductor Capacitance Diaphragm Gauge Cdg Analysis, Insights and Forecast, 2019-2031
- 6.1. Market Analysis, Insights and Forecast - by Application
- 6.1.1. Deposition
- 6.1.2. Etching and Cleaning
- 6.1.3. Ion Implantation
- 6.1.4. Others
- 6.2. Market Analysis, Insights and Forecast - by Type
- 6.2.1. Unheated Type
- 6.2.2. Heated Type
- 6.1. Market Analysis, Insights and Forecast - by Application
- 7. South America Semiconductor Capacitance Diaphragm Gauge Cdg Analysis, Insights and Forecast, 2019-2031
- 7.1. Market Analysis, Insights and Forecast - by Application
- 7.1.1. Deposition
- 7.1.2. Etching and Cleaning
- 7.1.3. Ion Implantation
- 7.1.4. Others
- 7.2. Market Analysis, Insights and Forecast - by Type
- 7.2.1. Unheated Type
- 7.2.2. Heated Type
- 7.1. Market Analysis, Insights and Forecast - by Application
- 8. Europe Semiconductor Capacitance Diaphragm Gauge Cdg Analysis, Insights and Forecast, 2019-2031
- 8.1. Market Analysis, Insights and Forecast - by Application
- 8.1.1. Deposition
- 8.1.2. Etching and Cleaning
- 8.1.3. Ion Implantation
- 8.1.4. Others
- 8.2. Market Analysis, Insights and Forecast - by Type
- 8.2.1. Unheated Type
- 8.2.2. Heated Type
- 8.1. Market Analysis, Insights and Forecast - by Application
- 9. Middle East & Africa Semiconductor Capacitance Diaphragm Gauge Cdg Analysis, Insights and Forecast, 2019-2031
- 9.1. Market Analysis, Insights and Forecast - by Application
- 9.1.1. Deposition
- 9.1.2. Etching and Cleaning
- 9.1.3. Ion Implantation
- 9.1.4. Others
- 9.2. Market Analysis, Insights and Forecast - by Type
- 9.2.1. Unheated Type
- 9.2.2. Heated Type
- 9.1. Market Analysis, Insights and Forecast - by Application
- 10. Asia Pacific Semiconductor Capacitance Diaphragm Gauge Cdg Analysis, Insights and Forecast, 2019-2031
- 10.1. Market Analysis, Insights and Forecast - by Application
- 10.1.1. Deposition
- 10.1.2. Etching and Cleaning
- 10.1.3. Ion Implantation
- 10.1.4. Others
- 10.2. Market Analysis, Insights and Forecast - by Type
- 10.2.1. Unheated Type
- 10.2.2. Heated Type
- 10.1. Market Analysis, Insights and Forecast - by Application
- 11. Competitive Analysis
- 11.1. Global Market Share Analysis 2024
- 11.2. Company Profiles
- 11.2.1 MKS Instruments
- 11.2.1.1. Overview
- 11.2.1.2. Products
- 11.2.1.3. SWOT Analysis
- 11.2.1.4. Recent Developments
- 11.2.1.5. Financials (Based on Availability)
- 11.2.2 INFICON
- 11.2.2.1. Overview
- 11.2.2.2. Products
- 11.2.2.3. SWOT Analysis
- 11.2.2.4. Recent Developments
- 11.2.2.5. Financials (Based on Availability)
- 11.2.3 Atlas Copco (Leybold and Edwards)
- 11.2.3.1. Overview
- 11.2.3.2. Products
- 11.2.3.3. SWOT Analysis
- 11.2.3.4. Recent Developments
- 11.2.3.5. Financials (Based on Availability)
- 11.2.4 Pfeiffer Vacuum+Fab Solutions
- 11.2.4.1. Overview
- 11.2.4.2. Products
- 11.2.4.3. SWOT Analysis
- 11.2.4.4. Recent Developments
- 11.2.4.5. Financials (Based on Availability)
- 11.2.5 Setra Systems
- 11.2.5.1. Overview
- 11.2.5.2. Products
- 11.2.5.3. SWOT Analysis
- 11.2.5.4. Recent Developments
- 11.2.5.5. Financials (Based on Availability)
- 11.2.6 Canon Anelva
- 11.2.6.1. Overview
- 11.2.6.2. Products
- 11.2.6.3. SWOT Analysis
- 11.2.6.4. Recent Developments
- 11.2.6.5. Financials (Based on Availability)
- 11.2.7 Brooks Instrument
- 11.2.7.1. Overview
- 11.2.7.2. Products
- 11.2.7.3. SWOT Analysis
- 11.2.7.4. Recent Developments
- 11.2.7.5. Financials (Based on Availability)
- 11.2.8 ZHENTAI INSTRUMENT
- 11.2.8.1. Overview
- 11.2.8.2. Products
- 11.2.8.3. SWOT Analysis
- 11.2.8.4. Recent Developments
- 11.2.8.5. Financials (Based on Availability)
- 11.2.9 ULVAC
- 11.2.9.1. Overview
- 11.2.9.2. Products
- 11.2.9.3. SWOT Analysis
- 11.2.9.4. Recent Developments
- 11.2.9.5. Financials (Based on Availability)
- 11.2.10 Azbil
- 11.2.10.1. Overview
- 11.2.10.2. Products
- 11.2.10.3. SWOT Analysis
- 11.2.10.4. Recent Developments
- 11.2.10.5. Financials (Based on Availability)
- 11.2.11 Agilent
- 11.2.11.1. Overview
- 11.2.11.2. Products
- 11.2.11.3. SWOT Analysis
- 11.2.11.4. Recent Developments
- 11.2.11.5. Financials (Based on Availability)
- 11.2.12 Kurt J. Lesker
- 11.2.12.1. Overview
- 11.2.12.2. Products
- 11.2.12.3. SWOT Analysis
- 11.2.12.4. Recent Developments
- 11.2.12.5. Financials (Based on Availability)
- 11.2.13 EBARA
- 11.2.13.1. Overview
- 11.2.13.2. Products
- 11.2.13.3. SWOT Analysis
- 11.2.13.4. Recent Developments
- 11.2.13.5. Financials (Based on Availability)
- 11.2.14 ASAIR
- 11.2.14.1. Overview
- 11.2.14.2. Products
- 11.2.14.3. SWOT Analysis
- 11.2.14.4. Recent Developments
- 11.2.14.5. Financials (Based on Availability)
- 11.2.15 Atovac
- 11.2.15.1. Overview
- 11.2.15.2. Products
- 11.2.15.3. SWOT Analysis
- 11.2.15.4. Recent Developments
- 11.2.15.5. Financials (Based on Availability)
- 11.2.16 SATO VAC
- 11.2.16.1. Overview
- 11.2.16.2. Products
- 11.2.16.3. SWOT Analysis
- 11.2.16.4. Recent Developments
- 11.2.16.5. Financials (Based on Availability)
- 11.2.1 MKS Instruments
List of Figures
- Figure 1: Global Semiconductor Capacitance Diaphragm Gauge Cdg Revenue Breakdown (million, %) by Region 2024 & 2032
- Figure 2: Global Semiconductor Capacitance Diaphragm Gauge Cdg Volume Breakdown (K, %) by Region 2024 & 2032
- Figure 3: North America Semiconductor Capacitance Diaphragm Gauge Cdg Revenue (million), by Application 2024 & 2032
- Figure 4: North America Semiconductor Capacitance Diaphragm Gauge Cdg Volume (K), by Application 2024 & 2032
- Figure 5: North America Semiconductor Capacitance Diaphragm Gauge Cdg Revenue Share (%), by Application 2024 & 2032
- Figure 6: North America Semiconductor Capacitance Diaphragm Gauge Cdg Volume Share (%), by Application 2024 & 2032
- Figure 7: North America Semiconductor Capacitance Diaphragm Gauge Cdg Revenue (million), by Type 2024 & 2032
- Figure 8: North America Semiconductor Capacitance Diaphragm Gauge Cdg Volume (K), by Type 2024 & 2032
- Figure 9: North America Semiconductor Capacitance Diaphragm Gauge Cdg Revenue Share (%), by Type 2024 & 2032
- Figure 10: North America Semiconductor Capacitance Diaphragm Gauge Cdg Volume Share (%), by Type 2024 & 2032
- Figure 11: North America Semiconductor Capacitance Diaphragm Gauge Cdg Revenue (million), by Country 2024 & 2032
- Figure 12: North America Semiconductor Capacitance Diaphragm Gauge Cdg Volume (K), by Country 2024 & 2032
- Figure 13: North America Semiconductor Capacitance Diaphragm Gauge Cdg Revenue Share (%), by Country 2024 & 2032
- Figure 14: North America Semiconductor Capacitance Diaphragm Gauge Cdg Volume Share (%), by Country 2024 & 2032
- Figure 15: South America Semiconductor Capacitance Diaphragm Gauge Cdg Revenue (million), by Application 2024 & 2032
- Figure 16: South America Semiconductor Capacitance Diaphragm Gauge Cdg Volume (K), by Application 2024 & 2032
- Figure 17: South America Semiconductor Capacitance Diaphragm Gauge Cdg Revenue Share (%), by Application 2024 & 2032
- Figure 18: South America Semiconductor Capacitance Diaphragm Gauge Cdg Volume Share (%), by Application 2024 & 2032
- Figure 19: South America Semiconductor Capacitance Diaphragm Gauge Cdg Revenue (million), by Type 2024 & 2032
- Figure 20: South America Semiconductor Capacitance Diaphragm Gauge Cdg Volume (K), by Type 2024 & 2032
- Figure 21: South America Semiconductor Capacitance Diaphragm Gauge Cdg Revenue Share (%), by Type 2024 & 2032
- Figure 22: South America Semiconductor Capacitance Diaphragm Gauge Cdg Volume Share (%), by Type 2024 & 2032
- Figure 23: South America Semiconductor Capacitance Diaphragm Gauge Cdg Revenue (million), by Country 2024 & 2032
- Figure 24: South America Semiconductor Capacitance Diaphragm Gauge Cdg Volume (K), by Country 2024 & 2032
- Figure 25: South America Semiconductor Capacitance Diaphragm Gauge Cdg Revenue Share (%), by Country 2024 & 2032
- Figure 26: South America Semiconductor Capacitance Diaphragm Gauge Cdg Volume Share (%), by Country 2024 & 2032
- Figure 27: Europe Semiconductor Capacitance Diaphragm Gauge Cdg Revenue (million), by Application 2024 & 2032
- Figure 28: Europe Semiconductor Capacitance Diaphragm Gauge Cdg Volume (K), by Application 2024 & 2032
- Figure 29: Europe Semiconductor Capacitance Diaphragm Gauge Cdg Revenue Share (%), by Application 2024 & 2032
- Figure 30: Europe Semiconductor Capacitance Diaphragm Gauge Cdg Volume Share (%), by Application 2024 & 2032
- Figure 31: Europe Semiconductor Capacitance Diaphragm Gauge Cdg Revenue (million), by Type 2024 & 2032
- Figure 32: Europe Semiconductor Capacitance Diaphragm Gauge Cdg Volume (K), by Type 2024 & 2032
- Figure 33: Europe Semiconductor Capacitance Diaphragm Gauge Cdg Revenue Share (%), by Type 2024 & 2032
- Figure 34: Europe Semiconductor Capacitance Diaphragm Gauge Cdg Volume Share (%), by Type 2024 & 2032
- Figure 35: Europe Semiconductor Capacitance Diaphragm Gauge Cdg Revenue (million), by Country 2024 & 2032
- Figure 36: Europe Semiconductor Capacitance Diaphragm Gauge Cdg Volume (K), by Country 2024 & 2032
- Figure 37: Europe Semiconductor Capacitance Diaphragm Gauge Cdg Revenue Share (%), by Country 2024 & 2032
- Figure 38: Europe Semiconductor Capacitance Diaphragm Gauge Cdg Volume Share (%), by Country 2024 & 2032
- Figure 39: Middle East & Africa Semiconductor Capacitance Diaphragm Gauge Cdg Revenue (million), by Application 2024 & 2032
- Figure 40: Middle East & Africa Semiconductor Capacitance Diaphragm Gauge Cdg Volume (K), by Application 2024 & 2032
- Figure 41: Middle East & Africa Semiconductor Capacitance Diaphragm Gauge Cdg Revenue Share (%), by Application 2024 & 2032
- Figure 42: Middle East & Africa Semiconductor Capacitance Diaphragm Gauge Cdg Volume Share (%), by Application 2024 & 2032
- Figure 43: Middle East & Africa Semiconductor Capacitance Diaphragm Gauge Cdg Revenue (million), by Type 2024 & 2032
- Figure 44: Middle East & Africa Semiconductor Capacitance Diaphragm Gauge Cdg Volume (K), by Type 2024 & 2032
- Figure 45: Middle East & Africa Semiconductor Capacitance Diaphragm Gauge Cdg Revenue Share (%), by Type 2024 & 2032
- Figure 46: Middle East & Africa Semiconductor Capacitance Diaphragm Gauge Cdg Volume Share (%), by Type 2024 & 2032
- Figure 47: Middle East & Africa Semiconductor Capacitance Diaphragm Gauge Cdg Revenue (million), by Country 2024 & 2032
- Figure 48: Middle East & Africa Semiconductor Capacitance Diaphragm Gauge Cdg Volume (K), by Country 2024 & 2032
- Figure 49: Middle East & Africa Semiconductor Capacitance Diaphragm Gauge Cdg Revenue Share (%), by Country 2024 & 2032
- Figure 50: Middle East & Africa Semiconductor Capacitance Diaphragm Gauge Cdg Volume Share (%), by Country 2024 & 2032
- Figure 51: Asia Pacific Semiconductor Capacitance Diaphragm Gauge Cdg Revenue (million), by Application 2024 & 2032
- Figure 52: Asia Pacific Semiconductor Capacitance Diaphragm Gauge Cdg Volume (K), by Application 2024 & 2032
- Figure 53: Asia Pacific Semiconductor Capacitance Diaphragm Gauge Cdg Revenue Share (%), by Application 2024 & 2032
- Figure 54: Asia Pacific Semiconductor Capacitance Diaphragm Gauge Cdg Volume Share (%), by Application 2024 & 2032
- Figure 55: Asia Pacific Semiconductor Capacitance Diaphragm Gauge Cdg Revenue (million), by Type 2024 & 2032
- Figure 56: Asia Pacific Semiconductor Capacitance Diaphragm Gauge Cdg Volume (K), by Type 2024 & 2032
- Figure 57: Asia Pacific Semiconductor Capacitance Diaphragm Gauge Cdg Revenue Share (%), by Type 2024 & 2032
- Figure 58: Asia Pacific Semiconductor Capacitance Diaphragm Gauge Cdg Volume Share (%), by Type 2024 & 2032
- Figure 59: Asia Pacific Semiconductor Capacitance Diaphragm Gauge Cdg Revenue (million), by Country 2024 & 2032
- Figure 60: Asia Pacific Semiconductor Capacitance Diaphragm Gauge Cdg Volume (K), by Country 2024 & 2032
- Figure 61: Asia Pacific Semiconductor Capacitance Diaphragm Gauge Cdg Revenue Share (%), by Country 2024 & 2032
- Figure 62: Asia Pacific Semiconductor Capacitance Diaphragm Gauge Cdg Volume Share (%), by Country 2024 & 2032
List of Tables
- Table 1: Global Semiconductor Capacitance Diaphragm Gauge Cdg Revenue million Forecast, by Region 2019 & 2032
- Table 2: Global Semiconductor Capacitance Diaphragm Gauge Cdg Volume K Forecast, by Region 2019 & 2032
- Table 3: Global Semiconductor Capacitance Diaphragm Gauge Cdg Revenue million Forecast, by Application 2019 & 2032
- Table 4: Global Semiconductor Capacitance Diaphragm Gauge Cdg Volume K Forecast, by Application 2019 & 2032
- Table 5: Global Semiconductor Capacitance Diaphragm Gauge Cdg Revenue million Forecast, by Type 2019 & 2032
- Table 6: Global Semiconductor Capacitance Diaphragm Gauge Cdg Volume K Forecast, by Type 2019 & 2032
- Table 7: Global Semiconductor Capacitance Diaphragm Gauge Cdg Revenue million Forecast, by Region 2019 & 2032
- Table 8: Global Semiconductor Capacitance Diaphragm Gauge Cdg Volume K Forecast, by Region 2019 & 2032
- Table 9: Global Semiconductor Capacitance Diaphragm Gauge Cdg Revenue million Forecast, by Application 2019 & 2032
- Table 10: Global Semiconductor Capacitance Diaphragm Gauge Cdg Volume K Forecast, by Application 2019 & 2032
- Table 11: Global Semiconductor Capacitance Diaphragm Gauge Cdg Revenue million Forecast, by Type 2019 & 2032
- Table 12: Global Semiconductor Capacitance Diaphragm Gauge Cdg Volume K Forecast, by Type 2019 & 2032
- Table 13: Global Semiconductor Capacitance Diaphragm Gauge Cdg Revenue million Forecast, by Country 2019 & 2032
- Table 14: Global Semiconductor Capacitance Diaphragm Gauge Cdg Volume K Forecast, by Country 2019 & 2032
- Table 15: United States Semiconductor Capacitance Diaphragm Gauge Cdg Revenue (million) Forecast, by Application 2019 & 2032
- Table 16: United States Semiconductor Capacitance Diaphragm Gauge Cdg Volume (K) Forecast, by Application 2019 & 2032
- Table 17: Canada Semiconductor Capacitance Diaphragm Gauge Cdg Revenue (million) Forecast, by Application 2019 & 2032
- Table 18: Canada Semiconductor Capacitance Diaphragm Gauge Cdg Volume (K) Forecast, by Application 2019 & 2032
- Table 19: Mexico Semiconductor Capacitance Diaphragm Gauge Cdg Revenue (million) Forecast, by Application 2019 & 2032
- Table 20: Mexico Semiconductor Capacitance Diaphragm Gauge Cdg Volume (K) Forecast, by Application 2019 & 2032
- Table 21: Global Semiconductor Capacitance Diaphragm Gauge Cdg Revenue million Forecast, by Application 2019 & 2032
- Table 22: Global Semiconductor Capacitance Diaphragm Gauge Cdg Volume K Forecast, by Application 2019 & 2032
- Table 23: Global Semiconductor Capacitance Diaphragm Gauge Cdg Revenue million Forecast, by Type 2019 & 2032
- Table 24: Global Semiconductor Capacitance Diaphragm Gauge Cdg Volume K Forecast, by Type 2019 & 2032
- Table 25: Global Semiconductor Capacitance Diaphragm Gauge Cdg Revenue million Forecast, by Country 2019 & 2032
- Table 26: Global Semiconductor Capacitance Diaphragm Gauge Cdg Volume K Forecast, by Country 2019 & 2032
- Table 27: Brazil Semiconductor Capacitance Diaphragm Gauge Cdg Revenue (million) Forecast, by Application 2019 & 2032
- Table 28: Brazil Semiconductor Capacitance Diaphragm Gauge Cdg Volume (K) Forecast, by Application 2019 & 2032
- Table 29: Argentina Semiconductor Capacitance Diaphragm Gauge Cdg Revenue (million) Forecast, by Application 2019 & 2032
- Table 30: Argentina Semiconductor Capacitance Diaphragm Gauge Cdg Volume (K) Forecast, by Application 2019 & 2032
- Table 31: Rest of South America Semiconductor Capacitance Diaphragm Gauge Cdg Revenue (million) Forecast, by Application 2019 & 2032
- Table 32: Rest of South America Semiconductor Capacitance Diaphragm Gauge Cdg Volume (K) Forecast, by Application 2019 & 2032
- Table 33: Global Semiconductor Capacitance Diaphragm Gauge Cdg Revenue million Forecast, by Application 2019 & 2032
- Table 34: Global Semiconductor Capacitance Diaphragm Gauge Cdg Volume K Forecast, by Application 2019 & 2032
- Table 35: Global Semiconductor Capacitance Diaphragm Gauge Cdg Revenue million Forecast, by Type 2019 & 2032
- Table 36: Global Semiconductor Capacitance Diaphragm Gauge Cdg Volume K Forecast, by Type 2019 & 2032
- Table 37: Global Semiconductor Capacitance Diaphragm Gauge Cdg Revenue million Forecast, by Country 2019 & 2032
- Table 38: Global Semiconductor Capacitance Diaphragm Gauge Cdg Volume K Forecast, by Country 2019 & 2032
- Table 39: United Kingdom Semiconductor Capacitance Diaphragm Gauge Cdg Revenue (million) Forecast, by Application 2019 & 2032
- Table 40: United Kingdom Semiconductor Capacitance Diaphragm Gauge Cdg Volume (K) Forecast, by Application 2019 & 2032
- Table 41: Germany Semiconductor Capacitance Diaphragm Gauge Cdg Revenue (million) Forecast, by Application 2019 & 2032
- Table 42: Germany Semiconductor Capacitance Diaphragm Gauge Cdg Volume (K) Forecast, by Application 2019 & 2032
- Table 43: France Semiconductor Capacitance Diaphragm Gauge Cdg Revenue (million) Forecast, by Application 2019 & 2032
- Table 44: France Semiconductor Capacitance Diaphragm Gauge Cdg Volume (K) Forecast, by Application 2019 & 2032
- Table 45: Italy Semiconductor Capacitance Diaphragm Gauge Cdg Revenue (million) Forecast, by Application 2019 & 2032
- Table 46: Italy Semiconductor Capacitance Diaphragm Gauge Cdg Volume (K) Forecast, by Application 2019 & 2032
- Table 47: Spain Semiconductor Capacitance Diaphragm Gauge Cdg Revenue (million) Forecast, by Application 2019 & 2032
- Table 48: Spain Semiconductor Capacitance Diaphragm Gauge Cdg Volume (K) Forecast, by Application 2019 & 2032
- Table 49: Russia Semiconductor Capacitance Diaphragm Gauge Cdg Revenue (million) Forecast, by Application 2019 & 2032
- Table 50: Russia Semiconductor Capacitance Diaphragm Gauge Cdg Volume (K) Forecast, by Application 2019 & 2032
- Table 51: Benelux Semiconductor Capacitance Diaphragm Gauge Cdg Revenue (million) Forecast, by Application 2019 & 2032
- Table 52: Benelux Semiconductor Capacitance Diaphragm Gauge Cdg Volume (K) Forecast, by Application 2019 & 2032
- Table 53: Nordics Semiconductor Capacitance Diaphragm Gauge Cdg Revenue (million) Forecast, by Application 2019 & 2032
- Table 54: Nordics Semiconductor Capacitance Diaphragm Gauge Cdg Volume (K) Forecast, by Application 2019 & 2032
- Table 55: Rest of Europe Semiconductor Capacitance Diaphragm Gauge Cdg Revenue (million) Forecast, by Application 2019 & 2032
- Table 56: Rest of Europe Semiconductor Capacitance Diaphragm Gauge Cdg Volume (K) Forecast, by Application 2019 & 2032
- Table 57: Global Semiconductor Capacitance Diaphragm Gauge Cdg Revenue million Forecast, by Application 2019 & 2032
- Table 58: Global Semiconductor Capacitance Diaphragm Gauge Cdg Volume K Forecast, by Application 2019 & 2032
- Table 59: Global Semiconductor Capacitance Diaphragm Gauge Cdg Revenue million Forecast, by Type 2019 & 2032
- Table 60: Global Semiconductor Capacitance Diaphragm Gauge Cdg Volume K Forecast, by Type 2019 & 2032
- Table 61: Global Semiconductor Capacitance Diaphragm Gauge Cdg Revenue million Forecast, by Country 2019 & 2032
- Table 62: Global Semiconductor Capacitance Diaphragm Gauge Cdg Volume K Forecast, by Country 2019 & 2032
- Table 63: Turkey Semiconductor Capacitance Diaphragm Gauge Cdg Revenue (million) Forecast, by Application 2019 & 2032
- Table 64: Turkey Semiconductor Capacitance Diaphragm Gauge Cdg Volume (K) Forecast, by Application 2019 & 2032
- Table 65: Israel Semiconductor Capacitance Diaphragm Gauge Cdg Revenue (million) Forecast, by Application 2019 & 2032
- Table 66: Israel Semiconductor Capacitance Diaphragm Gauge Cdg Volume (K) Forecast, by Application 2019 & 2032
- Table 67: GCC Semiconductor Capacitance Diaphragm Gauge Cdg Revenue (million) Forecast, by Application 2019 & 2032
- Table 68: GCC Semiconductor Capacitance Diaphragm Gauge Cdg Volume (K) Forecast, by Application 2019 & 2032
- Table 69: North Africa Semiconductor Capacitance Diaphragm Gauge Cdg Revenue (million) Forecast, by Application 2019 & 2032
- Table 70: North Africa Semiconductor Capacitance Diaphragm Gauge Cdg Volume (K) Forecast, by Application 2019 & 2032
- Table 71: South Africa Semiconductor Capacitance Diaphragm Gauge Cdg Revenue (million) Forecast, by Application 2019 & 2032
- Table 72: South Africa Semiconductor Capacitance Diaphragm Gauge Cdg Volume (K) Forecast, by Application 2019 & 2032
- Table 73: Rest of Middle East & Africa Semiconductor Capacitance Diaphragm Gauge Cdg Revenue (million) Forecast, by Application 2019 & 2032
- Table 74: Rest of Middle East & Africa Semiconductor Capacitance Diaphragm Gauge Cdg Volume (K) Forecast, by Application 2019 & 2032
- Table 75: Global Semiconductor Capacitance Diaphragm Gauge Cdg Revenue million Forecast, by Application 2019 & 2032
- Table 76: Global Semiconductor Capacitance Diaphragm Gauge Cdg Volume K Forecast, by Application 2019 & 2032
- Table 77: Global Semiconductor Capacitance Diaphragm Gauge Cdg Revenue million Forecast, by Type 2019 & 2032
- Table 78: Global Semiconductor Capacitance Diaphragm Gauge Cdg Volume K Forecast, by Type 2019 & 2032
- Table 79: Global Semiconductor Capacitance Diaphragm Gauge Cdg Revenue million Forecast, by Country 2019 & 2032
- Table 80: Global Semiconductor Capacitance Diaphragm Gauge Cdg Volume K Forecast, by Country 2019 & 2032
- Table 81: China Semiconductor Capacitance Diaphragm Gauge Cdg Revenue (million) Forecast, by Application 2019 & 2032
- Table 82: China Semiconductor Capacitance Diaphragm Gauge Cdg Volume (K) Forecast, by Application 2019 & 2032
- Table 83: India Semiconductor Capacitance Diaphragm Gauge Cdg Revenue (million) Forecast, by Application 2019 & 2032
- Table 84: India Semiconductor Capacitance Diaphragm Gauge Cdg Volume (K) Forecast, by Application 2019 & 2032
- Table 85: Japan Semiconductor Capacitance Diaphragm Gauge Cdg Revenue (million) Forecast, by Application 2019 & 2032
- Table 86: Japan Semiconductor Capacitance Diaphragm Gauge Cdg Volume (K) Forecast, by Application 2019 & 2032
- Table 87: South Korea Semiconductor Capacitance Diaphragm Gauge Cdg Revenue (million) Forecast, by Application 2019 & 2032
- Table 88: South Korea Semiconductor Capacitance Diaphragm Gauge Cdg Volume (K) Forecast, by Application 2019 & 2032
- Table 89: ASEAN Semiconductor Capacitance Diaphragm Gauge Cdg Revenue (million) Forecast, by Application 2019 & 2032
- Table 90: ASEAN Semiconductor Capacitance Diaphragm Gauge Cdg Volume (K) Forecast, by Application 2019 & 2032
- Table 91: Oceania Semiconductor Capacitance Diaphragm Gauge Cdg Revenue (million) Forecast, by Application 2019 & 2032
- Table 92: Oceania Semiconductor Capacitance Diaphragm Gauge Cdg Volume (K) Forecast, by Application 2019 & 2032
- Table 93: Rest of Asia Pacific Semiconductor Capacitance Diaphragm Gauge Cdg Revenue (million) Forecast, by Application 2019 & 2032
- Table 94: Rest of Asia Pacific Semiconductor Capacitance Diaphragm Gauge Cdg Volume (K) Forecast, by Application 2019 & 2032
Frequently Asked Questions
1. What is the projected Compound Annual Growth Rate (CAGR) of the Semiconductor Capacitance Diaphragm Gauge Cdg?
The projected CAGR is approximately 9.3%.
2. Which companies are prominent players in the Semiconductor Capacitance Diaphragm Gauge Cdg?
Key companies in the market include MKS Instruments, INFICON, Atlas Copco (Leybold and Edwards), Pfeiffer Vacuum+Fab Solutions, Setra Systems, Canon Anelva, Brooks Instrument, ZHENTAI INSTRUMENT, ULVAC, Azbil, Agilent, Kurt J. Lesker, EBARA, ASAIR, Atovac, SATO VAC.
3. What are the main segments of the Semiconductor Capacitance Diaphragm Gauge Cdg?
The market segments include Application, Type.
4. Can you provide details about the market size?
The market size is estimated to be USD 139 million as of 2022.
5. What are some drivers contributing to market growth?
N/A
6. What are the notable trends driving market growth?
N/A
7. Are there any restraints impacting market growth?
N/A
8. Can you provide examples of recent developments in the market?
N/A
9. What pricing options are available for accessing the report?
Pricing options include single-user, multi-user, and enterprise licenses priced at USD 3950.00, USD 5925.00, and USD 7900.00 respectively.
10. Is the market size provided in terms of value or volume?
The market size is provided in terms of value, measured in million and volume, measured in K.
11. Are there any specific market keywords associated with the report?
Yes, the market keyword associated with the report is "Semiconductor Capacitance Diaphragm Gauge Cdg," which aids in identifying and referencing the specific market segment covered.
12. How do I determine which pricing option suits my needs best?
The pricing options vary based on user requirements and access needs. Individual users may opt for single-user licenses, while businesses requiring broader access may choose multi-user or enterprise licenses for cost-effective access to the report.
13. Are there any additional resources or data provided in the Semiconductor Capacitance Diaphragm Gauge Cdg report?
While the report offers comprehensive insights, it's advisable to review the specific contents or supplementary materials provided to ascertain if additional resources or data are available.
14. How can I stay updated on further developments or reports in the Semiconductor Capacitance Diaphragm Gauge Cdg?
To stay informed about further developments, trends, and reports in the Semiconductor Capacitance Diaphragm Gauge Cdg, consider subscribing to industry newsletters, following relevant companies and organizations, or regularly checking reputable industry news sources and publications.
Methodology
Step 1 - Identification of Relevant Samples Size from Population Database


Step 2 - Approaches for Defining Global Market Size (Value, Volume* & Price*)

Note*: In applicable scenarios
Step 3 - Data Sources
Primary Research
- Web Analytics
- Survey Reports
- Research Institute
- Latest Research Reports
- Opinion Leaders
Secondary Research
- Annual Reports
- White Paper
- Latest Press Release
- Industry Association
- Paid Database
- Investor Presentations

Step 4 - Data Triangulation
Involves using different sources of information in order to increase the validity of a study
These sources are likely to be stakeholders in a program - participants, other researchers, program staff, other community members, and so on.
Then we put all data in single framework & apply various statistical tools to find out the dynamic on the market.
During the analysis stage, feedback from the stakeholder groups would be compared to determine areas of agreement as well as areas of divergence
