

Key Insights
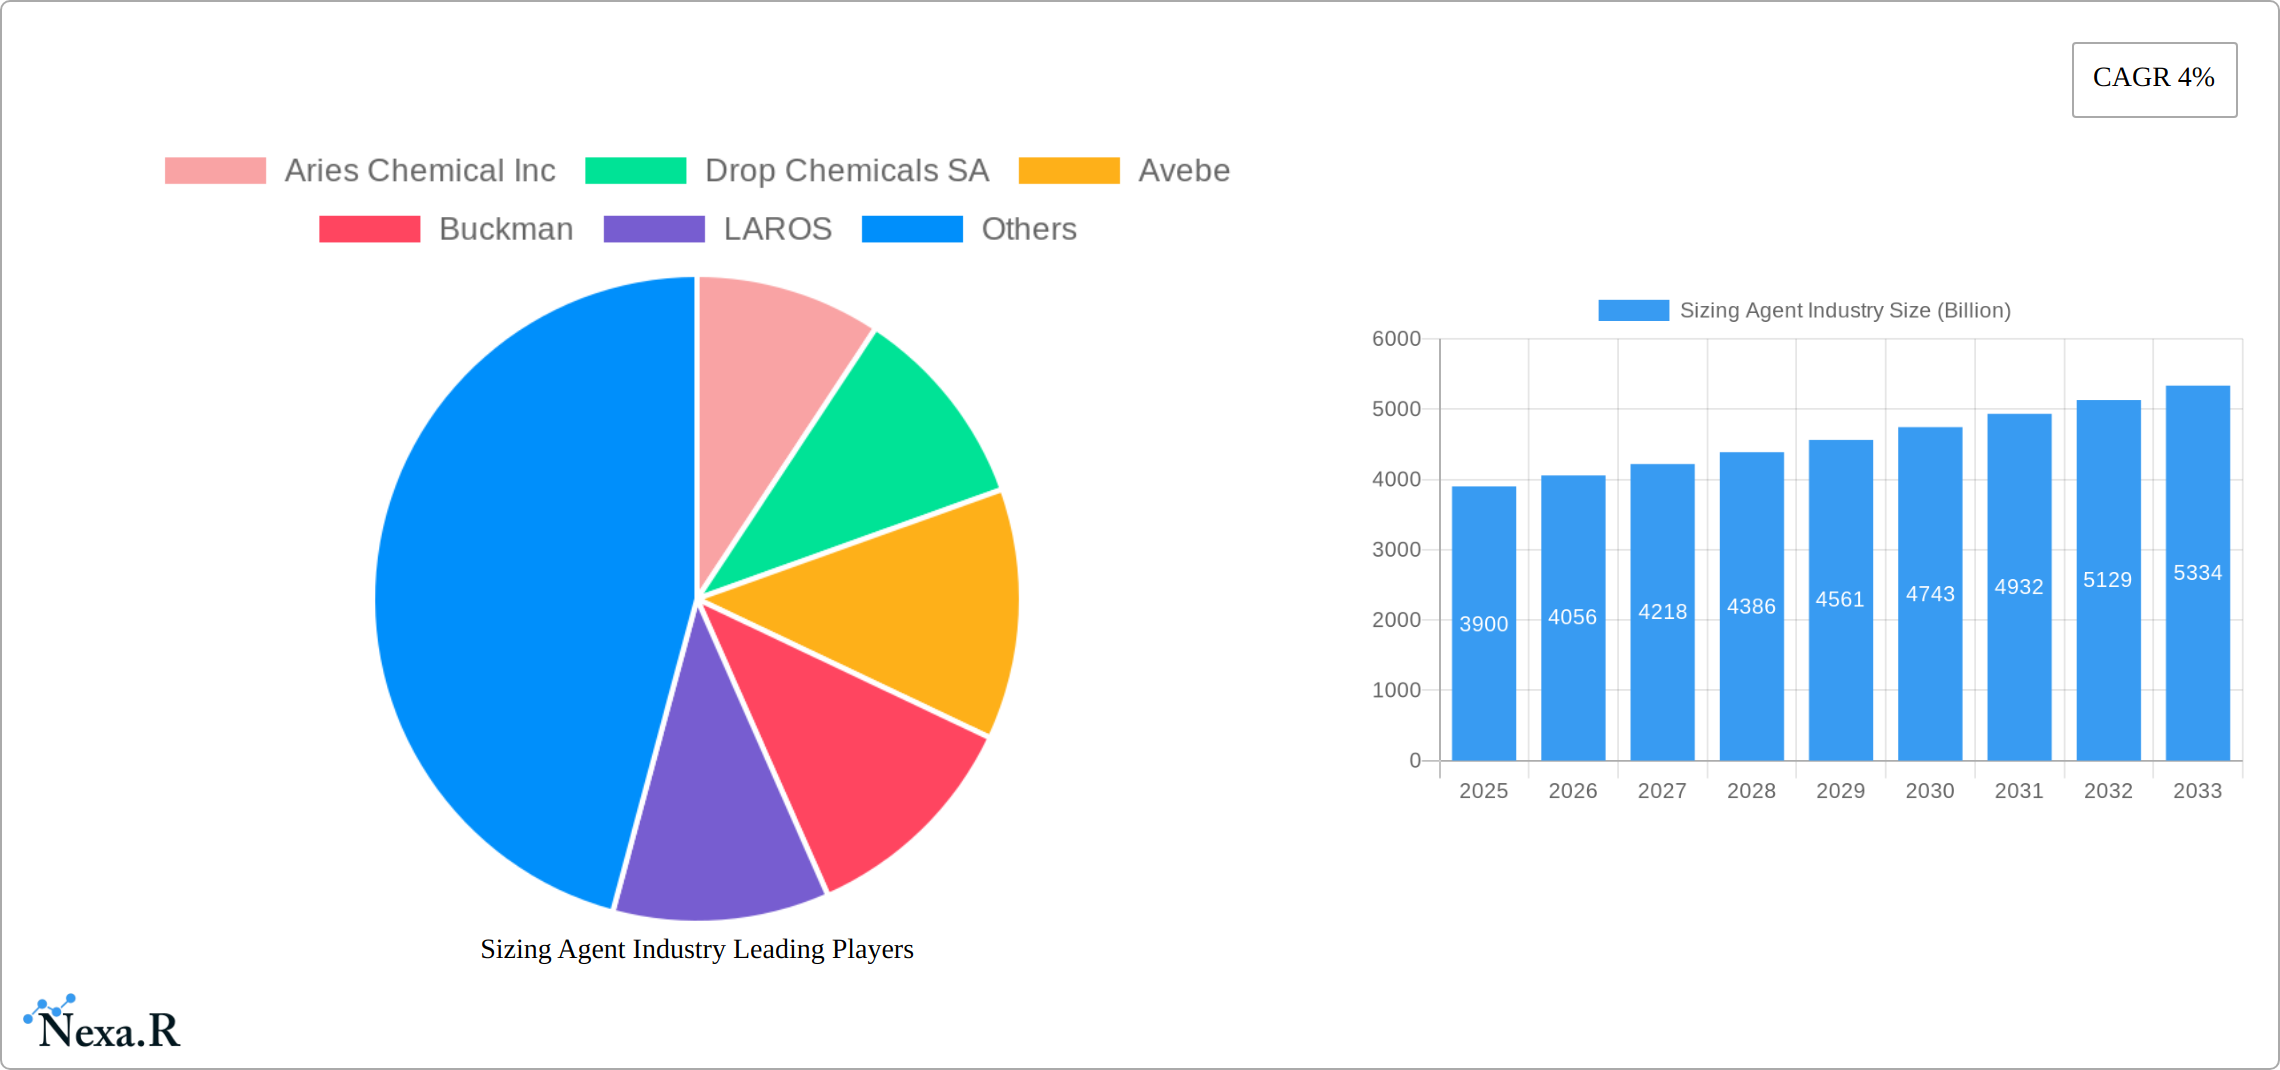
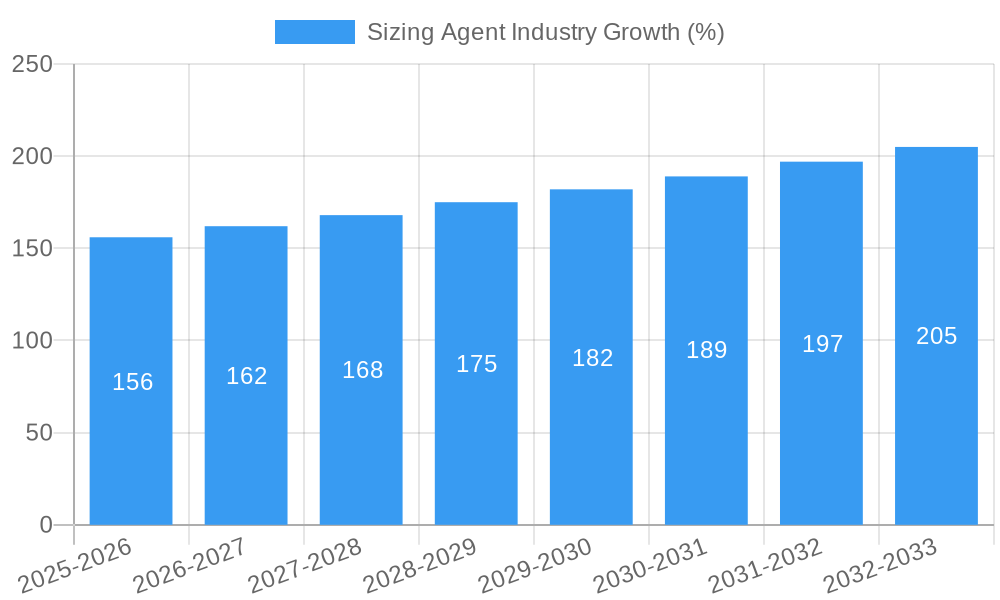
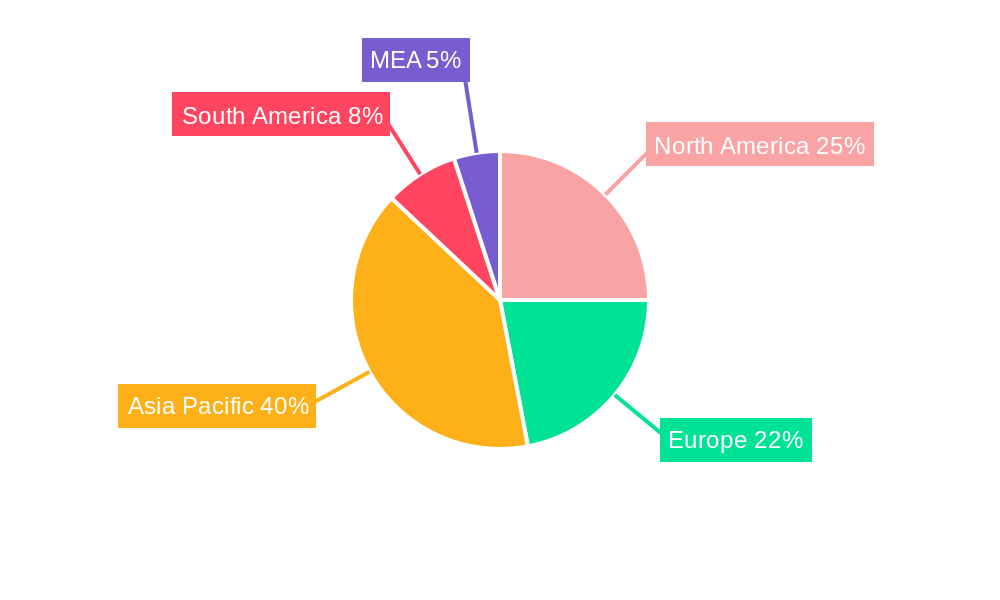
The global sizing agent market, valued at $3.9 billion in 2025, is projected to experience robust growth, driven by a compound annual growth rate (CAGR) of 4% from 2025 to 2033. This expansion is fueled by several key factors. The increasing demand for high-quality textiles, paper products, and construction materials necessitates the use of efficient sizing agents to enhance their properties. Furthermore, the growing emphasis on sustainable and eco-friendly practices is pushing the adoption of natural sizing agents, contributing to market growth. Technological advancements in sizing techniques, including the development of advanced sizing methods offering improved performance and reduced environmental impact, are also significant drivers. The diverse applications of sizing agents across various industries, including textile & fiber, paper & paperboard, cosmetics, food & beverage, construction, and pharmaceuticals, contribute to the market's broad appeal. Regional variations in growth are expected, with Asia-Pacific likely to dominate due to its large manufacturing base and increasing industrialization. However, North America and Europe are anticipated to maintain significant market shares, fueled by continuous innovations and stringent quality standards.
The competitive landscape is characterized by a mix of large multinational corporations and smaller regional players. Companies like Solenis, Buckman, and Avebe hold significant market positions due to their extensive product portfolios and global reach. However, the market also provides opportunities for smaller companies specializing in niche applications or sustainable solutions. The future growth of the sizing agent market will depend on factors such as raw material prices, technological innovations, regulatory changes concerning environmental sustainability, and the overall economic conditions in key regions. Further segmentation analysis indicates that liquid sizing agents currently hold a larger market share than powder or paste forms, due to ease of application and versatility. Within the types segment, synthetic sizing agents may show slightly faster growth than natural ones due to their superior performance in specific applications, despite the growing preference for eco-friendly options.
Sizing Agent Industry Market Report: 2019-2033
This comprehensive report provides an in-depth analysis of the global sizing agent market, encompassing market dynamics, growth trends, regional segmentation, product landscape, key players, and future outlook. With a study period spanning 2019-2033, a base year of 2025, and a forecast period of 2025-2033, this report offers invaluable insights for industry professionals, investors, and stakeholders seeking to navigate this evolving market. The market is valued at xx Billion in 2025 and is projected to reach xx Billion by 2033.
Sizing Agent Industry Market Dynamics & Structure
The global sizing agent market exhibits a moderately concentrated structure, with key players holding significant market share. Technological innovation, particularly in advanced sizing techniques, is a major driver, alongside stringent regulatory frameworks concerning environmental impact and product safety. Competition from substitute materials and evolving end-user demographics significantly influence market dynamics. Furthermore, mergers and acquisitions (M&A) activity has been moderate, with xx deals recorded between 2019 and 2024, primarily focused on expanding product portfolios and geographical reach.
- Market Concentration: Moderately concentrated, with top 5 players holding approximately xx% market share in 2025.
- Technological Innovation: Focus on sustainable, high-performance sizing agents is driving innovation.
- Regulatory Landscape: Stringent environmental regulations are influencing product development and manufacturing processes.
- Competitive Substitutes: Bio-based sizing agents are emerging as viable alternatives to synthetic options.
- M&A Activity: xx deals recorded between 2019 and 2024, reflecting consolidation and expansion strategies.
- End-User Demographics: Shifting consumer preferences towards sustainable and eco-friendly products are influencing demand.
Sizing Agent Industry Growth Trends & Insights
The sizing agent market has witnessed robust growth over the historical period (2019-2024), driven by increasing demand across various end-use industries, notably textile & fiber, paper & paperboard, and construction. The market exhibited a CAGR of xx% during this period. Technological advancements, specifically in advanced sizing techniques, have accelerated adoption rates and improved product performance. Consumer behavior shifts towards sustainable products are further fueling market growth. The market is projected to maintain a healthy CAGR of xx% during the forecast period (2025-2033), driven by factors such as increasing urbanization, rising disposable incomes, and expanding industrialization. Market penetration for advanced sizing techniques is expected to reach xx% by 2033.
Dominant Regions, Countries, or Segments in Sizing Agent Industry
The Asia-Pacific region currently dominates the global sizing agent market, driven by rapid industrialization, significant growth in the textile and paper industries, and supportive government policies. Within this region, China and India are leading markets. The Textile & Fiber segment holds the largest market share by application, followed by Paper & Paperboard. Synthetic sizing agents represent the largest segment by type, owing to their cost-effectiveness and superior performance characteristics in several applications. Conventional sizing techniques currently dominate the market; however, advanced sizing is witnessing faster growth, owing to its superior performance features. Liquid form dominates the market by form, with high demand from the textile and paper industries.
- Key Drivers (Asia-Pacific): Rapid industrialization, expanding textile and paper industries, government initiatives promoting manufacturing.
- Dominance Factors: High production capacity, cost-effective manufacturing, strong consumer base.
- Growth Potential: Untapped markets in Southeast Asia and increased adoption of advanced sizing techniques.
- Leading Segments: Textile & Fiber (Application), Synthetic (Type), Liquid (Form), Conventional Sizing (Technique).
Sizing Agent Industry Product Landscape
The sizing agent market offers a diverse range of products catering to specific applications and performance requirements. Recent innovations focus on developing eco-friendly, high-performance sizing agents with improved adhesion, strength, and water resistance. Product differentiation is driven by unique selling propositions such as enhanced biodegradability, reduced environmental impact, and superior processability. Technological advancements include the use of nanotechnology and bio-based materials in sizing agent formulations.
Key Drivers, Barriers & Challenges in Sizing Agent Industry
Key Drivers: Increasing demand from various end-use industries, particularly the construction and textile sectors, coupled with technological advancements in advanced sizing techniques. Growing consumer preference for sustainable products and government initiatives promoting green technologies further drive the market.
Challenges: Fluctuations in raw material prices, stringent environmental regulations, and intense competition among existing players pose significant challenges to market growth. Supply chain disruptions also create significant hurdles, particularly in obtaining specialized raw materials. The impact of these factors on profitability is estimated to be approximately xx%.
Emerging Opportunities in Sizing Agent Industry
Emerging opportunities lie in the development and application of bio-based and sustainable sizing agents. Untapped markets in developing economies, particularly in Africa and South America, present significant potential. Innovation in advanced sizing techniques, such as nanotechnology and microencapsulation, offer further opportunities for growth. Evolving consumer preferences towards eco-friendly products will drive the demand for sustainable sizing agents.
Growth Accelerators in the Sizing Agent Industry
Technological breakthroughs in formulating high-performance, sustainable sizing agents are key drivers for long-term growth. Strategic partnerships between raw material suppliers and sizing agent manufacturers can further boost market expansion. Investment in R&D activities, focused on developing eco-friendly and customized sizing solutions, will be crucial. Global market expansion through strategic alliances and acquisitions will strengthen the position of key players.
Key Players Shaping the Sizing Agent Industry Market
- Aries Chemical Inc
- Drop Chemicals SA
- Avebe
- Buckman
- LAROS
- Refnol Resins & Chemicals Ltd
- Eco Polychem Pvt Ltd
- Huixian Tiankai Paper Making Agent Co Ltd
- Angel Starch & Food Private Limited
- Harima Chemicals Group Inc
- Associated Chemical
- Finor Piplaj Chemical Limited
- MATANGI INTERNATIONAL
- Solenis
- Mare SpA
Notable Milestones in Sizing Agent Industry Sector
- 2020: Introduction of a bio-based sizing agent by Avebe, reducing environmental impact.
- 2022: Merger between two key players in the Asian market, leading to increased market share.
- 2023: Launch of a new advanced sizing technique by Buckman, enhancing product performance.
- 2024: Implementation of stricter environmental regulations in Europe, driving innovation in sustainable sizing agents.
In-Depth Sizing Agent Industry Market Outlook
The sizing agent market is poised for continued growth, driven by technological advancements and increasing demand across diverse end-use industries. Strategic investments in R&D, focused on developing sustainable and high-performance sizing agents, will be critical to maintaining market competitiveness. Expansion into emerging markets and strategic alliances will further enhance market opportunities. The future growth potential is significant, driven by the increasing demand for sustainable materials and the continuous evolution of technological advancements in the industry.
Sizing Agent Industry Segmentation
-
1. Type
- 1.1. Natural
- 1.2. Synthetic
-
2. Application
- 2.1. Textiles
- 2.2. Paper and Paper Board
- 2.3. Food and Beverage
- 2.4. Other Applications
Sizing Agent Industry Segmentation By Geography
-
1. Asia Pacific
- 1.1. China
- 1.2. India
- 1.3. Japan
- 1.4. South Korea
- 1.5. Rest of Asia Pacific
-
2. North America
- 2.1. United States
- 2.2. Canada
- 2.3. Mexico
-
3. Europe
- 3.1. Germany
- 3.2. United Kingdom
- 3.3. Italy
- 3.4. France
- 3.5. Rest of Europe
-
4. South America
- 4.1. Brazil
- 4.2. Argentina
- 4.3. Rest of South America
-
5. Middle East and Africa
- 5.1. Saudi Arabia
- 5.2. South Africa
- 5.3. Rest of Middle East and Africa
Sizing Agent Industry REPORT HIGHLIGHTS
| Aspects | Details |
|---|---|
| Study Period | 2019-2033 |
| Base Year | 2024 |
| Estimated Year | 2025 |
| Forecast Period | 2025-2033 |
| Historical Period | 2019-2024 |
| Growth Rate | CAGR of 4% from 2019-2033 |
| Segmentation |
|
Table of Contents
- 1. Introduction
- 1.1. Research Scope
- 1.2. Market Segmentation
- 1.3. Research Methodology
- 1.4. Definitions and Assumptions
- 2. Executive Summary
- 2.1. Introduction
- 3. Market Dynamics
- 3.1. Introduction
- 3.2. Market Drivers
- 3.2.1. ; Growing Demand from the Textile Industry; Increasing Demand from the Paper Manufacturing Industries
- 3.3. Market Restrains
- 3.3.1. ; Stringent Environmental Regulations; Unfavorable Conditions Arising Due to the COVID-19 Outbreak
- 3.4. Market Trends
- 3.4.1. Growing Demand from the Textile Manufacturing Industry
- 4. Market Factor Analysis
- 4.1. Porters Five Forces
- 4.2. Supply/Value Chain
- 4.3. PESTEL analysis
- 4.4. Market Entropy
- 4.5. Patent/Trademark Analysis
- 5. Global Sizing Agent Industry Analysis, Insights and Forecast, 2019-2031
- 5.1. Market Analysis, Insights and Forecast - by Type
- 5.1.1. Natural
- 5.1.2. Synthetic
- 5.2. Market Analysis, Insights and Forecast - by Application
- 5.2.1. Textiles
- 5.2.2. Paper and Paper Board
- 5.2.3. Food and Beverage
- 5.2.4. Other Applications
- 5.3. Market Analysis, Insights and Forecast - by Region
- 5.3.1. Asia Pacific
- 5.3.2. North America
- 5.3.3. Europe
- 5.3.4. South America
- 5.3.5. Middle East and Africa
- 5.1. Market Analysis, Insights and Forecast - by Type
- 6. Asia Pacific Sizing Agent Industry Analysis, Insights and Forecast, 2019-2031
- 6.1. Market Analysis, Insights and Forecast - by Type
- 6.1.1. Natural
- 6.1.2. Synthetic
- 6.2. Market Analysis, Insights and Forecast - by Application
- 6.2.1. Textiles
- 6.2.2. Paper and Paper Board
- 6.2.3. Food and Beverage
- 6.2.4. Other Applications
- 6.1. Market Analysis, Insights and Forecast - by Type
- 7. North America Sizing Agent Industry Analysis, Insights and Forecast, 2019-2031
- 7.1. Market Analysis, Insights and Forecast - by Type
- 7.1.1. Natural
- 7.1.2. Synthetic
- 7.2. Market Analysis, Insights and Forecast - by Application
- 7.2.1. Textiles
- 7.2.2. Paper and Paper Board
- 7.2.3. Food and Beverage
- 7.2.4. Other Applications
- 7.1. Market Analysis, Insights and Forecast - by Type
- 8. Europe Sizing Agent Industry Analysis, Insights and Forecast, 2019-2031
- 8.1. Market Analysis, Insights and Forecast - by Type
- 8.1.1. Natural
- 8.1.2. Synthetic
- 8.2. Market Analysis, Insights and Forecast - by Application
- 8.2.1. Textiles
- 8.2.2. Paper and Paper Board
- 8.2.3. Food and Beverage
- 8.2.4. Other Applications
- 8.1. Market Analysis, Insights and Forecast - by Type
- 9. South America Sizing Agent Industry Analysis, Insights and Forecast, 2019-2031
- 9.1. Market Analysis, Insights and Forecast - by Type
- 9.1.1. Natural
- 9.1.2. Synthetic
- 9.2. Market Analysis, Insights and Forecast - by Application
- 9.2.1. Textiles
- 9.2.2. Paper and Paper Board
- 9.2.3. Food and Beverage
- 9.2.4. Other Applications
- 9.1. Market Analysis, Insights and Forecast - by Type
- 10. Middle East and Africa Sizing Agent Industry Analysis, Insights and Forecast, 2019-2031
- 10.1. Market Analysis, Insights and Forecast - by Type
- 10.1.1. Natural
- 10.1.2. Synthetic
- 10.2. Market Analysis, Insights and Forecast - by Application
- 10.2.1. Textiles
- 10.2.2. Paper and Paper Board
- 10.2.3. Food and Beverage
- 10.2.4. Other Applications
- 10.1. Market Analysis, Insights and Forecast - by Type
- 11. North America Sizing Agent Industry Analysis, Insights and Forecast, 2019-2031
- 11.1. Market Analysis, Insights and Forecast - By Country/Sub-region
- 11.1.1 United States
- 11.1.2 Canada
- 11.1.3 Mexico
- 12. Europe Sizing Agent Industry Analysis, Insights and Forecast, 2019-2031
- 12.1. Market Analysis, Insights and Forecast - By Country/Sub-region
- 12.1.1 Germany
- 12.1.2 France
- 12.1.3 Italy
- 12.1.4 United Kingdom
- 12.1.5 Netherlands
- 12.1.6 Rest of Europe
- 13. Asia Pacific Sizing Agent Industry Analysis, Insights and Forecast, 2019-2031
- 13.1. Market Analysis, Insights and Forecast - By Country/Sub-region
- 13.1.1 China
- 13.1.2 Japan
- 13.1.3 India
- 13.1.4 South Korea
- 13.1.5 Taiwan
- 13.1.6 Australia
- 13.1.7 Rest of Asia-Pacific
- 14. South America Sizing Agent Industry Analysis, Insights and Forecast, 2019-2031
- 14.1. Market Analysis, Insights and Forecast - By Country/Sub-region
- 14.1.1 Brazil
- 14.1.2 Argentina
- 14.1.3 Rest of South America
- 15. MEA Sizing Agent Industry Analysis, Insights and Forecast, 2019-2031
- 15.1. Market Analysis, Insights and Forecast - By Country/Sub-region
- 15.1.1 Middle East
- 15.1.2 Africa
- 16. Competitive Analysis
- 16.1. Global Market Share Analysis 2024
- 16.2. Company Profiles
- 16.2.1 Aries Chemical Inc
- 16.2.1.1. Overview
- 16.2.1.2. Products
- 16.2.1.3. SWOT Analysis
- 16.2.1.4. Recent Developments
- 16.2.1.5. Financials (Based on Availability)
- 16.2.2 Drop Chemicals SA
- 16.2.2.1. Overview
- 16.2.2.2. Products
- 16.2.2.3. SWOT Analysis
- 16.2.2.4. Recent Developments
- 16.2.2.5. Financials (Based on Availability)
- 16.2.3 Avebe
- 16.2.3.1. Overview
- 16.2.3.2. Products
- 16.2.3.3. SWOT Analysis
- 16.2.3.4. Recent Developments
- 16.2.3.5. Financials (Based on Availability)
- 16.2.4 Buckman
- 16.2.4.1. Overview
- 16.2.4.2. Products
- 16.2.4.3. SWOT Analysis
- 16.2.4.4. Recent Developments
- 16.2.4.5. Financials (Based on Availability)
- 16.2.5 LAROS
- 16.2.5.1. Overview
- 16.2.5.2. Products
- 16.2.5.3. SWOT Analysis
- 16.2.5.4. Recent Developments
- 16.2.5.5. Financials (Based on Availability)
- 16.2.6 Refnol Resins & Chemicals Ltd
- 16.2.6.1. Overview
- 16.2.6.2. Products
- 16.2.6.3. SWOT Analysis
- 16.2.6.4. Recent Developments
- 16.2.6.5. Financials (Based on Availability)
- 16.2.7 Eco Polychem Pvt Ltd
- 16.2.7.1. Overview
- 16.2.7.2. Products
- 16.2.7.3. SWOT Analysis
- 16.2.7.4. Recent Developments
- 16.2.7.5. Financials (Based on Availability)
- 16.2.8 Huixian Tiankai Paper Making Agent Co Ltd
- 16.2.8.1. Overview
- 16.2.8.2. Products
- 16.2.8.3. SWOT Analysis
- 16.2.8.4. Recent Developments
- 16.2.8.5. Financials (Based on Availability)
- 16.2.9 Angel Starch & Food Private Limited
- 16.2.9.1. Overview
- 16.2.9.2. Products
- 16.2.9.3. SWOT Analysis
- 16.2.9.4. Recent Developments
- 16.2.9.5. Financials (Based on Availability)
- 16.2.10 Harima Chemicals Group Inc
- 16.2.10.1. Overview
- 16.2.10.2. Products
- 16.2.10.3. SWOT Analysis
- 16.2.10.4. Recent Developments
- 16.2.10.5. Financials (Based on Availability)
- 16.2.11 Associated Chemical
- 16.2.11.1. Overview
- 16.2.11.2. Products
- 16.2.11.3. SWOT Analysis
- 16.2.11.4. Recent Developments
- 16.2.11.5. Financials (Based on Availability)
- 16.2.12 Finor Piplaj Chemical Limited
- 16.2.12.1. Overview
- 16.2.12.2. Products
- 16.2.12.3. SWOT Analysis
- 16.2.12.4. Recent Developments
- 16.2.12.5. Financials (Based on Availability)
- 16.2.13 MATANGI INTERNATIONAL
- 16.2.13.1. Overview
- 16.2.13.2. Products
- 16.2.13.3. SWOT Analysis
- 16.2.13.4. Recent Developments
- 16.2.13.5. Financials (Based on Availability)
- 16.2.14 Solenis
- 16.2.14.1. Overview
- 16.2.14.2. Products
- 16.2.14.3. SWOT Analysis
- 16.2.14.4. Recent Developments
- 16.2.14.5. Financials (Based on Availability)
- 16.2.15 Mare SpA
- 16.2.15.1. Overview
- 16.2.15.2. Products
- 16.2.15.3. SWOT Analysis
- 16.2.15.4. Recent Developments
- 16.2.15.5. Financials (Based on Availability)
- 16.2.1 Aries Chemical Inc
List of Figures
- Figure 1: Global Sizing Agent Industry Revenue Breakdown (Billion, %) by Region 2024 & 2032
- Figure 2: Global Sizing Agent Industry Volume Breakdown (K Tons, %) by Region 2024 & 2032
- Figure 3: North America Sizing Agent Industry Revenue (Billion), by Country 2024 & 2032
- Figure 4: North America Sizing Agent Industry Volume (K Tons), by Country 2024 & 2032
- Figure 5: North America Sizing Agent Industry Revenue Share (%), by Country 2024 & 2032
- Figure 6: North America Sizing Agent Industry Volume Share (%), by Country 2024 & 2032
- Figure 7: Europe Sizing Agent Industry Revenue (Billion), by Country 2024 & 2032
- Figure 8: Europe Sizing Agent Industry Volume (K Tons), by Country 2024 & 2032
- Figure 9: Europe Sizing Agent Industry Revenue Share (%), by Country 2024 & 2032
- Figure 10: Europe Sizing Agent Industry Volume Share (%), by Country 2024 & 2032
- Figure 11: Asia Pacific Sizing Agent Industry Revenue (Billion), by Country 2024 & 2032
- Figure 12: Asia Pacific Sizing Agent Industry Volume (K Tons), by Country 2024 & 2032
- Figure 13: Asia Pacific Sizing Agent Industry Revenue Share (%), by Country 2024 & 2032
- Figure 14: Asia Pacific Sizing Agent Industry Volume Share (%), by Country 2024 & 2032
- Figure 15: South America Sizing Agent Industry Revenue (Billion), by Country 2024 & 2032
- Figure 16: South America Sizing Agent Industry Volume (K Tons), by Country 2024 & 2032
- Figure 17: South America Sizing Agent Industry Revenue Share (%), by Country 2024 & 2032
- Figure 18: South America Sizing Agent Industry Volume Share (%), by Country 2024 & 2032
- Figure 19: MEA Sizing Agent Industry Revenue (Billion), by Country 2024 & 2032
- Figure 20: MEA Sizing Agent Industry Volume (K Tons), by Country 2024 & 2032
- Figure 21: MEA Sizing Agent Industry Revenue Share (%), by Country 2024 & 2032
- Figure 22: MEA Sizing Agent Industry Volume Share (%), by Country 2024 & 2032
- Figure 23: Asia Pacific Sizing Agent Industry Revenue (Billion), by Type 2024 & 2032
- Figure 24: Asia Pacific Sizing Agent Industry Volume (K Tons), by Type 2024 & 2032
- Figure 25: Asia Pacific Sizing Agent Industry Revenue Share (%), by Type 2024 & 2032
- Figure 26: Asia Pacific Sizing Agent Industry Volume Share (%), by Type 2024 & 2032
- Figure 27: Asia Pacific Sizing Agent Industry Revenue (Billion), by Application 2024 & 2032
- Figure 28: Asia Pacific Sizing Agent Industry Volume (K Tons), by Application 2024 & 2032
- Figure 29: Asia Pacific Sizing Agent Industry Revenue Share (%), by Application 2024 & 2032
- Figure 30: Asia Pacific Sizing Agent Industry Volume Share (%), by Application 2024 & 2032
- Figure 31: Asia Pacific Sizing Agent Industry Revenue (Billion), by Country 2024 & 2032
- Figure 32: Asia Pacific Sizing Agent Industry Volume (K Tons), by Country 2024 & 2032
- Figure 33: Asia Pacific Sizing Agent Industry Revenue Share (%), by Country 2024 & 2032
- Figure 34: Asia Pacific Sizing Agent Industry Volume Share (%), by Country 2024 & 2032
- Figure 35: North America Sizing Agent Industry Revenue (Billion), by Type 2024 & 2032
- Figure 36: North America Sizing Agent Industry Volume (K Tons), by Type 2024 & 2032
- Figure 37: North America Sizing Agent Industry Revenue Share (%), by Type 2024 & 2032
- Figure 38: North America Sizing Agent Industry Volume Share (%), by Type 2024 & 2032
- Figure 39: North America Sizing Agent Industry Revenue (Billion), by Application 2024 & 2032
- Figure 40: North America Sizing Agent Industry Volume (K Tons), by Application 2024 & 2032
- Figure 41: North America Sizing Agent Industry Revenue Share (%), by Application 2024 & 2032
- Figure 42: North America Sizing Agent Industry Volume Share (%), by Application 2024 & 2032
- Figure 43: North America Sizing Agent Industry Revenue (Billion), by Country 2024 & 2032
- Figure 44: North America Sizing Agent Industry Volume (K Tons), by Country 2024 & 2032
- Figure 45: North America Sizing Agent Industry Revenue Share (%), by Country 2024 & 2032
- Figure 46: North America Sizing Agent Industry Volume Share (%), by Country 2024 & 2032
- Figure 47: Europe Sizing Agent Industry Revenue (Billion), by Type 2024 & 2032
- Figure 48: Europe Sizing Agent Industry Volume (K Tons), by Type 2024 & 2032
- Figure 49: Europe Sizing Agent Industry Revenue Share (%), by Type 2024 & 2032
- Figure 50: Europe Sizing Agent Industry Volume Share (%), by Type 2024 & 2032
- Figure 51: Europe Sizing Agent Industry Revenue (Billion), by Application 2024 & 2032
- Figure 52: Europe Sizing Agent Industry Volume (K Tons), by Application 2024 & 2032
- Figure 53: Europe Sizing Agent Industry Revenue Share (%), by Application 2024 & 2032
- Figure 54: Europe Sizing Agent Industry Volume Share (%), by Application 2024 & 2032
- Figure 55: Europe Sizing Agent Industry Revenue (Billion), by Country 2024 & 2032
- Figure 56: Europe Sizing Agent Industry Volume (K Tons), by Country 2024 & 2032
- Figure 57: Europe Sizing Agent Industry Revenue Share (%), by Country 2024 & 2032
- Figure 58: Europe Sizing Agent Industry Volume Share (%), by Country 2024 & 2032
- Figure 59: South America Sizing Agent Industry Revenue (Billion), by Type 2024 & 2032
- Figure 60: South America Sizing Agent Industry Volume (K Tons), by Type 2024 & 2032
- Figure 61: South America Sizing Agent Industry Revenue Share (%), by Type 2024 & 2032
- Figure 62: South America Sizing Agent Industry Volume Share (%), by Type 2024 & 2032
- Figure 63: South America Sizing Agent Industry Revenue (Billion), by Application 2024 & 2032
- Figure 64: South America Sizing Agent Industry Volume (K Tons), by Application 2024 & 2032
- Figure 65: South America Sizing Agent Industry Revenue Share (%), by Application 2024 & 2032
- Figure 66: South America Sizing Agent Industry Volume Share (%), by Application 2024 & 2032
- Figure 67: South America Sizing Agent Industry Revenue (Billion), by Country 2024 & 2032
- Figure 68: South America Sizing Agent Industry Volume (K Tons), by Country 2024 & 2032
- Figure 69: South America Sizing Agent Industry Revenue Share (%), by Country 2024 & 2032
- Figure 70: South America Sizing Agent Industry Volume Share (%), by Country 2024 & 2032
- Figure 71: Middle East and Africa Sizing Agent Industry Revenue (Billion), by Type 2024 & 2032
- Figure 72: Middle East and Africa Sizing Agent Industry Volume (K Tons), by Type 2024 & 2032
- Figure 73: Middle East and Africa Sizing Agent Industry Revenue Share (%), by Type 2024 & 2032
- Figure 74: Middle East and Africa Sizing Agent Industry Volume Share (%), by Type 2024 & 2032
- Figure 75: Middle East and Africa Sizing Agent Industry Revenue (Billion), by Application 2024 & 2032
- Figure 76: Middle East and Africa Sizing Agent Industry Volume (K Tons), by Application 2024 & 2032
- Figure 77: Middle East and Africa Sizing Agent Industry Revenue Share (%), by Application 2024 & 2032
- Figure 78: Middle East and Africa Sizing Agent Industry Volume Share (%), by Application 2024 & 2032
- Figure 79: Middle East and Africa Sizing Agent Industry Revenue (Billion), by Country 2024 & 2032
- Figure 80: Middle East and Africa Sizing Agent Industry Volume (K Tons), by Country 2024 & 2032
- Figure 81: Middle East and Africa Sizing Agent Industry Revenue Share (%), by Country 2024 & 2032
- Figure 82: Middle East and Africa Sizing Agent Industry Volume Share (%), by Country 2024 & 2032
List of Tables
- Table 1: Global Sizing Agent Industry Revenue Billion Forecast, by Region 2019 & 2032
- Table 2: Global Sizing Agent Industry Volume K Tons Forecast, by Region 2019 & 2032
- Table 3: Global Sizing Agent Industry Revenue Billion Forecast, by Type 2019 & 2032
- Table 4: Global Sizing Agent Industry Volume K Tons Forecast, by Type 2019 & 2032
- Table 5: Global Sizing Agent Industry Revenue Billion Forecast, by Application 2019 & 2032
- Table 6: Global Sizing Agent Industry Volume K Tons Forecast, by Application 2019 & 2032
- Table 7: Global Sizing Agent Industry Revenue Billion Forecast, by Region 2019 & 2032
- Table 8: Global Sizing Agent Industry Volume K Tons Forecast, by Region 2019 & 2032
- Table 9: Global Sizing Agent Industry Revenue Billion Forecast, by Country 2019 & 2032
- Table 10: Global Sizing Agent Industry Volume K Tons Forecast, by Country 2019 & 2032
- Table 11: United States Sizing Agent Industry Revenue (Billion) Forecast, by Application 2019 & 2032
- Table 12: United States Sizing Agent Industry Volume (K Tons) Forecast, by Application 2019 & 2032
- Table 13: Canada Sizing Agent Industry Revenue (Billion) Forecast, by Application 2019 & 2032
- Table 14: Canada Sizing Agent Industry Volume (K Tons) Forecast, by Application 2019 & 2032
- Table 15: Mexico Sizing Agent Industry Revenue (Billion) Forecast, by Application 2019 & 2032
- Table 16: Mexico Sizing Agent Industry Volume (K Tons) Forecast, by Application 2019 & 2032
- Table 17: Global Sizing Agent Industry Revenue Billion Forecast, by Country 2019 & 2032
- Table 18: Global Sizing Agent Industry Volume K Tons Forecast, by Country 2019 & 2032
- Table 19: Germany Sizing Agent Industry Revenue (Billion) Forecast, by Application 2019 & 2032
- Table 20: Germany Sizing Agent Industry Volume (K Tons) Forecast, by Application 2019 & 2032
- Table 21: France Sizing Agent Industry Revenue (Billion) Forecast, by Application 2019 & 2032
- Table 22: France Sizing Agent Industry Volume (K Tons) Forecast, by Application 2019 & 2032
- Table 23: Italy Sizing Agent Industry Revenue (Billion) Forecast, by Application 2019 & 2032
- Table 24: Italy Sizing Agent Industry Volume (K Tons) Forecast, by Application 2019 & 2032
- Table 25: United Kingdom Sizing Agent Industry Revenue (Billion) Forecast, by Application 2019 & 2032
- Table 26: United Kingdom Sizing Agent Industry Volume (K Tons) Forecast, by Application 2019 & 2032
- Table 27: Netherlands Sizing Agent Industry Revenue (Billion) Forecast, by Application 2019 & 2032
- Table 28: Netherlands Sizing Agent Industry Volume (K Tons) Forecast, by Application 2019 & 2032
- Table 29: Rest of Europe Sizing Agent Industry Revenue (Billion) Forecast, by Application 2019 & 2032
- Table 30: Rest of Europe Sizing Agent Industry Volume (K Tons) Forecast, by Application 2019 & 2032
- Table 31: Global Sizing Agent Industry Revenue Billion Forecast, by Country 2019 & 2032
- Table 32: Global Sizing Agent Industry Volume K Tons Forecast, by Country 2019 & 2032
- Table 33: China Sizing Agent Industry Revenue (Billion) Forecast, by Application 2019 & 2032
- Table 34: China Sizing Agent Industry Volume (K Tons) Forecast, by Application 2019 & 2032
- Table 35: Japan Sizing Agent Industry Revenue (Billion) Forecast, by Application 2019 & 2032
- Table 36: Japan Sizing Agent Industry Volume (K Tons) Forecast, by Application 2019 & 2032
- Table 37: India Sizing Agent Industry Revenue (Billion) Forecast, by Application 2019 & 2032
- Table 38: India Sizing Agent Industry Volume (K Tons) Forecast, by Application 2019 & 2032
- Table 39: South Korea Sizing Agent Industry Revenue (Billion) Forecast, by Application 2019 & 2032
- Table 40: South Korea Sizing Agent Industry Volume (K Tons) Forecast, by Application 2019 & 2032
- Table 41: Taiwan Sizing Agent Industry Revenue (Billion) Forecast, by Application 2019 & 2032
- Table 42: Taiwan Sizing Agent Industry Volume (K Tons) Forecast, by Application 2019 & 2032
- Table 43: Australia Sizing Agent Industry Revenue (Billion) Forecast, by Application 2019 & 2032
- Table 44: Australia Sizing Agent Industry Volume (K Tons) Forecast, by Application 2019 & 2032
- Table 45: Rest of Asia-Pacific Sizing Agent Industry Revenue (Billion) Forecast, by Application 2019 & 2032
- Table 46: Rest of Asia-Pacific Sizing Agent Industry Volume (K Tons) Forecast, by Application 2019 & 2032
- Table 47: Global Sizing Agent Industry Revenue Billion Forecast, by Country 2019 & 2032
- Table 48: Global Sizing Agent Industry Volume K Tons Forecast, by Country 2019 & 2032
- Table 49: Brazil Sizing Agent Industry Revenue (Billion) Forecast, by Application 2019 & 2032
- Table 50: Brazil Sizing Agent Industry Volume (K Tons) Forecast, by Application 2019 & 2032
- Table 51: Argentina Sizing Agent Industry Revenue (Billion) Forecast, by Application 2019 & 2032
- Table 52: Argentina Sizing Agent Industry Volume (K Tons) Forecast, by Application 2019 & 2032
- Table 53: Rest of South America Sizing Agent Industry Revenue (Billion) Forecast, by Application 2019 & 2032
- Table 54: Rest of South America Sizing Agent Industry Volume (K Tons) Forecast, by Application 2019 & 2032
- Table 55: Global Sizing Agent Industry Revenue Billion Forecast, by Country 2019 & 2032
- Table 56: Global Sizing Agent Industry Volume K Tons Forecast, by Country 2019 & 2032
- Table 57: Middle East Sizing Agent Industry Revenue (Billion) Forecast, by Application 2019 & 2032
- Table 58: Middle East Sizing Agent Industry Volume (K Tons) Forecast, by Application 2019 & 2032
- Table 59: Africa Sizing Agent Industry Revenue (Billion) Forecast, by Application 2019 & 2032
- Table 60: Africa Sizing Agent Industry Volume (K Tons) Forecast, by Application 2019 & 2032
- Table 61: Global Sizing Agent Industry Revenue Billion Forecast, by Type 2019 & 2032
- Table 62: Global Sizing Agent Industry Volume K Tons Forecast, by Type 2019 & 2032
- Table 63: Global Sizing Agent Industry Revenue Billion Forecast, by Application 2019 & 2032
- Table 64: Global Sizing Agent Industry Volume K Tons Forecast, by Application 2019 & 2032
- Table 65: Global Sizing Agent Industry Revenue Billion Forecast, by Country 2019 & 2032
- Table 66: Global Sizing Agent Industry Volume K Tons Forecast, by Country 2019 & 2032
- Table 67: China Sizing Agent Industry Revenue (Billion) Forecast, by Application 2019 & 2032
- Table 68: China Sizing Agent Industry Volume (K Tons) Forecast, by Application 2019 & 2032
- Table 69: India Sizing Agent Industry Revenue (Billion) Forecast, by Application 2019 & 2032
- Table 70: India Sizing Agent Industry Volume (K Tons) Forecast, by Application 2019 & 2032
- Table 71: Japan Sizing Agent Industry Revenue (Billion) Forecast, by Application 2019 & 2032
- Table 72: Japan Sizing Agent Industry Volume (K Tons) Forecast, by Application 2019 & 2032
- Table 73: South Korea Sizing Agent Industry Revenue (Billion) Forecast, by Application 2019 & 2032
- Table 74: South Korea Sizing Agent Industry Volume (K Tons) Forecast, by Application 2019 & 2032
- Table 75: Rest of Asia Pacific Sizing Agent Industry Revenue (Billion) Forecast, by Application 2019 & 2032
- Table 76: Rest of Asia Pacific Sizing Agent Industry Volume (K Tons) Forecast, by Application 2019 & 2032
- Table 77: Global Sizing Agent Industry Revenue Billion Forecast, by Type 2019 & 2032
- Table 78: Global Sizing Agent Industry Volume K Tons Forecast, by Type 2019 & 2032
- Table 79: Global Sizing Agent Industry Revenue Billion Forecast, by Application 2019 & 2032
- Table 80: Global Sizing Agent Industry Volume K Tons Forecast, by Application 2019 & 2032
- Table 81: Global Sizing Agent Industry Revenue Billion Forecast, by Country 2019 & 2032
- Table 82: Global Sizing Agent Industry Volume K Tons Forecast, by Country 2019 & 2032
- Table 83: United States Sizing Agent Industry Revenue (Billion) Forecast, by Application 2019 & 2032
- Table 84: United States Sizing Agent Industry Volume (K Tons) Forecast, by Application 2019 & 2032
- Table 85: Canada Sizing Agent Industry Revenue (Billion) Forecast, by Application 2019 & 2032
- Table 86: Canada Sizing Agent Industry Volume (K Tons) Forecast, by Application 2019 & 2032
- Table 87: Mexico Sizing Agent Industry Revenue (Billion) Forecast, by Application 2019 & 2032
- Table 88: Mexico Sizing Agent Industry Volume (K Tons) Forecast, by Application 2019 & 2032
- Table 89: Global Sizing Agent Industry Revenue Billion Forecast, by Type 2019 & 2032
- Table 90: Global Sizing Agent Industry Volume K Tons Forecast, by Type 2019 & 2032
- Table 91: Global Sizing Agent Industry Revenue Billion Forecast, by Application 2019 & 2032
- Table 92: Global Sizing Agent Industry Volume K Tons Forecast, by Application 2019 & 2032
- Table 93: Global Sizing Agent Industry Revenue Billion Forecast, by Country 2019 & 2032
- Table 94: Global Sizing Agent Industry Volume K Tons Forecast, by Country 2019 & 2032
- Table 95: Germany Sizing Agent Industry Revenue (Billion) Forecast, by Application 2019 & 2032
- Table 96: Germany Sizing Agent Industry Volume (K Tons) Forecast, by Application 2019 & 2032
- Table 97: United Kingdom Sizing Agent Industry Revenue (Billion) Forecast, by Application 2019 & 2032
- Table 98: United Kingdom Sizing Agent Industry Volume (K Tons) Forecast, by Application 2019 & 2032
- Table 99: Italy Sizing Agent Industry Revenue (Billion) Forecast, by Application 2019 & 2032
- Table 100: Italy Sizing Agent Industry Volume (K Tons) Forecast, by Application 2019 & 2032
- Table 101: France Sizing Agent Industry Revenue (Billion) Forecast, by Application 2019 & 2032
- Table 102: France Sizing Agent Industry Volume (K Tons) Forecast, by Application 2019 & 2032
- Table 103: Rest of Europe Sizing Agent Industry Revenue (Billion) Forecast, by Application 2019 & 2032
- Table 104: Rest of Europe Sizing Agent Industry Volume (K Tons) Forecast, by Application 2019 & 2032
- Table 105: Global Sizing Agent Industry Revenue Billion Forecast, by Type 2019 & 2032
- Table 106: Global Sizing Agent Industry Volume K Tons Forecast, by Type 2019 & 2032
- Table 107: Global Sizing Agent Industry Revenue Billion Forecast, by Application 2019 & 2032
- Table 108: Global Sizing Agent Industry Volume K Tons Forecast, by Application 2019 & 2032
- Table 109: Global Sizing Agent Industry Revenue Billion Forecast, by Country 2019 & 2032
- Table 110: Global Sizing Agent Industry Volume K Tons Forecast, by Country 2019 & 2032
- Table 111: Brazil Sizing Agent Industry Revenue (Billion) Forecast, by Application 2019 & 2032
- Table 112: Brazil Sizing Agent Industry Volume (K Tons) Forecast, by Application 2019 & 2032
- Table 113: Argentina Sizing Agent Industry Revenue (Billion) Forecast, by Application 2019 & 2032
- Table 114: Argentina Sizing Agent Industry Volume (K Tons) Forecast, by Application 2019 & 2032
- Table 115: Rest of South America Sizing Agent Industry Revenue (Billion) Forecast, by Application 2019 & 2032
- Table 116: Rest of South America Sizing Agent Industry Volume (K Tons) Forecast, by Application 2019 & 2032
- Table 117: Global Sizing Agent Industry Revenue Billion Forecast, by Type 2019 & 2032
- Table 118: Global Sizing Agent Industry Volume K Tons Forecast, by Type 2019 & 2032
- Table 119: Global Sizing Agent Industry Revenue Billion Forecast, by Application 2019 & 2032
- Table 120: Global Sizing Agent Industry Volume K Tons Forecast, by Application 2019 & 2032
- Table 121: Global Sizing Agent Industry Revenue Billion Forecast, by Country 2019 & 2032
- Table 122: Global Sizing Agent Industry Volume K Tons Forecast, by Country 2019 & 2032
- Table 123: Saudi Arabia Sizing Agent Industry Revenue (Billion) Forecast, by Application 2019 & 2032
- Table 124: Saudi Arabia Sizing Agent Industry Volume (K Tons) Forecast, by Application 2019 & 2032
- Table 125: South Africa Sizing Agent Industry Revenue (Billion) Forecast, by Application 2019 & 2032
- Table 126: South Africa Sizing Agent Industry Volume (K Tons) Forecast, by Application 2019 & 2032
- Table 127: Rest of Middle East and Africa Sizing Agent Industry Revenue (Billion) Forecast, by Application 2019 & 2032
- Table 128: Rest of Middle East and Africa Sizing Agent Industry Volume (K Tons) Forecast, by Application 2019 & 2032
Frequently Asked Questions
1. What is the projected Compound Annual Growth Rate (CAGR) of the Sizing Agent Industry?
The projected CAGR is approximately 4%.
2. Which companies are prominent players in the Sizing Agent Industry?
Key companies in the market include Aries Chemical Inc, Drop Chemicals SA, Avebe, Buckman, LAROS, Refnol Resins & Chemicals Ltd, Eco Polychem Pvt Ltd, Huixian Tiankai Paper Making Agent Co Ltd, Angel Starch & Food Private Limited, Harima Chemicals Group Inc, Associated Chemical, Finor Piplaj Chemical Limited, MATANGI INTERNATIONAL, Solenis, Mare SpA.
3. What are the main segments of the Sizing Agent Industry?
The market segments include Type, Application.
4. Can you provide details about the market size?
The market size is estimated to be USD 3.9 Billion as of 2022.
5. What are some drivers contributing to market growth?
; Growing Demand from the Textile Industry; Increasing Demand from the Paper Manufacturing Industries.
6. What are the notable trends driving market growth?
Growing Demand from the Textile Manufacturing Industry.
7. Are there any restraints impacting market growth?
; Stringent Environmental Regulations; Unfavorable Conditions Arising Due to the COVID-19 Outbreak.
8. Can you provide examples of recent developments in the market?
N/A
9. What pricing options are available for accessing the report?
Pricing options include single-user, multi-user, and enterprise licenses priced at USD 4750, USD 5250, and USD 8750 respectively.
10. Is the market size provided in terms of value or volume?
The market size is provided in terms of value, measured in Billion and volume, measured in K Tons.
11. Are there any specific market keywords associated with the report?
Yes, the market keyword associated with the report is "Sizing Agent Industry," which aids in identifying and referencing the specific market segment covered.
12. How do I determine which pricing option suits my needs best?
The pricing options vary based on user requirements and access needs. Individual users may opt for single-user licenses, while businesses requiring broader access may choose multi-user or enterprise licenses for cost-effective access to the report.
13. Are there any additional resources or data provided in the Sizing Agent Industry report?
While the report offers comprehensive insights, it's advisable to review the specific contents or supplementary materials provided to ascertain if additional resources or data are available.
14. How can I stay updated on further developments or reports in the Sizing Agent Industry?
To stay informed about further developments, trends, and reports in the Sizing Agent Industry, consider subscribing to industry newsletters, following relevant companies and organizations, or regularly checking reputable industry news sources and publications.
Methodology
Step 1 - Identification of Relevant Samples Size from Population Database


Step 2 - Approaches for Defining Global Market Size (Value, Volume* & Price*)

Note*: In applicable scenarios
Step 3 - Data Sources
Primary Research
- Web Analytics
- Survey Reports
- Research Institute
- Latest Research Reports
- Opinion Leaders
Secondary Research
- Annual Reports
- White Paper
- Latest Press Release
- Industry Association
- Paid Database
- Investor Presentations

Step 4 - Data Triangulation
Involves using different sources of information in order to increase the validity of a study
These sources are likely to be stakeholders in a program - participants, other researchers, program staff, other community members, and so on.
Then we put all data in single framework & apply various statistical tools to find out the dynamic on the market.
During the analysis stage, feedback from the stakeholder groups would be compared to determine areas of agreement as well as areas of divergence
