

Key Insights
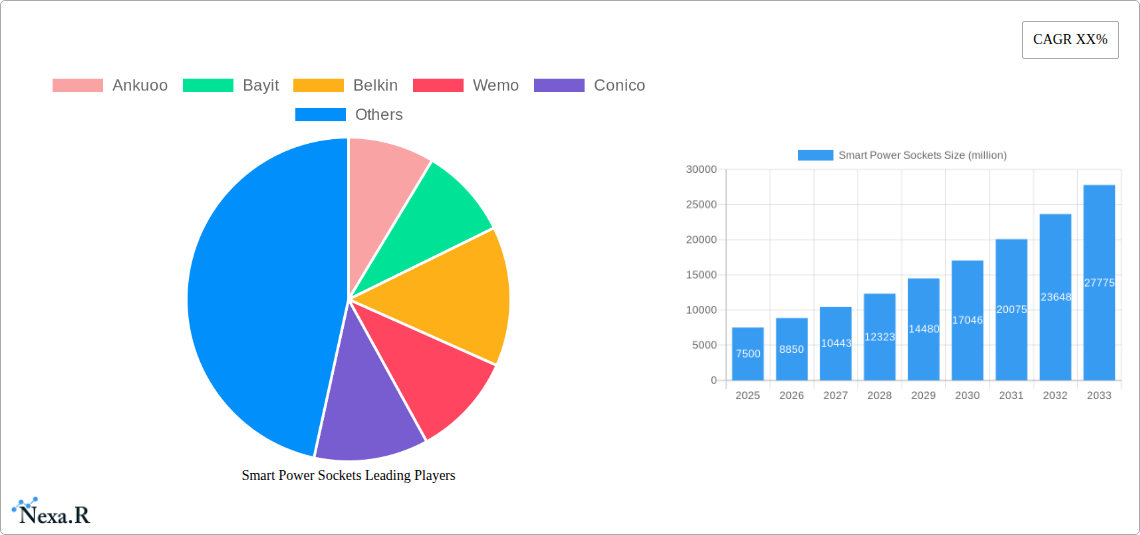
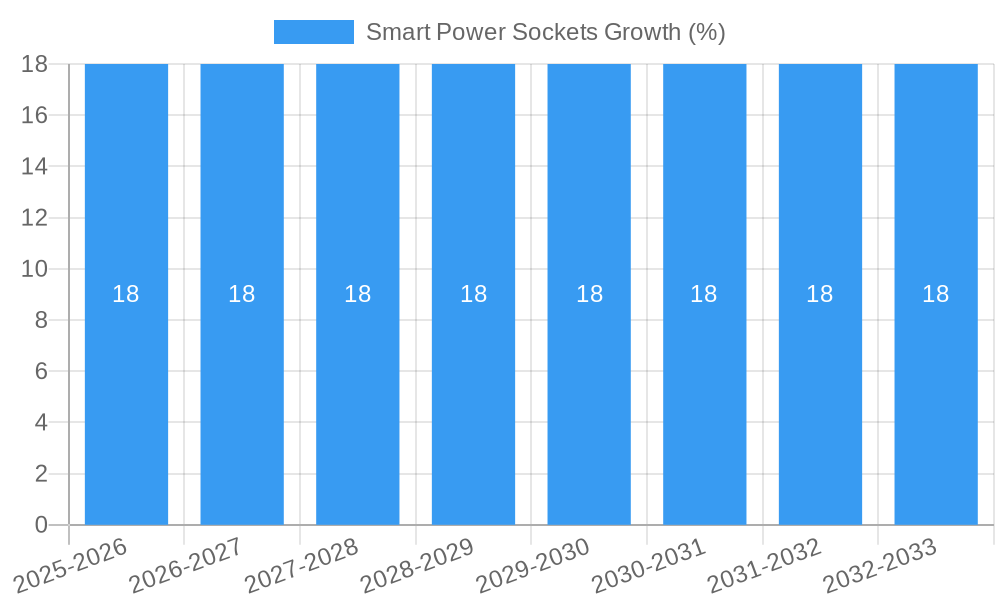
The global Smart Power Sockets market is experiencing robust growth, projected to reach an estimated market size of $7,500 million by 2025, with a Compound Annual Growth Rate (CAGR) of 18% expected throughout the forecast period from 2025 to 2033. This significant expansion is primarily fueled by the increasing adoption of smart home technology and the growing consumer demand for convenience, energy efficiency, and enhanced control over household and commercial electrical devices. The proliferation of Wi-Fi and Bluetooth connectivity in these sockets allows for seamless integration with smart assistants like Alexa and Google Assistant, enabling remote operation and automation. Furthermore, the rising awareness of energy conservation and the potential for cost savings through smart energy management are key drivers pushing market penetration. The shift towards more connected living spaces and the increasing availability of affordable smart socket solutions are further accelerating market adoption.
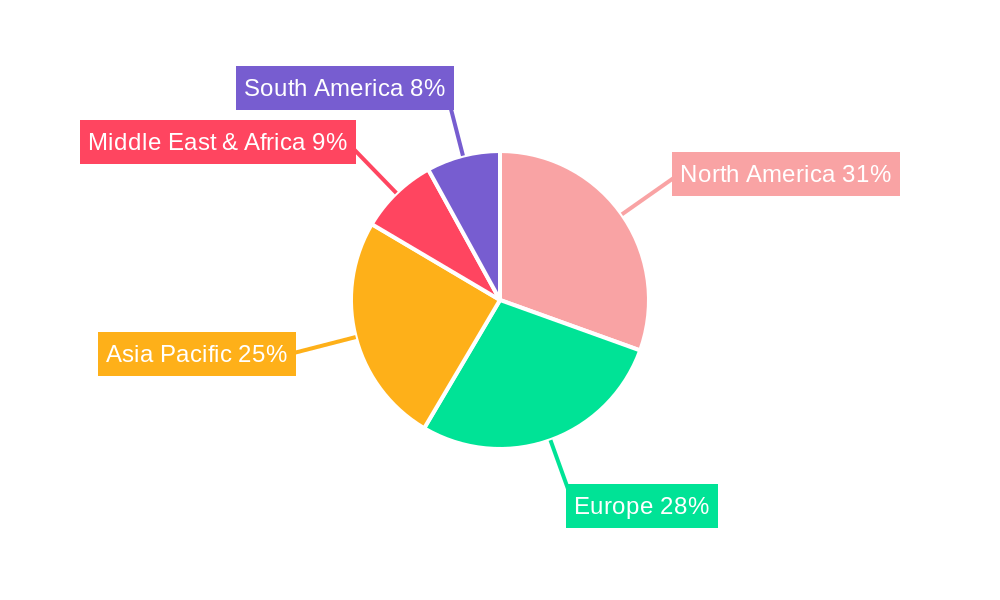
The market segmentation reveals a strong presence in both household and commercial applications, with Wi-Fi-enabled sockets holding a dominant share due to their superior range and integration capabilities. Key players like Ankuoo, Bayit, Belkin, and Wemo are actively innovating, introducing advanced features such as surge protection, energy monitoring, and customizable scheduling. Despite the positive outlook, certain restraints exist, including concerns about data privacy and security, the initial cost of smart devices compared to traditional sockets, and the need for reliable internet connectivity. However, ongoing technological advancements, including the development of more secure protocols and the increasing affordability of smart home ecosystems, are expected to mitigate these challenges. Geographically, North America and Europe are leading the market, driven by high disposable incomes and a strong inclination towards adopting new technologies, while the Asia Pacific region presents substantial growth opportunities with its rapidly expanding middle class and increasing urbanization.
Smart Power Sockets Market Report: Comprehensive Analysis & Future Outlook (2019-2033)
This report offers an in-depth analysis of the global Smart Power Sockets market, a rapidly evolving sector within the broader Internet of Things (IoT) and smart home ecosystems. We delve into market dynamics, growth trends, regional dominance, product innovations, key drivers, challenges, emerging opportunities, and the competitive landscape, providing actionable insights for industry stakeholders. The study encompasses a comprehensive historical period (2019-2024), a base year (2025), and a forecast period (2025-2033), with a study period spanning 2019–2033.
Smart Power Sockets Market Dynamics & Structure
The Smart Power Sockets market is characterized by moderate concentration, with leading players vying for market share through technological innovation and strategic partnerships. The increasing adoption of smart home devices and the growing demand for energy efficiency are primary technological innovation drivers. Regulatory frameworks, particularly those related to data privacy and electrical safety standards, play a crucial role in shaping market entry and product development. Competitive product substitutes, such as smart plugs and integrated smart home systems, present ongoing challenges. End-user demographics are shifting towards younger, tech-savvy consumers who prioritize convenience and remote control capabilities. Mergers and Acquisitions (M&A) trends indicate a consolidation phase, with larger companies acquiring innovative startups to expand their product portfolios and market reach.
- Market Concentration: Moderate, with a blend of established electronics manufacturers and specialized IoT companies.
- Technological Innovation Drivers: Growing smart home adoption, demand for energy management, integration with voice assistants (Alexa, Google Assistant), and advancements in wireless connectivity (Wi-Fi 6, Bluetooth 5).
- Regulatory Frameworks: Emphasis on cybersecurity, data privacy (GDPR, CCPA), and compliance with electrical safety certifications (UL, CE).
- Competitive Product Substitutes: Smart plugs, advanced surge protectors with connectivity features, and integrated smart electrical panels.
- End-User Demographics: Millennial and Gen Z households, early adopters of technology, and environmentally conscious consumers seeking energy savings.
- M&A Trends: Strategic acquisitions of smart home startups by major consumer electronics brands and telecommunication companies.
Smart Power Sockets Growth Trends & Insights
The Smart Power Sockets market is poised for robust growth, driven by increasing consumer awareness of energy conservation and the desire for enhanced home automation. The market size is projected to expand significantly from approximately $2,500 million units in the base year 2025, with a projected Compound Annual Growth Rate (CAGR) of 15.7% during the forecast period. Adoption rates are accelerating, fueled by the decreasing cost of smart devices and the growing availability of smart home ecosystems that integrate seamlessly with smart power sockets. Technological disruptions, such as the proliferation of Wi-Fi and Bluetooth connectivity, alongside advancements in mesh networking for enhanced reliability, are key enablers of this growth. Consumer behavior shifts towards a preference for remote control of appliances, energy monitoring capabilities, and integration with voice assistants are further propelling market penetration. The ease of installation and the ability to retro-fit existing homes with smart functionality without major electrical work also contribute to widespread adoption. Future growth will also be influenced by the development of more sophisticated energy management features, such as predictive power usage analysis and automated load balancing. The smart socket market is expected to reach $7,000 million units by 2033.
Dominant Regions, Countries, or Segments in Smart Power Sockets
North America currently dominates the Smart Power Sockets market, driven by high disposable incomes, advanced technological infrastructure, and a strong consumer inclination towards adopting smart home solutions. The United States, in particular, exhibits a significant market share due to widespread availability of high-speed internet and a mature ecosystem of smart home device manufacturers and retailers. Economically, the region benefits from supportive government initiatives promoting energy efficiency and smart grid technologies.
- Dominant Segment (Application): Household applications represent the largest segment. This is attributed to the increasing penetration of smart home devices and the desire among homeowners to automate lighting, appliances, and entertainment systems for convenience and energy savings. The estimated market share for household applications is 75% in 2025.
- Dominant Segment (Type): Wi-Fi connected smart power sockets are the most popular type, offering broad compatibility and ease of integration with existing home networks. Bluetooth-enabled sockets are gaining traction for localized control and in scenarios where Wi-Fi connectivity might be inconsistent. The market share for Wi-Fi sockets is projected at 70%, while Bluetooth is expected to hold 25% in 2025.
- Key Drivers in North America:
- High disposable incomes and consumer spending on technology.
- Extensive smart home ecosystem development and product availability.
- Government incentives for energy efficiency and smart grid technologies.
- Widespread adoption of voice assistants like Amazon Alexa and Google Assistant.
- Robust e-commerce channels facilitating easy product access.
- Growth Potential in Asia Pacific: The Asia Pacific region is emerging as a high-growth market, fueled by rapid urbanization, increasing internet penetration, a growing middle class with rising disposable incomes, and government focus on developing smart cities and promoting energy conservation. Countries like China and India are experiencing substantial growth in the adoption of smart home devices, including smart power sockets, making them key future growth markets.
Smart Power Sockets Product Landscape
The Smart Power Sockets product landscape is characterized by continuous innovation, focusing on enhanced connectivity, advanced energy monitoring, and seamless integration with broader smart home ecosystems. Manufacturers are offering a diverse range of products, from basic Wi-Fi and Bluetooth enabled sockets to advanced models with built-in surge protection, individual outlet control, and energy usage analytics. Unique selling propositions include compatibility with major voice assistants, remote access via mobile applications, scheduling capabilities, and integration with IFTTT (If This Then That) for sophisticated automation routines. Technological advancements are centered around improving device responsiveness, reducing power consumption of the sockets themselves, and ensuring robust cybersecurity to protect user data.
Key Drivers, Barriers & Challenges in Smart Power Sockets
Key Drivers:
- Growing Smart Home Adoption: The increasing consumer interest in automating homes for convenience and security directly fuels demand for smart power sockets as foundational components.
- Energy Efficiency Concerns: Rising electricity costs and environmental awareness drive consumers to seek solutions for monitoring and reducing energy consumption, a key feature of smart sockets.
- Advancements in Connectivity: The widespread availability and reliability of Wi-Fi and Bluetooth technologies make smart sockets more accessible and user-friendly.
- Integration with Voice Assistants: Seamless integration with platforms like Amazon Alexa and Google Assistant simplifies control and enhances user experience.
Barriers & Challenges:
- Cybersecurity and Privacy Concerns: Users are apprehensive about the security of connected devices and the potential for data breaches, leading to hesitance in adoption.
- Interoperability Issues: Lack of universal standards can lead to compatibility problems between devices from different manufacturers, frustrating consumers.
- Perceived Cost: Although prices are decreasing, the initial investment for smart power sockets can still be a barrier for some price-sensitive consumers, especially compared to traditional sockets.
- Reliability and Longevity: Concerns about the long-term reliability and lifespan of electronic components in smart sockets can impact consumer purchasing decisions.
- Fragmented Market Landscape: The presence of numerous brands with varying feature sets and price points can make it challenging for consumers to make informed choices.
Emerging Opportunities in Smart Power Sockets
Emerging opportunities lie in the development of smart power sockets with integrated features like USB-C Power Delivery for faster device charging, advanced environmental sensors (temperature, humidity), and enhanced energy analytics for granular consumption insights. The growing trend of smart energy management in commercial spaces, such as offices and retail stores, presents a significant untapped market for intelligent power distribution and cost optimization. Furthermore, the integration of smart power sockets into broader home security systems and their use in the Internet of Medical Things (IoMT) for remote patient monitoring and device power management offer innovative application avenues.
Growth Accelerators in the Smart Power Sockets Industry
The smart power sockets industry is propelled by several growth accelerators. Technological breakthroughs in miniaturization and power efficiency enable the development of more compact and cost-effective devices. Strategic partnerships between smart socket manufacturers and leading smart home platform providers (e.g., Amazon, Google, Apple) are crucial for ecosystem expansion and enhanced user experience. Market expansion strategies, including the penetration of emerging economies with growing middle classes and increasing internet penetration, will drive significant long-term growth. The increasing standardization of communication protocols (e.g., Matter) promises to overcome interoperability challenges and accelerate adoption across a wider range of smart home devices.
Key Players Shaping the Smart Power Sockets Market
- Ankuoo
- Bayit
- Belkin
- Wemo
- Conico
- ConnectSense
- Eve Energy
- iDevices
- iHome
- Orvibo
- SunPort
Notable Milestones in Smart Power Sockets Sector
- 2019: Increased adoption of Wi-Fi enabled smart plugs and sockets, offering basic remote control and scheduling features.
- 2020: Integration of smart power sockets with major voice assistants like Amazon Alexa and Google Assistant becomes mainstream, enhancing usability.
- 2021: Introduction of advanced energy monitoring features, allowing users to track appliance-specific energy consumption.
- 2022: Growing focus on cybersecurity and data privacy in smart socket design and firmware updates.
- 2023: Emergence of Matter-compatible smart sockets, promising improved interoperability within smart home ecosystems.
- 2024: Increased market penetration of smart sockets with advanced features like individual outlet control and USB charging ports.
In-Depth Smart Power Sockets Market Outlook
The future outlook for the Smart Power Sockets market is exceptionally bright, driven by ongoing technological advancements and evolving consumer demands for intelligent home and building automation. Growth accelerators such as the widespread adoption of AI-powered home assistants, the increasing emphasis on sustainable energy practices, and the continuous innovation in connectivity protocols will further solidify market expansion. Strategic partnerships and a focus on user-centric design will be pivotal in capturing market share. The market is expected to witness substantial growth, driven by both the parent market of smart home devices and the specialized child market of energy management solutions, creating significant opportunities for innovation and investment.
Smart Power Sockets Segmentation
-
1. Application
- 1.1. Household
- 1.2. Commercial
-
2. Types
- 2.1. Wifi
- 2.2. Bluetooth
- 2.3. Other
Smart Power Sockets Segmentation By Geography
-
1. North America
- 1.1. United States
- 1.2. Canada
- 1.3. Mexico
-
2. South America
- 2.1. Brazil
- 2.2. Argentina
- 2.3. Rest of South America
-
3. Europe
- 3.1. United Kingdom
- 3.2. Germany
- 3.3. France
- 3.4. Italy
- 3.5. Spain
- 3.6. Russia
- 3.7. Benelux
- 3.8. Nordics
- 3.9. Rest of Europe
-
4. Middle East & Africa
- 4.1. Turkey
- 4.2. Israel
- 4.3. GCC
- 4.4. North Africa
- 4.5. South Africa
- 4.6. Rest of Middle East & Africa
-
5. Asia Pacific
- 5.1. China
- 5.2. India
- 5.3. Japan
- 5.4. South Korea
- 5.5. ASEAN
- 5.6. Oceania
- 5.7. Rest of Asia Pacific
Smart Power Sockets REPORT HIGHLIGHTS
| Aspects | Details |
|---|---|
| Study Period | 2019-2033 |
| Base Year | 2024 |
| Estimated Year | 2025 |
| Forecast Period | 2025-2033 |
| Historical Period | 2019-2024 |
| Growth Rate | CAGR of XX% from 2019-2033 |
| Segmentation |
|
Table of Contents
- 1. Introduction
- 1.1. Research Scope
- 1.2. Market Segmentation
- 1.3. Research Methodology
- 1.4. Definitions and Assumptions
- 2. Executive Summary
- 2.1. Introduction
- 3. Market Dynamics
- 3.1. Introduction
- 3.2. Market Drivers
- 3.3. Market Restrains
- 3.4. Market Trends
- 4. Market Factor Analysis
- 4.1. Porters Five Forces
- 4.2. Supply/Value Chain
- 4.3. PESTEL analysis
- 4.4. Market Entropy
- 4.5. Patent/Trademark Analysis
- 5. Global Smart Power Sockets Analysis, Insights and Forecast, 2019-2031
- 5.1. Market Analysis, Insights and Forecast - by Application
- 5.1.1. Household
- 5.1.2. Commercial
- 5.2. Market Analysis, Insights and Forecast - by Types
- 5.2.1. Wifi
- 5.2.2. Bluetooth
- 5.2.3. Other
- 5.3. Market Analysis, Insights and Forecast - by Region
- 5.3.1. North America
- 5.3.2. South America
- 5.3.3. Europe
- 5.3.4. Middle East & Africa
- 5.3.5. Asia Pacific
- 5.1. Market Analysis, Insights and Forecast - by Application
- 6. North America Smart Power Sockets Analysis, Insights and Forecast, 2019-2031
- 6.1. Market Analysis, Insights and Forecast - by Application
- 6.1.1. Household
- 6.1.2. Commercial
- 6.2. Market Analysis, Insights and Forecast - by Types
- 6.2.1. Wifi
- 6.2.2. Bluetooth
- 6.2.3. Other
- 6.1. Market Analysis, Insights and Forecast - by Application
- 7. South America Smart Power Sockets Analysis, Insights and Forecast, 2019-2031
- 7.1. Market Analysis, Insights and Forecast - by Application
- 7.1.1. Household
- 7.1.2. Commercial
- 7.2. Market Analysis, Insights and Forecast - by Types
- 7.2.1. Wifi
- 7.2.2. Bluetooth
- 7.2.3. Other
- 7.1. Market Analysis, Insights and Forecast - by Application
- 8. Europe Smart Power Sockets Analysis, Insights and Forecast, 2019-2031
- 8.1. Market Analysis, Insights and Forecast - by Application
- 8.1.1. Household
- 8.1.2. Commercial
- 8.2. Market Analysis, Insights and Forecast - by Types
- 8.2.1. Wifi
- 8.2.2. Bluetooth
- 8.2.3. Other
- 8.1. Market Analysis, Insights and Forecast - by Application
- 9. Middle East & Africa Smart Power Sockets Analysis, Insights and Forecast, 2019-2031
- 9.1. Market Analysis, Insights and Forecast - by Application
- 9.1.1. Household
- 9.1.2. Commercial
- 9.2. Market Analysis, Insights and Forecast - by Types
- 9.2.1. Wifi
- 9.2.2. Bluetooth
- 9.2.3. Other
- 9.1. Market Analysis, Insights and Forecast - by Application
- 10. Asia Pacific Smart Power Sockets Analysis, Insights and Forecast, 2019-2031
- 10.1. Market Analysis, Insights and Forecast - by Application
- 10.1.1. Household
- 10.1.2. Commercial
- 10.2. Market Analysis, Insights and Forecast - by Types
- 10.2.1. Wifi
- 10.2.2. Bluetooth
- 10.2.3. Other
- 10.1. Market Analysis, Insights and Forecast - by Application
- 11. Competitive Analysis
- 11.1. Global Market Share Analysis 2024
- 11.2. Company Profiles
- 11.2.1 Ankuoo
- 11.2.1.1. Overview
- 11.2.1.2. Products
- 11.2.1.3. SWOT Analysis
- 11.2.1.4. Recent Developments
- 11.2.1.5. Financials (Based on Availability)
- 11.2.2 Bayit
- 11.2.2.1. Overview
- 11.2.2.2. Products
- 11.2.2.3. SWOT Analysis
- 11.2.2.4. Recent Developments
- 11.2.2.5. Financials (Based on Availability)
- 11.2.3 Belkin
- 11.2.3.1. Overview
- 11.2.3.2. Products
- 11.2.3.3. SWOT Analysis
- 11.2.3.4. Recent Developments
- 11.2.3.5. Financials (Based on Availability)
- 11.2.4 Wemo
- 11.2.4.1. Overview
- 11.2.4.2. Products
- 11.2.4.3. SWOT Analysis
- 11.2.4.4. Recent Developments
- 11.2.4.5. Financials (Based on Availability)
- 11.2.5 Conico
- 11.2.5.1. Overview
- 11.2.5.2. Products
- 11.2.5.3. SWOT Analysis
- 11.2.5.4. Recent Developments
- 11.2.5.5. Financials (Based on Availability)
- 11.2.6 ConnectSense
- 11.2.6.1. Overview
- 11.2.6.2. Products
- 11.2.6.3. SWOT Analysis
- 11.2.6.4. Recent Developments
- 11.2.6.5. Financials (Based on Availability)
- 11.2.7 Eve Energy
- 11.2.7.1. Overview
- 11.2.7.2. Products
- 11.2.7.3. SWOT Analysis
- 11.2.7.4. Recent Developments
- 11.2.7.5. Financials (Based on Availability)
- 11.2.8 iDevices
- 11.2.8.1. Overview
- 11.2.8.2. Products
- 11.2.8.3. SWOT Analysis
- 11.2.8.4. Recent Developments
- 11.2.8.5. Financials (Based on Availability)
- 11.2.9 iHome
- 11.2.9.1. Overview
- 11.2.9.2. Products
- 11.2.9.3. SWOT Analysis
- 11.2.9.4. Recent Developments
- 11.2.9.5. Financials (Based on Availability)
- 11.2.10 Orvibo
- 11.2.10.1. Overview
- 11.2.10.2. Products
- 11.2.10.3. SWOT Analysis
- 11.2.10.4. Recent Developments
- 11.2.10.5. Financials (Based on Availability)
- 11.2.11 SunPort
- 11.2.11.1. Overview
- 11.2.11.2. Products
- 11.2.11.3. SWOT Analysis
- 11.2.11.4. Recent Developments
- 11.2.11.5. Financials (Based on Availability)
- 11.2.1 Ankuoo
List of Figures
- Figure 1: Global Smart Power Sockets Revenue Breakdown (million, %) by Region 2024 & 2032
- Figure 2: Global Smart Power Sockets Volume Breakdown (K, %) by Region 2024 & 2032
- Figure 3: North America Smart Power Sockets Revenue (million), by Application 2024 & 2032
- Figure 4: North America Smart Power Sockets Volume (K), by Application 2024 & 2032
- Figure 5: North America Smart Power Sockets Revenue Share (%), by Application 2024 & 2032
- Figure 6: North America Smart Power Sockets Volume Share (%), by Application 2024 & 2032
- Figure 7: North America Smart Power Sockets Revenue (million), by Types 2024 & 2032
- Figure 8: North America Smart Power Sockets Volume (K), by Types 2024 & 2032
- Figure 9: North America Smart Power Sockets Revenue Share (%), by Types 2024 & 2032
- Figure 10: North America Smart Power Sockets Volume Share (%), by Types 2024 & 2032
- Figure 11: North America Smart Power Sockets Revenue (million), by Country 2024 & 2032
- Figure 12: North America Smart Power Sockets Volume (K), by Country 2024 & 2032
- Figure 13: North America Smart Power Sockets Revenue Share (%), by Country 2024 & 2032
- Figure 14: North America Smart Power Sockets Volume Share (%), by Country 2024 & 2032
- Figure 15: South America Smart Power Sockets Revenue (million), by Application 2024 & 2032
- Figure 16: South America Smart Power Sockets Volume (K), by Application 2024 & 2032
- Figure 17: South America Smart Power Sockets Revenue Share (%), by Application 2024 & 2032
- Figure 18: South America Smart Power Sockets Volume Share (%), by Application 2024 & 2032
- Figure 19: South America Smart Power Sockets Revenue (million), by Types 2024 & 2032
- Figure 20: South America Smart Power Sockets Volume (K), by Types 2024 & 2032
- Figure 21: South America Smart Power Sockets Revenue Share (%), by Types 2024 & 2032
- Figure 22: South America Smart Power Sockets Volume Share (%), by Types 2024 & 2032
- Figure 23: South America Smart Power Sockets Revenue (million), by Country 2024 & 2032
- Figure 24: South America Smart Power Sockets Volume (K), by Country 2024 & 2032
- Figure 25: South America Smart Power Sockets Revenue Share (%), by Country 2024 & 2032
- Figure 26: South America Smart Power Sockets Volume Share (%), by Country 2024 & 2032
- Figure 27: Europe Smart Power Sockets Revenue (million), by Application 2024 & 2032
- Figure 28: Europe Smart Power Sockets Volume (K), by Application 2024 & 2032
- Figure 29: Europe Smart Power Sockets Revenue Share (%), by Application 2024 & 2032
- Figure 30: Europe Smart Power Sockets Volume Share (%), by Application 2024 & 2032
- Figure 31: Europe Smart Power Sockets Revenue (million), by Types 2024 & 2032
- Figure 32: Europe Smart Power Sockets Volume (K), by Types 2024 & 2032
- Figure 33: Europe Smart Power Sockets Revenue Share (%), by Types 2024 & 2032
- Figure 34: Europe Smart Power Sockets Volume Share (%), by Types 2024 & 2032
- Figure 35: Europe Smart Power Sockets Revenue (million), by Country 2024 & 2032
- Figure 36: Europe Smart Power Sockets Volume (K), by Country 2024 & 2032
- Figure 37: Europe Smart Power Sockets Revenue Share (%), by Country 2024 & 2032
- Figure 38: Europe Smart Power Sockets Volume Share (%), by Country 2024 & 2032
- Figure 39: Middle East & Africa Smart Power Sockets Revenue (million), by Application 2024 & 2032
- Figure 40: Middle East & Africa Smart Power Sockets Volume (K), by Application 2024 & 2032
- Figure 41: Middle East & Africa Smart Power Sockets Revenue Share (%), by Application 2024 & 2032
- Figure 42: Middle East & Africa Smart Power Sockets Volume Share (%), by Application 2024 & 2032
- Figure 43: Middle East & Africa Smart Power Sockets Revenue (million), by Types 2024 & 2032
- Figure 44: Middle East & Africa Smart Power Sockets Volume (K), by Types 2024 & 2032
- Figure 45: Middle East & Africa Smart Power Sockets Revenue Share (%), by Types 2024 & 2032
- Figure 46: Middle East & Africa Smart Power Sockets Volume Share (%), by Types 2024 & 2032
- Figure 47: Middle East & Africa Smart Power Sockets Revenue (million), by Country 2024 & 2032
- Figure 48: Middle East & Africa Smart Power Sockets Volume (K), by Country 2024 & 2032
- Figure 49: Middle East & Africa Smart Power Sockets Revenue Share (%), by Country 2024 & 2032
- Figure 50: Middle East & Africa Smart Power Sockets Volume Share (%), by Country 2024 & 2032
- Figure 51: Asia Pacific Smart Power Sockets Revenue (million), by Application 2024 & 2032
- Figure 52: Asia Pacific Smart Power Sockets Volume (K), by Application 2024 & 2032
- Figure 53: Asia Pacific Smart Power Sockets Revenue Share (%), by Application 2024 & 2032
- Figure 54: Asia Pacific Smart Power Sockets Volume Share (%), by Application 2024 & 2032
- Figure 55: Asia Pacific Smart Power Sockets Revenue (million), by Types 2024 & 2032
- Figure 56: Asia Pacific Smart Power Sockets Volume (K), by Types 2024 & 2032
- Figure 57: Asia Pacific Smart Power Sockets Revenue Share (%), by Types 2024 & 2032
- Figure 58: Asia Pacific Smart Power Sockets Volume Share (%), by Types 2024 & 2032
- Figure 59: Asia Pacific Smart Power Sockets Revenue (million), by Country 2024 & 2032
- Figure 60: Asia Pacific Smart Power Sockets Volume (K), by Country 2024 & 2032
- Figure 61: Asia Pacific Smart Power Sockets Revenue Share (%), by Country 2024 & 2032
- Figure 62: Asia Pacific Smart Power Sockets Volume Share (%), by Country 2024 & 2032
List of Tables
- Table 1: Global Smart Power Sockets Revenue million Forecast, by Region 2019 & 2032
- Table 2: Global Smart Power Sockets Volume K Forecast, by Region 2019 & 2032
- Table 3: Global Smart Power Sockets Revenue million Forecast, by Application 2019 & 2032
- Table 4: Global Smart Power Sockets Volume K Forecast, by Application 2019 & 2032
- Table 5: Global Smart Power Sockets Revenue million Forecast, by Types 2019 & 2032
- Table 6: Global Smart Power Sockets Volume K Forecast, by Types 2019 & 2032
- Table 7: Global Smart Power Sockets Revenue million Forecast, by Region 2019 & 2032
- Table 8: Global Smart Power Sockets Volume K Forecast, by Region 2019 & 2032
- Table 9: Global Smart Power Sockets Revenue million Forecast, by Application 2019 & 2032
- Table 10: Global Smart Power Sockets Volume K Forecast, by Application 2019 & 2032
- Table 11: Global Smart Power Sockets Revenue million Forecast, by Types 2019 & 2032
- Table 12: Global Smart Power Sockets Volume K Forecast, by Types 2019 & 2032
- Table 13: Global Smart Power Sockets Revenue million Forecast, by Country 2019 & 2032
- Table 14: Global Smart Power Sockets Volume K Forecast, by Country 2019 & 2032
- Table 15: United States Smart Power Sockets Revenue (million) Forecast, by Application 2019 & 2032
- Table 16: United States Smart Power Sockets Volume (K) Forecast, by Application 2019 & 2032
- Table 17: Canada Smart Power Sockets Revenue (million) Forecast, by Application 2019 & 2032
- Table 18: Canada Smart Power Sockets Volume (K) Forecast, by Application 2019 & 2032
- Table 19: Mexico Smart Power Sockets Revenue (million) Forecast, by Application 2019 & 2032
- Table 20: Mexico Smart Power Sockets Volume (K) Forecast, by Application 2019 & 2032
- Table 21: Global Smart Power Sockets Revenue million Forecast, by Application 2019 & 2032
- Table 22: Global Smart Power Sockets Volume K Forecast, by Application 2019 & 2032
- Table 23: Global Smart Power Sockets Revenue million Forecast, by Types 2019 & 2032
- Table 24: Global Smart Power Sockets Volume K Forecast, by Types 2019 & 2032
- Table 25: Global Smart Power Sockets Revenue million Forecast, by Country 2019 & 2032
- Table 26: Global Smart Power Sockets Volume K Forecast, by Country 2019 & 2032
- Table 27: Brazil Smart Power Sockets Revenue (million) Forecast, by Application 2019 & 2032
- Table 28: Brazil Smart Power Sockets Volume (K) Forecast, by Application 2019 & 2032
- Table 29: Argentina Smart Power Sockets Revenue (million) Forecast, by Application 2019 & 2032
- Table 30: Argentina Smart Power Sockets Volume (K) Forecast, by Application 2019 & 2032
- Table 31: Rest of South America Smart Power Sockets Revenue (million) Forecast, by Application 2019 & 2032
- Table 32: Rest of South America Smart Power Sockets Volume (K) Forecast, by Application 2019 & 2032
- Table 33: Global Smart Power Sockets Revenue million Forecast, by Application 2019 & 2032
- Table 34: Global Smart Power Sockets Volume K Forecast, by Application 2019 & 2032
- Table 35: Global Smart Power Sockets Revenue million Forecast, by Types 2019 & 2032
- Table 36: Global Smart Power Sockets Volume K Forecast, by Types 2019 & 2032
- Table 37: Global Smart Power Sockets Revenue million Forecast, by Country 2019 & 2032
- Table 38: Global Smart Power Sockets Volume K Forecast, by Country 2019 & 2032
- Table 39: United Kingdom Smart Power Sockets Revenue (million) Forecast, by Application 2019 & 2032
- Table 40: United Kingdom Smart Power Sockets Volume (K) Forecast, by Application 2019 & 2032
- Table 41: Germany Smart Power Sockets Revenue (million) Forecast, by Application 2019 & 2032
- Table 42: Germany Smart Power Sockets Volume (K) Forecast, by Application 2019 & 2032
- Table 43: France Smart Power Sockets Revenue (million) Forecast, by Application 2019 & 2032
- Table 44: France Smart Power Sockets Volume (K) Forecast, by Application 2019 & 2032
- Table 45: Italy Smart Power Sockets Revenue (million) Forecast, by Application 2019 & 2032
- Table 46: Italy Smart Power Sockets Volume (K) Forecast, by Application 2019 & 2032
- Table 47: Spain Smart Power Sockets Revenue (million) Forecast, by Application 2019 & 2032
- Table 48: Spain Smart Power Sockets Volume (K) Forecast, by Application 2019 & 2032
- Table 49: Russia Smart Power Sockets Revenue (million) Forecast, by Application 2019 & 2032
- Table 50: Russia Smart Power Sockets Volume (K) Forecast, by Application 2019 & 2032
- Table 51: Benelux Smart Power Sockets Revenue (million) Forecast, by Application 2019 & 2032
- Table 52: Benelux Smart Power Sockets Volume (K) Forecast, by Application 2019 & 2032
- Table 53: Nordics Smart Power Sockets Revenue (million) Forecast, by Application 2019 & 2032
- Table 54: Nordics Smart Power Sockets Volume (K) Forecast, by Application 2019 & 2032
- Table 55: Rest of Europe Smart Power Sockets Revenue (million) Forecast, by Application 2019 & 2032
- Table 56: Rest of Europe Smart Power Sockets Volume (K) Forecast, by Application 2019 & 2032
- Table 57: Global Smart Power Sockets Revenue million Forecast, by Application 2019 & 2032
- Table 58: Global Smart Power Sockets Volume K Forecast, by Application 2019 & 2032
- Table 59: Global Smart Power Sockets Revenue million Forecast, by Types 2019 & 2032
- Table 60: Global Smart Power Sockets Volume K Forecast, by Types 2019 & 2032
- Table 61: Global Smart Power Sockets Revenue million Forecast, by Country 2019 & 2032
- Table 62: Global Smart Power Sockets Volume K Forecast, by Country 2019 & 2032
- Table 63: Turkey Smart Power Sockets Revenue (million) Forecast, by Application 2019 & 2032
- Table 64: Turkey Smart Power Sockets Volume (K) Forecast, by Application 2019 & 2032
- Table 65: Israel Smart Power Sockets Revenue (million) Forecast, by Application 2019 & 2032
- Table 66: Israel Smart Power Sockets Volume (K) Forecast, by Application 2019 & 2032
- Table 67: GCC Smart Power Sockets Revenue (million) Forecast, by Application 2019 & 2032
- Table 68: GCC Smart Power Sockets Volume (K) Forecast, by Application 2019 & 2032
- Table 69: North Africa Smart Power Sockets Revenue (million) Forecast, by Application 2019 & 2032
- Table 70: North Africa Smart Power Sockets Volume (K) Forecast, by Application 2019 & 2032
- Table 71: South Africa Smart Power Sockets Revenue (million) Forecast, by Application 2019 & 2032
- Table 72: South Africa Smart Power Sockets Volume (K) Forecast, by Application 2019 & 2032
- Table 73: Rest of Middle East & Africa Smart Power Sockets Revenue (million) Forecast, by Application 2019 & 2032
- Table 74: Rest of Middle East & Africa Smart Power Sockets Volume (K) Forecast, by Application 2019 & 2032
- Table 75: Global Smart Power Sockets Revenue million Forecast, by Application 2019 & 2032
- Table 76: Global Smart Power Sockets Volume K Forecast, by Application 2019 & 2032
- Table 77: Global Smart Power Sockets Revenue million Forecast, by Types 2019 & 2032
- Table 78: Global Smart Power Sockets Volume K Forecast, by Types 2019 & 2032
- Table 79: Global Smart Power Sockets Revenue million Forecast, by Country 2019 & 2032
- Table 80: Global Smart Power Sockets Volume K Forecast, by Country 2019 & 2032
- Table 81: China Smart Power Sockets Revenue (million) Forecast, by Application 2019 & 2032
- Table 82: China Smart Power Sockets Volume (K) Forecast, by Application 2019 & 2032
- Table 83: India Smart Power Sockets Revenue (million) Forecast, by Application 2019 & 2032
- Table 84: India Smart Power Sockets Volume (K) Forecast, by Application 2019 & 2032
- Table 85: Japan Smart Power Sockets Revenue (million) Forecast, by Application 2019 & 2032
- Table 86: Japan Smart Power Sockets Volume (K) Forecast, by Application 2019 & 2032
- Table 87: South Korea Smart Power Sockets Revenue (million) Forecast, by Application 2019 & 2032
- Table 88: South Korea Smart Power Sockets Volume (K) Forecast, by Application 2019 & 2032
- Table 89: ASEAN Smart Power Sockets Revenue (million) Forecast, by Application 2019 & 2032
- Table 90: ASEAN Smart Power Sockets Volume (K) Forecast, by Application 2019 & 2032
- Table 91: Oceania Smart Power Sockets Revenue (million) Forecast, by Application 2019 & 2032
- Table 92: Oceania Smart Power Sockets Volume (K) Forecast, by Application 2019 & 2032
- Table 93: Rest of Asia Pacific Smart Power Sockets Revenue (million) Forecast, by Application 2019 & 2032
- Table 94: Rest of Asia Pacific Smart Power Sockets Volume (K) Forecast, by Application 2019 & 2032
Frequently Asked Questions
1. What is the projected Compound Annual Growth Rate (CAGR) of the Smart Power Sockets?
The projected CAGR is approximately XX%.
2. Which companies are prominent players in the Smart Power Sockets?
Key companies in the market include Ankuoo, Bayit, Belkin, Wemo, Conico, ConnectSense, Eve Energy, iDevices, iHome, Orvibo, SunPort.
3. What are the main segments of the Smart Power Sockets?
The market segments include Application, Types.
4. Can you provide details about the market size?
The market size is estimated to be USD XXX million as of 2022.
5. What are some drivers contributing to market growth?
N/A
6. What are the notable trends driving market growth?
N/A
7. Are there any restraints impacting market growth?
N/A
8. Can you provide examples of recent developments in the market?
N/A
9. What pricing options are available for accessing the report?
Pricing options include single-user, multi-user, and enterprise licenses priced at USD 3950.00, USD 5925.00, and USD 7900.00 respectively.
10. Is the market size provided in terms of value or volume?
The market size is provided in terms of value, measured in million and volume, measured in K.
11. Are there any specific market keywords associated with the report?
Yes, the market keyword associated with the report is "Smart Power Sockets," which aids in identifying and referencing the specific market segment covered.
12. How do I determine which pricing option suits my needs best?
The pricing options vary based on user requirements and access needs. Individual users may opt for single-user licenses, while businesses requiring broader access may choose multi-user or enterprise licenses for cost-effective access to the report.
13. Are there any additional resources or data provided in the Smart Power Sockets report?
While the report offers comprehensive insights, it's advisable to review the specific contents or supplementary materials provided to ascertain if additional resources or data are available.
14. How can I stay updated on further developments or reports in the Smart Power Sockets?
To stay informed about further developments, trends, and reports in the Smart Power Sockets, consider subscribing to industry newsletters, following relevant companies and organizations, or regularly checking reputable industry news sources and publications.
Methodology
Step 1 - Identification of Relevant Samples Size from Population Database


Step 2 - Approaches for Defining Global Market Size (Value, Volume* & Price*)

Note*: In applicable scenarios
Step 3 - Data Sources
Primary Research
- Web Analytics
- Survey Reports
- Research Institute
- Latest Research Reports
- Opinion Leaders
Secondary Research
- Annual Reports
- White Paper
- Latest Press Release
- Industry Association
- Paid Database
- Investor Presentations

Step 4 - Data Triangulation
Involves using different sources of information in order to increase the validity of a study
These sources are likely to be stakeholders in a program - participants, other researchers, program staff, other community members, and so on.
Then we put all data in single framework & apply various statistical tools to find out the dynamic on the market.
During the analysis stage, feedback from the stakeholder groups would be compared to determine areas of agreement as well as areas of divergence
