

Key Insights
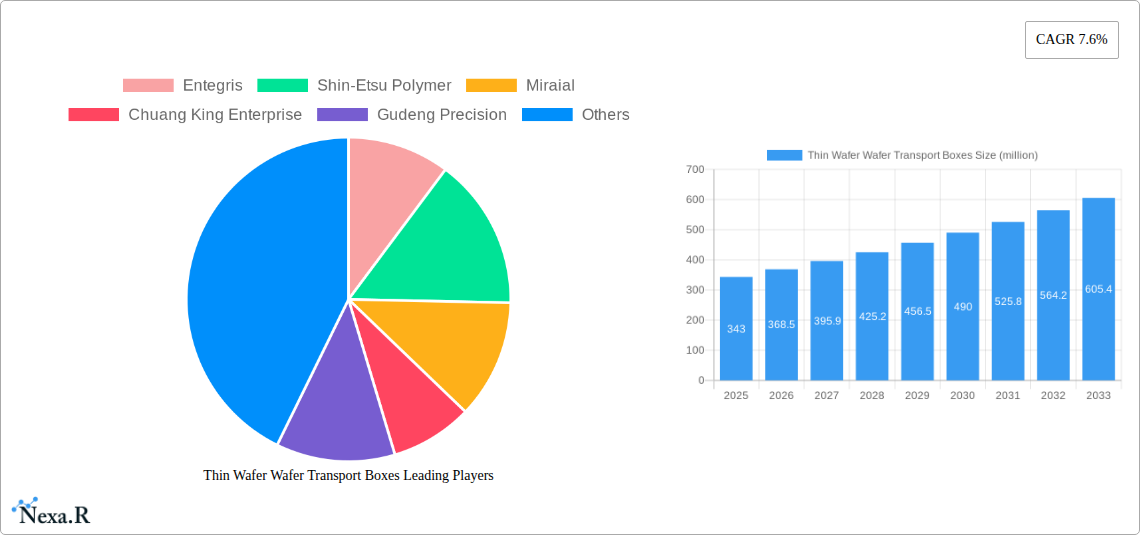
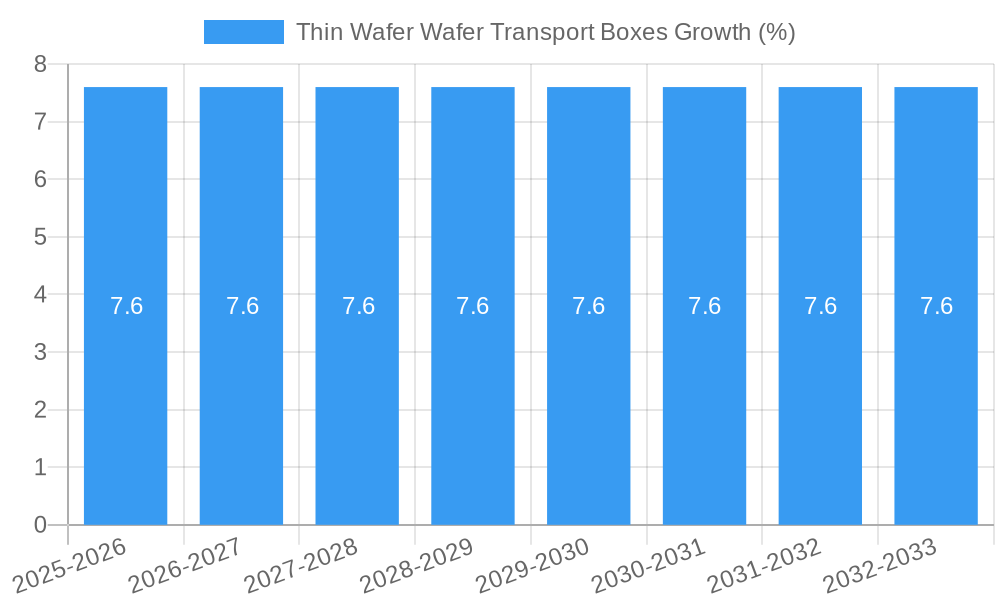
The global market for Thin Wafer Wafer Transport Boxes is poised for significant expansion, projected to reach an estimated market size of USD 343 million in 2025, with a robust Compound Annual Growth Rate (CAGR) of 7.6% through 2033. This growth is primarily fueled by the escalating demand for advanced semiconductor devices across various applications, including foundries and Integrated Device Manufacturers (IDMs). The increasing complexity and miniaturization of integrated circuits necessitate specialized transport solutions that can ensure the integrity and purity of thin wafers during handling and logistics. The market is characterized by innovation in materials and design to accommodate next-generation wafer sizes and to mitigate risks associated with breakage and contamination. Key drivers include the relentless pursuit of smaller, more powerful, and energy-efficient chips for consumer electronics, automotive, and high-performance computing sectors, all of which rely on the secure transportation of delicate semiconductor components.
The market segmentation reveals a strong focus on specialized transport solutions, with 13 Pcs Capacity FOSB (Front-Opening Shipping Box) and 13 Pcs Capacity FOUP (Front-Opening Unified Pod) leading the charge. These container types are crucial for safeguarding sensitive wafers during various stages of the semiconductor manufacturing process, from fabrication to assembly and testing. While the market exhibits strong growth potential, certain restraints could influence its trajectory. These might include stringent regulatory compliance for material handling in cleanroom environments, potential supply chain disruptions impacting raw material availability, and the high cost associated with developing and manufacturing advanced, contamination-free transport solutions. However, the overarching trend towards increased semiconductor production and the continuous evolution of wafer technology are expected to outweigh these challenges, driving sustained market penetration and adoption of innovative wafer transport solutions. Major industry players like Entegris and Shin-Etsu Polymer are at the forefront, investing in research and development to meet the evolving demands of the semiconductor industry.
This comprehensive report delivers an in-depth analysis of the global Thin Wafer Wafer Transport Boxes market, covering its intricate dynamics, growth trajectories, regional dominance, product innovations, and competitive landscape. Spanning a study period from 2019 to 2033, with a base year of 2025, this report offers critical insights for stakeholders navigating the evolving semiconductor supply chain. We delve into parent and child market segments, identifying key growth drivers, emerging opportunities, and strategic imperatives for success.
Thin Wafer Wafer Transport Boxes Market Dynamics & Structure
The Thin Wafer Wafer Transport Boxes market is characterized by a moderate level of concentration, with key players like Entegris, Shin-Etsu Polymer, Miraial, Chuang King Enterprise, Gudeng Precision, 3S Korea, and Dainichi Shoji holding significant market shares. Technological innovation is a primary driver, fueled by the increasing demand for thinner wafers and enhanced wafer protection during manufacturing and transportation. The semiconductor industry's stringent quality standards and the miniaturization of electronic components necessitate advanced transport solutions, pushing innovation in materials science and box design. Regulatory frameworks, primarily related to environmental compliance and material safety, also influence market dynamics. Competitive product substitutes, though limited in the highly specialized field of thin wafer handling, are constantly being explored, ranging from advanced cushioning materials to entirely novel containment designs. End-user demographics are dominated by semiconductor foundries and Integrated Device Manufacturers (IDMs), who represent the primary consumers of these critical transport solutions. Mergers and Acquisitions (M&A) trends are observed as companies seek to consolidate market presence, expand product portfolios, and achieve economies of scale. For instance, the historical period (2019-2024) saw a notable XX M&A deal volume, indicating strategic consolidation. Barriers to innovation include the high cost of research and development for advanced materials and the rigorous qualification processes required for new products in the semiconductor industry.
Thin Wafer Wafer Transport Boxes Growth Trends & Insights
The global Thin Wafer Wafer Transport Boxes market is poised for substantial growth, projected to expand at a Compound Annual Growth Rate (CAGR) of XX% during the forecast period of 2025–2033. This robust expansion is underpinned by the escalating demand for semiconductors across diverse industries, including consumer electronics, automotive, and telecommunications. The increasing prevalence of advanced semiconductor manufacturing processes, which often involve thinner and more fragile wafers, directly translates into a heightened need for sophisticated wafer transport boxes that offer superior protection and handling capabilities. Market penetration is expected to reach XX% by 2033, driven by both the expansion of existing semiconductor manufacturing capacity and the establishment of new fabrication plants globally. Technological disruptions, such as advancements in polymer science for lighter yet stronger materials and the integration of smart features for real-time monitoring of environmental conditions within the boxes, are set to redefine market standards. Consumer behavior shifts are evident, with semiconductor manufacturers increasingly prioritizing supply chain resilience and the reduction of wafer breakage and contamination. This emphasis on quality and reliability is a significant growth accelerator. The market size evolution, from approximately $XX million units in 2019 to an estimated $XX million units in 2025, reflects this upward trajectory. Further projections indicate the market could reach $XX million units by 2033, highlighting the significant economic potential. The adoption rates of advanced FOSB and FOUP solutions with specialized features for thin wafer handling are particularly on the rise, indicating a growing awareness and demand for these specialized products. The increasing complexity of wafer designs and the push for higher yields in wafer fabrication are directly influencing the demand for premium wafer transport solutions.
Dominant Regions, Countries, or Segments in Thin Wafer Wafer Transport Boxes
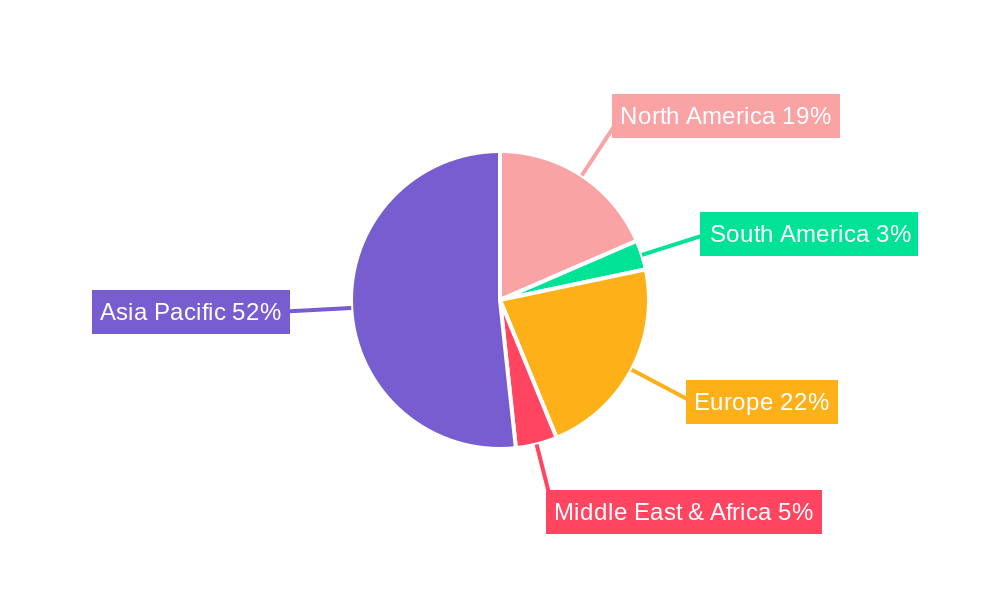
The Foundry segment, within the Application domain, is identified as the dominant force driving growth in the Thin Wafer Wafer Transport Boxes market. Foundries, which specialize in manufacturing semiconductor wafers for other companies, are at the forefront of adopting advanced wafer handling technologies due to their critical role in the semiconductor supply chain. The burgeoning demand for advanced chips in the age of AI, IoT, and 5G is significantly boosting foundry operations, thereby increasing their need for robust and reliable thin wafer transport boxes. The Asia Pacific region, particularly Taiwan and South Korea, stands out as the leading geographical market due to the concentrated presence of major foundries and IDMs. Economic policies in these regions, such as government incentives for semiconductor manufacturing and investment in advanced R&D, further bolster market growth. Infrastructure development, including the expansion of semiconductor manufacturing facilities and efficient logistics networks, also plays a crucial role. The market share within the Foundry segment is estimated to be XX% in 2025, with a projected growth rate of XX% during the forecast period.
- Key Drivers in the Foundry Segment:
- Increasing demand for advanced semiconductor nodes requiring thinner wafers.
- Expansion of foundry capacity to meet global chip demand.
- Stringent quality control requirements in high-volume manufacturing.
- Technological advancements in wafer fabrication leading to more delicate wafers.
- Dominance Factors:
- Concentration of major global semiconductor foundries in key Asian markets.
- Substantial investments in R&D and manufacturing by foundry leaders.
- Strong government support for the semiconductor industry in dominant regions.
- The 13 Pcs Capacity FOSB type, crucial for high-density wafer transport, shows significant market traction within this segment, estimated at XX% market share in 2025.
Thin Wafer Wafer Transport Boxes Product Landscape
The product landscape for Thin Wafer Wafer Transport Boxes is characterized by continuous innovation focused on enhanced protection, lightweight design, and improved handling efficiency. Manufacturers are developing boxes with advanced materials, such as specialized polymers and composites, to offer superior cushioning and electrostatic discharge (ESD) protection for delicate thin wafers. Innovations include improved sealing mechanisms to prevent contamination and maintain controlled environments. Performance metrics such as wafer breakage reduction, dimensional stability, and compatibility with automated handling systems are key differentiators. Unique selling propositions often lie in the customization options offered to meet specific wafer dimensions and customer process requirements, alongside adherence to industry standards like SEMI.
Key Drivers, Barriers & Challenges in Thin Wafer Wafer Transport Boxes
Key Drivers:
- Technological Advancements: The continuous miniaturization of electronics and the increasing demand for thinner, more fragile wafers necessitate specialized, high-performance transport boxes.
- Semiconductor Industry Growth: The robust expansion of the global semiconductor market, driven by AI, 5G, and IoT, directly fuels demand for wafer handling solutions.
- Supply Chain Reliability: End-users prioritize solutions that minimize wafer breakage and contamination, ensuring higher yields and production efficiency.
Key Barriers & Challenges:
- High R&D Costs: Developing advanced materials and designs for thin wafer transport involves significant research and development investments.
- Stringent Qualification Processes: New products must undergo rigorous testing and qualification by semiconductor manufacturers, leading to long adoption cycles.
- Supply Chain Volatility: Disruptions in raw material supply or logistics can impact production and delivery schedules. For example, a XX% increase in raw material costs can strain profit margins.
- Competitive Pressures: While specialized, intense competition exists among key players to offer superior performance and competitive pricing.
Emerging Opportunities in Thin Wafer Wafer Transport Boxes
Emerging opportunities lie in the development of smart wafer transport boxes equipped with real-time monitoring sensors for temperature, humidity, and vibration. These innovations can provide unprecedented supply chain visibility and proactively mitigate risks. Untapped markets in emerging semiconductor manufacturing hubs present significant growth potential. Furthermore, the increasing focus on sustainability is driving demand for recyclable and eco-friendly transport box materials. The application of these boxes in advanced packaging technologies and the development of specialized solutions for next-generation wafer materials also represent promising avenues for growth.
Growth Accelerators in the Thin Wafer Wafer Transport Boxes Industry
Catalysts driving long-term growth in the Thin Wafer Wafer Transport Boxes industry include strategic partnerships between material suppliers, box manufacturers, and semiconductor equipment providers to co-develop integrated solutions. Technological breakthroughs in material science, leading to lighter, stronger, and more environmentally friendly materials, will further accelerate adoption. The expanding global footprint of semiconductor manufacturing, particularly in regions like Southeast Asia and India, presents significant market expansion opportunities. Furthermore, the growing emphasis on automation in wafer handling will drive demand for transport boxes designed for seamless integration with robotic systems.
Key Players Shaping the Thin Wafer Wafer Transport Boxes Market
- Entegris
- Shin-Etsu Polymer
- Miraial
- Chuang King Enterprise
- Gudeng Precision
- 3S Korea
- Dainichi Shoji
Notable Milestones in Thin Wafer Wafer Transport Boxes Sector
- 2021/07: Entegris announces the launch of a new line of advanced wafer carriers designed for enhanced thin wafer protection.
- 2022/03: Shin-Etsu Polymer expands its manufacturing capacity to meet the growing demand for high-performance wafer transport solutions.
- 2022/11: Miraial develops a novel sealing technology for wafer transport boxes, significantly improving contamination control.
- 2023/05: Gudeng Precision introduces a lightweight yet robust FOSB designed for increased handling efficiency in automated fabs.
- 2023/10: Chuang King Enterprise highlights its commitment to sustainable materials in wafer transport box production.
In-Depth Thin Wafer Wafer Transport Boxes Market Outlook
The future market outlook for Thin Wafer Wafer Transport Boxes is exceptionally bright, propelled by sustained growth in the semiconductor industry and continuous technological advancements. The demand for specialized transport solutions for increasingly delicate and thin wafers will remain a primary growth accelerator. Strategic opportunities lie in the development of smart, integrated systems that enhance supply chain visibility and control, alongside a focus on sustainable and eco-friendly material innovations. The expansion into new geographical markets and the catering to evolving end-user preferences for enhanced protection and efficiency will solidify the market's upward trajectory. The market is projected to reach approximately $XX million units by 2033, indicating a significant expansion from its estimated $XX million units in 2025.
Thin Wafer Wafer Transport Boxes Segmentation
-
1. Application
- 1.1. Foundry
- 1.2. IDM
-
2. Type
- 2.1. 13 Pcs Capacity FOSB
- 2.2. 13 Pcs Capacity FOUP
Thin Wafer Wafer Transport Boxes Segmentation By Geography
-
1. North America
- 1.1. United States
- 1.2. Canada
- 1.3. Mexico
-
2. South America
- 2.1. Brazil
- 2.2. Argentina
- 2.3. Rest of South America
-
3. Europe
- 3.1. United Kingdom
- 3.2. Germany
- 3.3. France
- 3.4. Italy
- 3.5. Spain
- 3.6. Russia
- 3.7. Benelux
- 3.8. Nordics
- 3.9. Rest of Europe
-
4. Middle East & Africa
- 4.1. Turkey
- 4.2. Israel
- 4.3. GCC
- 4.4. North Africa
- 4.5. South Africa
- 4.6. Rest of Middle East & Africa
-
5. Asia Pacific
- 5.1. China
- 5.2. India
- 5.3. Japan
- 5.4. South Korea
- 5.5. ASEAN
- 5.6. Oceania
- 5.7. Rest of Asia Pacific
Thin Wafer Wafer Transport Boxes REPORT HIGHLIGHTS
| Aspects | Details |
|---|---|
| Study Period | 2019-2033 |
| Base Year | 2024 |
| Estimated Year | 2025 |
| Forecast Period | 2025-2033 |
| Historical Period | 2019-2024 |
| Growth Rate | CAGR of 7.6% from 2019-2033 |
| Segmentation |
|
Table of Contents
- 1. Introduction
- 1.1. Research Scope
- 1.2. Market Segmentation
- 1.3. Research Methodology
- 1.4. Definitions and Assumptions
- 2. Executive Summary
- 2.1. Introduction
- 3. Market Dynamics
- 3.1. Introduction
- 3.2. Market Drivers
- 3.3. Market Restrains
- 3.4. Market Trends
- 4. Market Factor Analysis
- 4.1. Porters Five Forces
- 4.2. Supply/Value Chain
- 4.3. PESTEL analysis
- 4.4. Market Entropy
- 4.5. Patent/Trademark Analysis
- 5. Global Thin Wafer Wafer Transport Boxes Analysis, Insights and Forecast, 2019-2031
- 5.1. Market Analysis, Insights and Forecast - by Application
- 5.1.1. Foundry
- 5.1.2. IDM
- 5.2. Market Analysis, Insights and Forecast - by Type
- 5.2.1. 13 Pcs Capacity FOSB
- 5.2.2. 13 Pcs Capacity FOUP
- 5.3. Market Analysis, Insights and Forecast - by Region
- 5.3.1. North America
- 5.3.2. South America
- 5.3.3. Europe
- 5.3.4. Middle East & Africa
- 5.3.5. Asia Pacific
- 5.1. Market Analysis, Insights and Forecast - by Application
- 6. North America Thin Wafer Wafer Transport Boxes Analysis, Insights and Forecast, 2019-2031
- 6.1. Market Analysis, Insights and Forecast - by Application
- 6.1.1. Foundry
- 6.1.2. IDM
- 6.2. Market Analysis, Insights and Forecast - by Type
- 6.2.1. 13 Pcs Capacity FOSB
- 6.2.2. 13 Pcs Capacity FOUP
- 6.1. Market Analysis, Insights and Forecast - by Application
- 7. South America Thin Wafer Wafer Transport Boxes Analysis, Insights and Forecast, 2019-2031
- 7.1. Market Analysis, Insights and Forecast - by Application
- 7.1.1. Foundry
- 7.1.2. IDM
- 7.2. Market Analysis, Insights and Forecast - by Type
- 7.2.1. 13 Pcs Capacity FOSB
- 7.2.2. 13 Pcs Capacity FOUP
- 7.1. Market Analysis, Insights and Forecast - by Application
- 8. Europe Thin Wafer Wafer Transport Boxes Analysis, Insights and Forecast, 2019-2031
- 8.1. Market Analysis, Insights and Forecast - by Application
- 8.1.1. Foundry
- 8.1.2. IDM
- 8.2. Market Analysis, Insights and Forecast - by Type
- 8.2.1. 13 Pcs Capacity FOSB
- 8.2.2. 13 Pcs Capacity FOUP
- 8.1. Market Analysis, Insights and Forecast - by Application
- 9. Middle East & Africa Thin Wafer Wafer Transport Boxes Analysis, Insights and Forecast, 2019-2031
- 9.1. Market Analysis, Insights and Forecast - by Application
- 9.1.1. Foundry
- 9.1.2. IDM
- 9.2. Market Analysis, Insights and Forecast - by Type
- 9.2.1. 13 Pcs Capacity FOSB
- 9.2.2. 13 Pcs Capacity FOUP
- 9.1. Market Analysis, Insights and Forecast - by Application
- 10. Asia Pacific Thin Wafer Wafer Transport Boxes Analysis, Insights and Forecast, 2019-2031
- 10.1. Market Analysis, Insights and Forecast - by Application
- 10.1.1. Foundry
- 10.1.2. IDM
- 10.2. Market Analysis, Insights and Forecast - by Type
- 10.2.1. 13 Pcs Capacity FOSB
- 10.2.2. 13 Pcs Capacity FOUP
- 10.1. Market Analysis, Insights and Forecast - by Application
- 11. Competitive Analysis
- 11.1. Global Market Share Analysis 2024
- 11.2. Company Profiles
- 11.2.1 Entegris
- 11.2.1.1. Overview
- 11.2.1.2. Products
- 11.2.1.3. SWOT Analysis
- 11.2.1.4. Recent Developments
- 11.2.1.5. Financials (Based on Availability)
- 11.2.2 Shin-Etsu Polymer
- 11.2.2.1. Overview
- 11.2.2.2. Products
- 11.2.2.3. SWOT Analysis
- 11.2.2.4. Recent Developments
- 11.2.2.5. Financials (Based on Availability)
- 11.2.3 Miraial
- 11.2.3.1. Overview
- 11.2.3.2. Products
- 11.2.3.3. SWOT Analysis
- 11.2.3.4. Recent Developments
- 11.2.3.5. Financials (Based on Availability)
- 11.2.4 Chuang King Enterprise
- 11.2.4.1. Overview
- 11.2.4.2. Products
- 11.2.4.3. SWOT Analysis
- 11.2.4.4. Recent Developments
- 11.2.4.5. Financials (Based on Availability)
- 11.2.5 Gudeng Precision
- 11.2.5.1. Overview
- 11.2.5.2. Products
- 11.2.5.3. SWOT Analysis
- 11.2.5.4. Recent Developments
- 11.2.5.5. Financials (Based on Availability)
- 11.2.6 3S Korea
- 11.2.6.1. Overview
- 11.2.6.2. Products
- 11.2.6.3. SWOT Analysis
- 11.2.6.4. Recent Developments
- 11.2.6.5. Financials (Based on Availability)
- 11.2.7 Dainichi Shoji
- 11.2.7.1. Overview
- 11.2.7.2. Products
- 11.2.7.3. SWOT Analysis
- 11.2.7.4. Recent Developments
- 11.2.7.5. Financials (Based on Availability)
- 11.2.1 Entegris
List of Figures
- Figure 1: Global Thin Wafer Wafer Transport Boxes Revenue Breakdown (million, %) by Region 2024 & 2032
- Figure 2: North America Thin Wafer Wafer Transport Boxes Revenue (million), by Application 2024 & 2032
- Figure 3: North America Thin Wafer Wafer Transport Boxes Revenue Share (%), by Application 2024 & 2032
- Figure 4: North America Thin Wafer Wafer Transport Boxes Revenue (million), by Type 2024 & 2032
- Figure 5: North America Thin Wafer Wafer Transport Boxes Revenue Share (%), by Type 2024 & 2032
- Figure 6: North America Thin Wafer Wafer Transport Boxes Revenue (million), by Country 2024 & 2032
- Figure 7: North America Thin Wafer Wafer Transport Boxes Revenue Share (%), by Country 2024 & 2032
- Figure 8: South America Thin Wafer Wafer Transport Boxes Revenue (million), by Application 2024 & 2032
- Figure 9: South America Thin Wafer Wafer Transport Boxes Revenue Share (%), by Application 2024 & 2032
- Figure 10: South America Thin Wafer Wafer Transport Boxes Revenue (million), by Type 2024 & 2032
- Figure 11: South America Thin Wafer Wafer Transport Boxes Revenue Share (%), by Type 2024 & 2032
- Figure 12: South America Thin Wafer Wafer Transport Boxes Revenue (million), by Country 2024 & 2032
- Figure 13: South America Thin Wafer Wafer Transport Boxes Revenue Share (%), by Country 2024 & 2032
- Figure 14: Europe Thin Wafer Wafer Transport Boxes Revenue (million), by Application 2024 & 2032
- Figure 15: Europe Thin Wafer Wafer Transport Boxes Revenue Share (%), by Application 2024 & 2032
- Figure 16: Europe Thin Wafer Wafer Transport Boxes Revenue (million), by Type 2024 & 2032
- Figure 17: Europe Thin Wafer Wafer Transport Boxes Revenue Share (%), by Type 2024 & 2032
- Figure 18: Europe Thin Wafer Wafer Transport Boxes Revenue (million), by Country 2024 & 2032
- Figure 19: Europe Thin Wafer Wafer Transport Boxes Revenue Share (%), by Country 2024 & 2032
- Figure 20: Middle East & Africa Thin Wafer Wafer Transport Boxes Revenue (million), by Application 2024 & 2032
- Figure 21: Middle East & Africa Thin Wafer Wafer Transport Boxes Revenue Share (%), by Application 2024 & 2032
- Figure 22: Middle East & Africa Thin Wafer Wafer Transport Boxes Revenue (million), by Type 2024 & 2032
- Figure 23: Middle East & Africa Thin Wafer Wafer Transport Boxes Revenue Share (%), by Type 2024 & 2032
- Figure 24: Middle East & Africa Thin Wafer Wafer Transport Boxes Revenue (million), by Country 2024 & 2032
- Figure 25: Middle East & Africa Thin Wafer Wafer Transport Boxes Revenue Share (%), by Country 2024 & 2032
- Figure 26: Asia Pacific Thin Wafer Wafer Transport Boxes Revenue (million), by Application 2024 & 2032
- Figure 27: Asia Pacific Thin Wafer Wafer Transport Boxes Revenue Share (%), by Application 2024 & 2032
- Figure 28: Asia Pacific Thin Wafer Wafer Transport Boxes Revenue (million), by Type 2024 & 2032
- Figure 29: Asia Pacific Thin Wafer Wafer Transport Boxes Revenue Share (%), by Type 2024 & 2032
- Figure 30: Asia Pacific Thin Wafer Wafer Transport Boxes Revenue (million), by Country 2024 & 2032
- Figure 31: Asia Pacific Thin Wafer Wafer Transport Boxes Revenue Share (%), by Country 2024 & 2032
List of Tables
- Table 1: Global Thin Wafer Wafer Transport Boxes Revenue million Forecast, by Region 2019 & 2032
- Table 2: Global Thin Wafer Wafer Transport Boxes Revenue million Forecast, by Application 2019 & 2032
- Table 3: Global Thin Wafer Wafer Transport Boxes Revenue million Forecast, by Type 2019 & 2032
- Table 4: Global Thin Wafer Wafer Transport Boxes Revenue million Forecast, by Region 2019 & 2032
- Table 5: Global Thin Wafer Wafer Transport Boxes Revenue million Forecast, by Application 2019 & 2032
- Table 6: Global Thin Wafer Wafer Transport Boxes Revenue million Forecast, by Type 2019 & 2032
- Table 7: Global Thin Wafer Wafer Transport Boxes Revenue million Forecast, by Country 2019 & 2032
- Table 8: United States Thin Wafer Wafer Transport Boxes Revenue (million) Forecast, by Application 2019 & 2032
- Table 9: Canada Thin Wafer Wafer Transport Boxes Revenue (million) Forecast, by Application 2019 & 2032
- Table 10: Mexico Thin Wafer Wafer Transport Boxes Revenue (million) Forecast, by Application 2019 & 2032
- Table 11: Global Thin Wafer Wafer Transport Boxes Revenue million Forecast, by Application 2019 & 2032
- Table 12: Global Thin Wafer Wafer Transport Boxes Revenue million Forecast, by Type 2019 & 2032
- Table 13: Global Thin Wafer Wafer Transport Boxes Revenue million Forecast, by Country 2019 & 2032
- Table 14: Brazil Thin Wafer Wafer Transport Boxes Revenue (million) Forecast, by Application 2019 & 2032
- Table 15: Argentina Thin Wafer Wafer Transport Boxes Revenue (million) Forecast, by Application 2019 & 2032
- Table 16: Rest of South America Thin Wafer Wafer Transport Boxes Revenue (million) Forecast, by Application 2019 & 2032
- Table 17: Global Thin Wafer Wafer Transport Boxes Revenue million Forecast, by Application 2019 & 2032
- Table 18: Global Thin Wafer Wafer Transport Boxes Revenue million Forecast, by Type 2019 & 2032
- Table 19: Global Thin Wafer Wafer Transport Boxes Revenue million Forecast, by Country 2019 & 2032
- Table 20: United Kingdom Thin Wafer Wafer Transport Boxes Revenue (million) Forecast, by Application 2019 & 2032
- Table 21: Germany Thin Wafer Wafer Transport Boxes Revenue (million) Forecast, by Application 2019 & 2032
- Table 22: France Thin Wafer Wafer Transport Boxes Revenue (million) Forecast, by Application 2019 & 2032
- Table 23: Italy Thin Wafer Wafer Transport Boxes Revenue (million) Forecast, by Application 2019 & 2032
- Table 24: Spain Thin Wafer Wafer Transport Boxes Revenue (million) Forecast, by Application 2019 & 2032
- Table 25: Russia Thin Wafer Wafer Transport Boxes Revenue (million) Forecast, by Application 2019 & 2032
- Table 26: Benelux Thin Wafer Wafer Transport Boxes Revenue (million) Forecast, by Application 2019 & 2032
- Table 27: Nordics Thin Wafer Wafer Transport Boxes Revenue (million) Forecast, by Application 2019 & 2032
- Table 28: Rest of Europe Thin Wafer Wafer Transport Boxes Revenue (million) Forecast, by Application 2019 & 2032
- Table 29: Global Thin Wafer Wafer Transport Boxes Revenue million Forecast, by Application 2019 & 2032
- Table 30: Global Thin Wafer Wafer Transport Boxes Revenue million Forecast, by Type 2019 & 2032
- Table 31: Global Thin Wafer Wafer Transport Boxes Revenue million Forecast, by Country 2019 & 2032
- Table 32: Turkey Thin Wafer Wafer Transport Boxes Revenue (million) Forecast, by Application 2019 & 2032
- Table 33: Israel Thin Wafer Wafer Transport Boxes Revenue (million) Forecast, by Application 2019 & 2032
- Table 34: GCC Thin Wafer Wafer Transport Boxes Revenue (million) Forecast, by Application 2019 & 2032
- Table 35: North Africa Thin Wafer Wafer Transport Boxes Revenue (million) Forecast, by Application 2019 & 2032
- Table 36: South Africa Thin Wafer Wafer Transport Boxes Revenue (million) Forecast, by Application 2019 & 2032
- Table 37: Rest of Middle East & Africa Thin Wafer Wafer Transport Boxes Revenue (million) Forecast, by Application 2019 & 2032
- Table 38: Global Thin Wafer Wafer Transport Boxes Revenue million Forecast, by Application 2019 & 2032
- Table 39: Global Thin Wafer Wafer Transport Boxes Revenue million Forecast, by Type 2019 & 2032
- Table 40: Global Thin Wafer Wafer Transport Boxes Revenue million Forecast, by Country 2019 & 2032
- Table 41: China Thin Wafer Wafer Transport Boxes Revenue (million) Forecast, by Application 2019 & 2032
- Table 42: India Thin Wafer Wafer Transport Boxes Revenue (million) Forecast, by Application 2019 & 2032
- Table 43: Japan Thin Wafer Wafer Transport Boxes Revenue (million) Forecast, by Application 2019 & 2032
- Table 44: South Korea Thin Wafer Wafer Transport Boxes Revenue (million) Forecast, by Application 2019 & 2032
- Table 45: ASEAN Thin Wafer Wafer Transport Boxes Revenue (million) Forecast, by Application 2019 & 2032
- Table 46: Oceania Thin Wafer Wafer Transport Boxes Revenue (million) Forecast, by Application 2019 & 2032
- Table 47: Rest of Asia Pacific Thin Wafer Wafer Transport Boxes Revenue (million) Forecast, by Application 2019 & 2032
Frequently Asked Questions
1. What is the projected Compound Annual Growth Rate (CAGR) of the Thin Wafer Wafer Transport Boxes?
The projected CAGR is approximately 7.6%.
2. Which companies are prominent players in the Thin Wafer Wafer Transport Boxes?
Key companies in the market include Entegris, Shin-Etsu Polymer, Miraial, Chuang King Enterprise, Gudeng Precision, 3S Korea, Dainichi Shoji.
3. What are the main segments of the Thin Wafer Wafer Transport Boxes?
The market segments include Application, Type.
4. Can you provide details about the market size?
The market size is estimated to be USD 343 million as of 2022.
5. What are some drivers contributing to market growth?
N/A
6. What are the notable trends driving market growth?
N/A
7. Are there any restraints impacting market growth?
N/A
8. Can you provide examples of recent developments in the market?
N/A
9. What pricing options are available for accessing the report?
Pricing options include single-user, multi-user, and enterprise licenses priced at USD 4250.00, USD 6375.00, and USD 8500.00 respectively.
10. Is the market size provided in terms of value or volume?
The market size is provided in terms of value, measured in million.
11. Are there any specific market keywords associated with the report?
Yes, the market keyword associated with the report is "Thin Wafer Wafer Transport Boxes," which aids in identifying and referencing the specific market segment covered.
12. How do I determine which pricing option suits my needs best?
The pricing options vary based on user requirements and access needs. Individual users may opt for single-user licenses, while businesses requiring broader access may choose multi-user or enterprise licenses for cost-effective access to the report.
13. Are there any additional resources or data provided in the Thin Wafer Wafer Transport Boxes report?
While the report offers comprehensive insights, it's advisable to review the specific contents or supplementary materials provided to ascertain if additional resources or data are available.
14. How can I stay updated on further developments or reports in the Thin Wafer Wafer Transport Boxes?
To stay informed about further developments, trends, and reports in the Thin Wafer Wafer Transport Boxes, consider subscribing to industry newsletters, following relevant companies and organizations, or regularly checking reputable industry news sources and publications.
Methodology
Step 1 - Identification of Relevant Samples Size from Population Database


Step 2 - Approaches for Defining Global Market Size (Value, Volume* & Price*)

Note*: In applicable scenarios
Step 3 - Data Sources
Primary Research
- Web Analytics
- Survey Reports
- Research Institute
- Latest Research Reports
- Opinion Leaders
Secondary Research
- Annual Reports
- White Paper
- Latest Press Release
- Industry Association
- Paid Database
- Investor Presentations

Step 4 - Data Triangulation
Involves using different sources of information in order to increase the validity of a study
These sources are likely to be stakeholders in a program - participants, other researchers, program staff, other community members, and so on.
Then we put all data in single framework & apply various statistical tools to find out the dynamic on the market.
During the analysis stage, feedback from the stakeholder groups would be compared to determine areas of agreement as well as areas of divergence
