

Key Insights
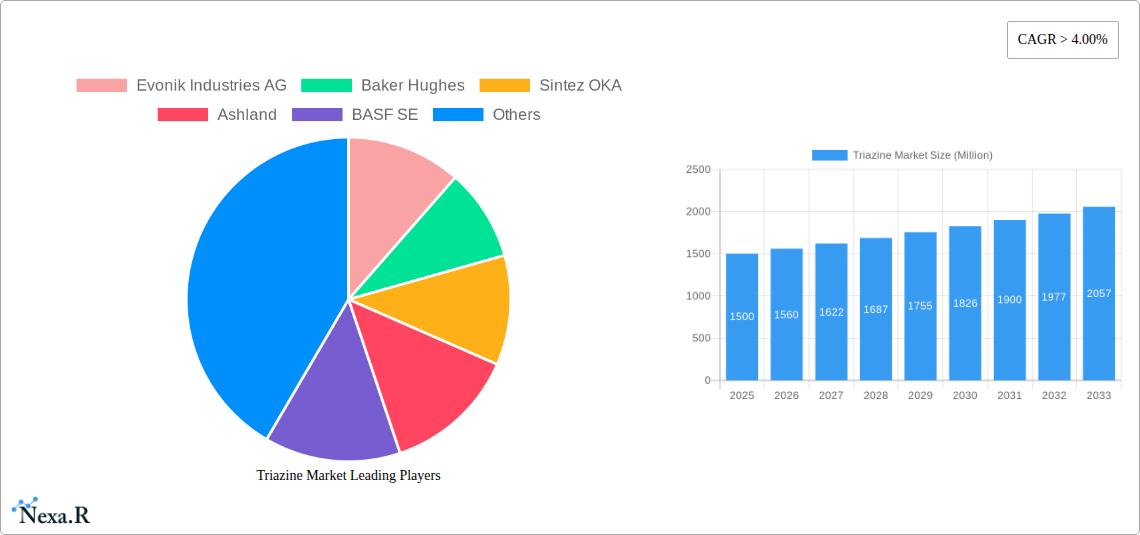
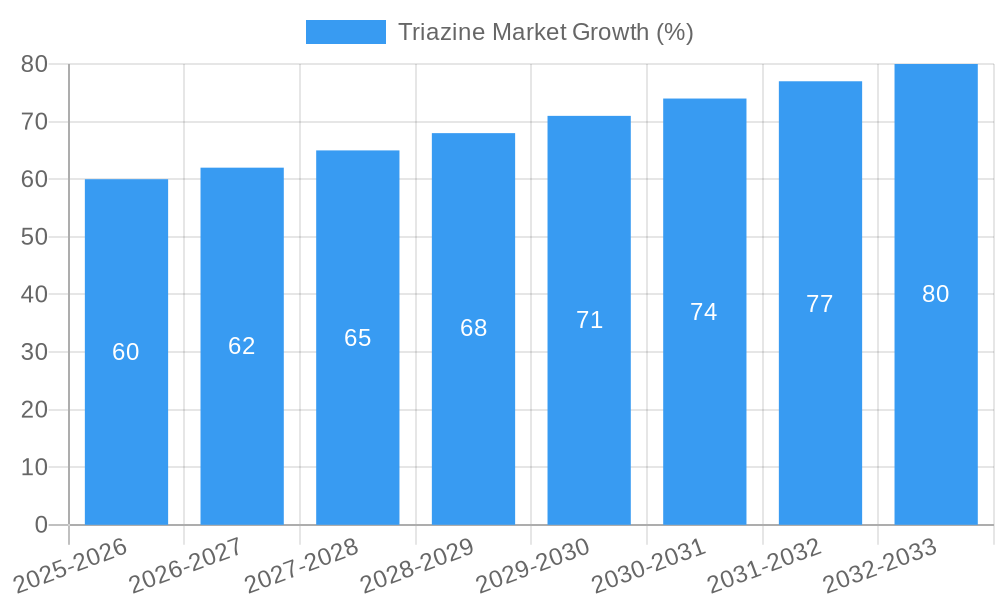
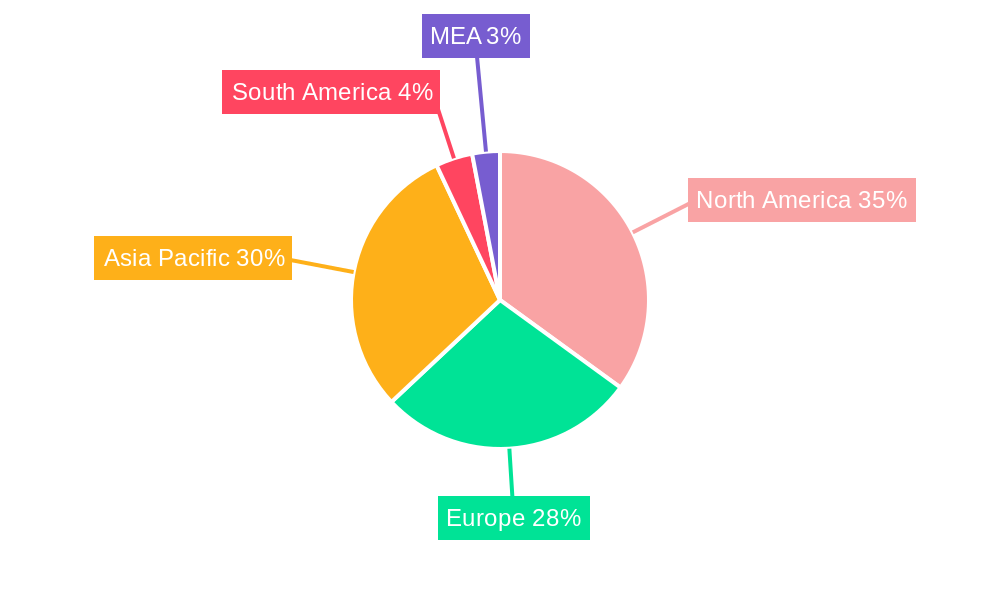
The global triazine market is experiencing robust growth, projected to maintain a CAGR exceeding 4% from 2025 to 2033. This expansion is driven by the increasing demand for triazine derivatives across diverse applications, particularly in chemical processing, herbicides, and water treatment. The rise of sustainable agricultural practices and stringent regulations regarding water purification are key factors fueling market growth. Furthermore, the expanding oil and gas sector contributes significantly to the demand for triazine-based products, especially in applications requiring effective corrosion inhibitors and scale preventatives. Key players like Evonik Industries AG, BASF SE, and Ashland are strategically investing in research and development to enhance product efficacy and expand their market share. The market is segmented by derivative type (melamine, cyanuric chloride, cyanuric acid) and application, offering diverse opportunities for specialized product development and targeted market penetration. Competition is relatively high, necessitating continuous innovation and strategic partnerships to maintain a competitive edge. Regional variations in market growth are expected, with North America and Asia-Pacific likely to remain dominant regions due to established industrial infrastructure and substantial consumer demand.
The market's growth trajectory is influenced by several factors. While the increasing demand for high-performance chemicals is a significant driver, potential restraints include fluctuating raw material prices and environmental concerns associated with certain triazine derivatives. Companies are actively addressing these challenges by investing in sustainable production methods and exploring alternative raw material sources. The future growth of the triazine market will be significantly shaped by technological advancements leading to more efficient and environmentally friendly production processes, as well as the development of novel triazine-based products catering to emerging applications in various industries. A deeper understanding of regional regulations and consumer preferences will be crucial for companies seeking long-term success in this dynamic market.
Triazine Market Report: A Comprehensive Analysis (2019-2033)
This comprehensive report provides an in-depth analysis of the Triazine market, offering invaluable insights for industry professionals, investors, and strategic decision-makers. With a focus on market dynamics, growth trends, and competitive landscapes, this report covers the period from 2019 to 2033, utilizing 2025 as the base and estimated year. The report segments the market by derivative (Melamine, Cyanuric Chloride, Cyanuric Acid) and application (Chemical Processing, Herbicides, Dyes, Water Treatment, Oil and Gas, Other Applications), providing granular data and analysis for informed strategic planning. The Triazine market, a crucial sub-segment within the larger chemical industry, is poised for significant growth, driven by factors explored in detail within this report. The global market size is projected at xx Million in 2025 and expected to reach xx Million by 2033, exhibiting a CAGR of xx%.
Triazine Market Market Dynamics & Structure
This section analyzes the Triazine market's structure, identifying key players and their market shares. We examine the competitive intensity, exploring M&A activity and the role of technological innovation. Regulatory frameworks and their impact on market growth are also assessed, along with an examination of substitute products and their potential threat. The report also dives into end-user demographics and their influence on market demand.
- Market Concentration: The Triazine market exhibits a moderately concentrated structure, with the top 5 players holding approximately xx% of the market share in 2025.
- Technological Innovation: Continuous R&D efforts focusing on improved production efficiency and environmentally friendly processes are key drivers. Innovation barriers include high R&D costs and stringent regulatory requirements.
- Regulatory Landscape: Stringent environmental regulations across various regions significantly impact production methods and product formulations.
- Competitive Substitutes: The market faces competition from alternative chemicals in specific applications, impacting overall demand.
- M&A Activity: The past five years have witnessed xx M&A deals in the Triazine market, primarily focused on expanding geographical reach and product portfolios.
- End-User Demographics: Growth is fueled by the increasing demand from diverse industries, including agriculture, textile, and water treatment.
Triazine Market Growth Trends & Insights
This section provides a detailed analysis of the Triazine market's growth trajectory, examining historical data (2019-2024) and projecting future growth (2025-2033). We analyze adoption rates across various applications, identifying key growth drivers and exploring technological disruptions. Consumer behavior shifts and their impact on market demand are also investigated. The report utilizes a combination of quantitative and qualitative data to offer a comprehensive overview of market trends.
The global Triazine market experienced significant growth during the historical period (2019-2024), driven by increasing demand from the agricultural sector and advancements in water treatment technologies. The market is expected to continue its upward trajectory in the forecast period (2025-2033), with a projected CAGR of xx%. This growth is attributed to several factors, including the rising global population, increasing industrialization, and the growing need for efficient and sustainable solutions in various applications. Technological advancements, particularly in the synthesis of Triazine derivatives, are also expected to contribute significantly to market expansion.
Dominant Regions, Countries, or Segments in Triazine Market
This section identifies the leading regions, countries, and segments within the Triazine market, providing insights into their dominance factors and growth potential. Key drivers in each region are analyzed, including economic policies, infrastructure development, and government regulations. Market share and growth projections are presented for each dominant segment.
Leading Region: Asia-Pacific is projected to dominate the market due to rapid industrialization and high demand from the agricultural and textile sectors. Its market share is expected to be approximately xx% in 2025.
Leading Segment (Derivative): Cyanuric Chloride holds the largest market share, driven by its extensive use in the pool and spa chemicals industry.
Leading Segment (Application): The herbicides segment is expected to exhibit the highest growth rate, driven by the increasing demand for high-yielding crops.
Key Drivers in Asia-Pacific:
- Rapid economic growth and industrialization.
- Increasing agricultural activities.
- Favorable government policies promoting chemical production.
Triazine Market Product Landscape
The Triazine market offers a diverse range of products, characterized by variations in purity, formulation, and application-specific properties. Recent innovations focus on improving the efficiency and sustainability of Triazine-based products, including the development of more environmentally friendly synthesis methods and the introduction of new formulations tailored to specific end-use applications. These advancements aim to enhance product performance, reduce environmental impact, and broaden the applicability of Triazines across various industrial sectors.
Key Drivers, Barriers & Challenges in Triazine Market
Key Drivers:
- Rising demand from the agricultural sector, driven by the increasing global population and the need for higher crop yields.
- Increasing applications in water treatment and industrial cleaning, propelled by stricter environmental regulations.
- Technological advancements enabling more efficient and sustainable production processes.
Key Barriers and Challenges:
- Fluctuations in raw material prices impacting production costs.
- Stringent environmental regulations increasing compliance costs.
- Intense competition among established players and the emergence of new entrants.
Emerging Opportunities in Triazine Market
Emerging opportunities lie in untapped markets, particularly in developing economies with growing industrial sectors. Innovative applications in advanced materials, pharmaceuticals, and electronics present significant growth potential. Evolving consumer preferences toward more sustainable and environmentally friendly products will drive demand for bio-based Triazine derivatives.
Growth Accelerators in the Triazine Market Industry
Several factors are poised to accelerate the Triazine market's growth in the coming years. Technological breakthroughs in synthesis methods will enhance efficiency and reduce production costs. Strategic partnerships and collaborations will drive innovation and broaden market reach. Expansion into new and emerging markets, particularly in developing economies, will unlock considerable growth potential.
Key Players Shaping the Triazine Market Market
- Evonik Industries AG
- Baker Hughes
- Sintez OKA
- Ashland
- BASF SE
- Eastman Chemical Company
- Hexion
- Halliburton
- Lonza
- Haihang Industry Co Ltd
Notable Milestones in Triazine Market Sector
- 2021 Q3: BASF SE launched a new generation of Triazine-based herbicides with enhanced efficacy and reduced environmental impact.
- 2022 Q1: Evonik Industries AG announced a strategic partnership to expand its Triazine production capacity in Asia.
- 2023 Q2: Acquisition of a smaller Triazine producer by a major player, further consolidating the market. (Details are not available in this context, this is a sample milestone)
In-Depth Triazine Market Market Outlook
The Triazine market is poised for continued growth, driven by technological advancements, expanding applications, and increased demand across diverse sectors. Strategic investments in R&D, capacity expansion, and sustainable production practices will be crucial for success. The market's future potential is significant, presenting attractive opportunities for both established players and new entrants.
Triazine Market Segmentation
-
1. Derivative
- 1.1. Melamine
- 1.2. Cyanuric Chloride
- 1.3. Cyanuric Acid
-
2. Application
- 2.1. Chemical Processing
- 2.2. Herbicides
- 2.3. Dyes
- 2.4. Water Treatment
- 2.5. Oil and Gas
- 2.6. Other Applications
Triazine Market Segmentation By Geography
-
1. Asia Pacific
- 1.1. China
- 1.2. India
- 1.3. Japan
- 1.4. South Korea
- 1.5. Southeast Asia
- 1.6. Australia
- 1.7. Rest of Asia Pacific
-
2. North America
- 2.1. United States
- 2.2. Canada
- 2.3. Mexico
-
3. Europe
- 3.1. Germany
- 3.2. United Kingdom
- 3.3. France
- 3.4. Italy
- 3.5. Spain
- 3.6. Rest of Europe
-
4. South America
- 4.1. Brazil
- 4.2. Argentina
- 4.3. Rest of South America
-
5. Middle East & Africa
- 5.1. UAE
- 5.2. Saudi Arabia
- 5.3. Nigeria
- 5.4. South Africa
- 5.5. REst of Middle East & Africa
Triazine Market REPORT HIGHLIGHTS
| Aspects | Details |
|---|---|
| Study Period | 2019-2033 |
| Base Year | 2024 |
| Estimated Year | 2025 |
| Forecast Period | 2025-2033 |
| Historical Period | 2019-2024 |
| Growth Rate | CAGR of > 4.00% from 2019-2033 |
| Segmentation |
|
Table of Contents
- 1. Introduction
- 1.1. Research Scope
- 1.2. Market Segmentation
- 1.3. Research Methodology
- 1.4. Definitions and Assumptions
- 2. Executive Summary
- 2.1. Introduction
- 3. Market Dynamics
- 3.1. Introduction
- 3.2. Market Drivers
- 3.2.1. ; Growing Demand from Construction Sector; Rising Demand for Fuel Efficient and Light-weight Vehicles
- 3.3. Market Restrains
- 3.3.1. ; Increasing Consumer Concerns about Formaldehyde Emission from Melamine-based Molding Compounds; Other Restraints
- 3.4. Market Trends
- 3.4.1. Melamine to Dominate the Market
- 4. Market Factor Analysis
- 4.1. Porters Five Forces
- 4.2. Supply/Value Chain
- 4.3. PESTEL analysis
- 4.4. Market Entropy
- 4.5. Patent/Trademark Analysis
- 5. Global Triazine Market Analysis, Insights and Forecast, 2019-2031
- 5.1. Market Analysis, Insights and Forecast - by Derivative
- 5.1.1. Melamine
- 5.1.2. Cyanuric Chloride
- 5.1.3. Cyanuric Acid
- 5.2. Market Analysis, Insights and Forecast - by Application
- 5.2.1. Chemical Processing
- 5.2.2. Herbicides
- 5.2.3. Dyes
- 5.2.4. Water Treatment
- 5.2.5. Oil and Gas
- 5.2.6. Other Applications
- 5.3. Market Analysis, Insights and Forecast - by Region
- 5.3.1. Asia Pacific
- 5.3.2. North America
- 5.3.3. Europe
- 5.3.4. South America
- 5.3.5. Middle East & Africa
- 5.1. Market Analysis, Insights and Forecast - by Derivative
- 6. Asia Pacific Triazine Market Analysis, Insights and Forecast, 2019-2031
- 6.1. Market Analysis, Insights and Forecast - by Derivative
- 6.1.1. Melamine
- 6.1.2. Cyanuric Chloride
- 6.1.3. Cyanuric Acid
- 6.2. Market Analysis, Insights and Forecast - by Application
- 6.2.1. Chemical Processing
- 6.2.2. Herbicides
- 6.2.3. Dyes
- 6.2.4. Water Treatment
- 6.2.5. Oil and Gas
- 6.2.6. Other Applications
- 6.1. Market Analysis, Insights and Forecast - by Derivative
- 7. North America Triazine Market Analysis, Insights and Forecast, 2019-2031
- 7.1. Market Analysis, Insights and Forecast - by Derivative
- 7.1.1. Melamine
- 7.1.2. Cyanuric Chloride
- 7.1.3. Cyanuric Acid
- 7.2. Market Analysis, Insights and Forecast - by Application
- 7.2.1. Chemical Processing
- 7.2.2. Herbicides
- 7.2.3. Dyes
- 7.2.4. Water Treatment
- 7.2.5. Oil and Gas
- 7.2.6. Other Applications
- 7.1. Market Analysis, Insights and Forecast - by Derivative
- 8. Europe Triazine Market Analysis, Insights and Forecast, 2019-2031
- 8.1. Market Analysis, Insights and Forecast - by Derivative
- 8.1.1. Melamine
- 8.1.2. Cyanuric Chloride
- 8.1.3. Cyanuric Acid
- 8.2. Market Analysis, Insights and Forecast - by Application
- 8.2.1. Chemical Processing
- 8.2.2. Herbicides
- 8.2.3. Dyes
- 8.2.4. Water Treatment
- 8.2.5. Oil and Gas
- 8.2.6. Other Applications
- 8.1. Market Analysis, Insights and Forecast - by Derivative
- 9. South America Triazine Market Analysis, Insights and Forecast, 2019-2031
- 9.1. Market Analysis, Insights and Forecast - by Derivative
- 9.1.1. Melamine
- 9.1.2. Cyanuric Chloride
- 9.1.3. Cyanuric Acid
- 9.2. Market Analysis, Insights and Forecast - by Application
- 9.2.1. Chemical Processing
- 9.2.2. Herbicides
- 9.2.3. Dyes
- 9.2.4. Water Treatment
- 9.2.5. Oil and Gas
- 9.2.6. Other Applications
- 9.1. Market Analysis, Insights and Forecast - by Derivative
- 10. Middle East & Africa Triazine Market Analysis, Insights and Forecast, 2019-2031
- 10.1. Market Analysis, Insights and Forecast - by Derivative
- 10.1.1. Melamine
- 10.1.2. Cyanuric Chloride
- 10.1.3. Cyanuric Acid
- 10.2. Market Analysis, Insights and Forecast - by Application
- 10.2.1. Chemical Processing
- 10.2.2. Herbicides
- 10.2.3. Dyes
- 10.2.4. Water Treatment
- 10.2.5. Oil and Gas
- 10.2.6. Other Applications
- 10.1. Market Analysis, Insights and Forecast - by Derivative
- 11. North America Triazine Market Analysis, Insights and Forecast, 2019-2031
- 11.1. Market Analysis, Insights and Forecast - By Country/Sub-region
- 11.1.1 United States
- 11.1.2 Canada
- 11.1.3 Mexico
- 12. Europe Triazine Market Analysis, Insights and Forecast, 2019-2031
- 12.1. Market Analysis, Insights and Forecast - By Country/Sub-region
- 12.1.1 Germany
- 12.1.2 United Kingdom
- 12.1.3 France
- 12.1.4 Spain
- 12.1.5 Italy
- 12.1.6 Spain
- 12.1.7 Belgium
- 12.1.8 Netherland
- 12.1.9 Nordics
- 12.1.10 Rest of Europe
- 13. Asia Pacific Triazine Market Analysis, Insights and Forecast, 2019-2031
- 13.1. Market Analysis, Insights and Forecast - By Country/Sub-region
- 13.1.1 China
- 13.1.2 Japan
- 13.1.3 India
- 13.1.4 South Korea
- 13.1.5 Southeast Asia
- 13.1.6 Australia
- 13.1.7 Indonesia
- 13.1.8 Phillipes
- 13.1.9 Singapore
- 13.1.10 Thailandc
- 13.1.11 Rest of Asia Pacific
- 14. South America Triazine Market Analysis, Insights and Forecast, 2019-2031
- 14.1. Market Analysis, Insights and Forecast - By Country/Sub-region
- 14.1.1 Brazil
- 14.1.2 Argentina
- 14.1.3 Peru
- 14.1.4 Chile
- 14.1.5 Colombia
- 14.1.6 Ecuador
- 14.1.7 Venezuela
- 14.1.8 Rest of South America
- 15. North America Triazine Market Analysis, Insights and Forecast, 2019-2031
- 15.1. Market Analysis, Insights and Forecast - By Country/Sub-region
- 15.1.1 United States
- 15.1.2 Canada
- 15.1.3 Mexico
- 16. MEA Triazine Market Analysis, Insights and Forecast, 2019-2031
- 16.1. Market Analysis, Insights and Forecast - By Country/Sub-region
- 16.1.1 United Arab Emirates
- 16.1.2 Saudi Arabia
- 16.1.3 South Africa
- 16.1.4 Rest of Middle East and Africa
- 17. Competitive Analysis
- 17.1. Global Market Share Analysis 2024
- 17.2. Company Profiles
- 17.2.1 Evonik Industries AG
- 17.2.1.1. Overview
- 17.2.1.2. Products
- 17.2.1.3. SWOT Analysis
- 17.2.1.4. Recent Developments
- 17.2.1.5. Financials (Based on Availability)
- 17.2.2 Baker Hughes
- 17.2.2.1. Overview
- 17.2.2.2. Products
- 17.2.2.3. SWOT Analysis
- 17.2.2.4. Recent Developments
- 17.2.2.5. Financials (Based on Availability)
- 17.2.3 Sintez OKA
- 17.2.3.1. Overview
- 17.2.3.2. Products
- 17.2.3.3. SWOT Analysis
- 17.2.3.4. Recent Developments
- 17.2.3.5. Financials (Based on Availability)
- 17.2.4 Ashland
- 17.2.4.1. Overview
- 17.2.4.2. Products
- 17.2.4.3. SWOT Analysis
- 17.2.4.4. Recent Developments
- 17.2.4.5. Financials (Based on Availability)
- 17.2.5 BASF SE
- 17.2.5.1. Overview
- 17.2.5.2. Products
- 17.2.5.3. SWOT Analysis
- 17.2.5.4. Recent Developments
- 17.2.5.5. Financials (Based on Availability)
- 17.2.6 Eastman Chemical Company
- 17.2.6.1. Overview
- 17.2.6.2. Products
- 17.2.6.3. SWOT Analysis
- 17.2.6.4. Recent Developments
- 17.2.6.5. Financials (Based on Availability)
- 17.2.7 Hexion
- 17.2.7.1. Overview
- 17.2.7.2. Products
- 17.2.7.3. SWOT Analysis
- 17.2.7.4. Recent Developments
- 17.2.7.5. Financials (Based on Availability)
- 17.2.8 Halliburton
- 17.2.8.1. Overview
- 17.2.8.2. Products
- 17.2.8.3. SWOT Analysis
- 17.2.8.4. Recent Developments
- 17.2.8.5. Financials (Based on Availability)
- 17.2.9 Lonza
- 17.2.9.1. Overview
- 17.2.9.2. Products
- 17.2.9.3. SWOT Analysis
- 17.2.9.4. Recent Developments
- 17.2.9.5. Financials (Based on Availability)
- 17.2.10 Haihang Industry Co Ltd
- 17.2.10.1. Overview
- 17.2.10.2. Products
- 17.2.10.3. SWOT Analysis
- 17.2.10.4. Recent Developments
- 17.2.10.5. Financials (Based on Availability)
- 17.2.1 Evonik Industries AG
List of Figures
- Figure 1: Global Triazine Market Revenue Breakdown (Million, %) by Region 2024 & 2032
- Figure 2: Global Triazine Market Volume Breakdown (K Tons, %) by Region 2024 & 2032
- Figure 3: North America Triazine Market Revenue (Million), by Country 2024 & 2032
- Figure 4: North America Triazine Market Volume (K Tons), by Country 2024 & 2032
- Figure 5: North America Triazine Market Revenue Share (%), by Country 2024 & 2032
- Figure 6: North America Triazine Market Volume Share (%), by Country 2024 & 2032
- Figure 7: Europe Triazine Market Revenue (Million), by Country 2024 & 2032
- Figure 8: Europe Triazine Market Volume (K Tons), by Country 2024 & 2032
- Figure 9: Europe Triazine Market Revenue Share (%), by Country 2024 & 2032
- Figure 10: Europe Triazine Market Volume Share (%), by Country 2024 & 2032
- Figure 11: Asia Pacific Triazine Market Revenue (Million), by Country 2024 & 2032
- Figure 12: Asia Pacific Triazine Market Volume (K Tons), by Country 2024 & 2032
- Figure 13: Asia Pacific Triazine Market Revenue Share (%), by Country 2024 & 2032
- Figure 14: Asia Pacific Triazine Market Volume Share (%), by Country 2024 & 2032
- Figure 15: South America Triazine Market Revenue (Million), by Country 2024 & 2032
- Figure 16: South America Triazine Market Volume (K Tons), by Country 2024 & 2032
- Figure 17: South America Triazine Market Revenue Share (%), by Country 2024 & 2032
- Figure 18: South America Triazine Market Volume Share (%), by Country 2024 & 2032
- Figure 19: North America Triazine Market Revenue (Million), by Country 2024 & 2032
- Figure 20: North America Triazine Market Volume (K Tons), by Country 2024 & 2032
- Figure 21: North America Triazine Market Revenue Share (%), by Country 2024 & 2032
- Figure 22: North America Triazine Market Volume Share (%), by Country 2024 & 2032
- Figure 23: MEA Triazine Market Revenue (Million), by Country 2024 & 2032
- Figure 24: MEA Triazine Market Volume (K Tons), by Country 2024 & 2032
- Figure 25: MEA Triazine Market Revenue Share (%), by Country 2024 & 2032
- Figure 26: MEA Triazine Market Volume Share (%), by Country 2024 & 2032
- Figure 27: Asia Pacific Triazine Market Revenue (Million), by Derivative 2024 & 2032
- Figure 28: Asia Pacific Triazine Market Volume (K Tons), by Derivative 2024 & 2032
- Figure 29: Asia Pacific Triazine Market Revenue Share (%), by Derivative 2024 & 2032
- Figure 30: Asia Pacific Triazine Market Volume Share (%), by Derivative 2024 & 2032
- Figure 31: Asia Pacific Triazine Market Revenue (Million), by Application 2024 & 2032
- Figure 32: Asia Pacific Triazine Market Volume (K Tons), by Application 2024 & 2032
- Figure 33: Asia Pacific Triazine Market Revenue Share (%), by Application 2024 & 2032
- Figure 34: Asia Pacific Triazine Market Volume Share (%), by Application 2024 & 2032
- Figure 35: Asia Pacific Triazine Market Revenue (Million), by Country 2024 & 2032
- Figure 36: Asia Pacific Triazine Market Volume (K Tons), by Country 2024 & 2032
- Figure 37: Asia Pacific Triazine Market Revenue Share (%), by Country 2024 & 2032
- Figure 38: Asia Pacific Triazine Market Volume Share (%), by Country 2024 & 2032
- Figure 39: North America Triazine Market Revenue (Million), by Derivative 2024 & 2032
- Figure 40: North America Triazine Market Volume (K Tons), by Derivative 2024 & 2032
- Figure 41: North America Triazine Market Revenue Share (%), by Derivative 2024 & 2032
- Figure 42: North America Triazine Market Volume Share (%), by Derivative 2024 & 2032
- Figure 43: North America Triazine Market Revenue (Million), by Application 2024 & 2032
- Figure 44: North America Triazine Market Volume (K Tons), by Application 2024 & 2032
- Figure 45: North America Triazine Market Revenue Share (%), by Application 2024 & 2032
- Figure 46: North America Triazine Market Volume Share (%), by Application 2024 & 2032
- Figure 47: North America Triazine Market Revenue (Million), by Country 2024 & 2032
- Figure 48: North America Triazine Market Volume (K Tons), by Country 2024 & 2032
- Figure 49: North America Triazine Market Revenue Share (%), by Country 2024 & 2032
- Figure 50: North America Triazine Market Volume Share (%), by Country 2024 & 2032
- Figure 51: Europe Triazine Market Revenue (Million), by Derivative 2024 & 2032
- Figure 52: Europe Triazine Market Volume (K Tons), by Derivative 2024 & 2032
- Figure 53: Europe Triazine Market Revenue Share (%), by Derivative 2024 & 2032
- Figure 54: Europe Triazine Market Volume Share (%), by Derivative 2024 & 2032
- Figure 55: Europe Triazine Market Revenue (Million), by Application 2024 & 2032
- Figure 56: Europe Triazine Market Volume (K Tons), by Application 2024 & 2032
- Figure 57: Europe Triazine Market Revenue Share (%), by Application 2024 & 2032
- Figure 58: Europe Triazine Market Volume Share (%), by Application 2024 & 2032
- Figure 59: Europe Triazine Market Revenue (Million), by Country 2024 & 2032
- Figure 60: Europe Triazine Market Volume (K Tons), by Country 2024 & 2032
- Figure 61: Europe Triazine Market Revenue Share (%), by Country 2024 & 2032
- Figure 62: Europe Triazine Market Volume Share (%), by Country 2024 & 2032
- Figure 63: South America Triazine Market Revenue (Million), by Derivative 2024 & 2032
- Figure 64: South America Triazine Market Volume (K Tons), by Derivative 2024 & 2032
- Figure 65: South America Triazine Market Revenue Share (%), by Derivative 2024 & 2032
- Figure 66: South America Triazine Market Volume Share (%), by Derivative 2024 & 2032
- Figure 67: South America Triazine Market Revenue (Million), by Application 2024 & 2032
- Figure 68: South America Triazine Market Volume (K Tons), by Application 2024 & 2032
- Figure 69: South America Triazine Market Revenue Share (%), by Application 2024 & 2032
- Figure 70: South America Triazine Market Volume Share (%), by Application 2024 & 2032
- Figure 71: South America Triazine Market Revenue (Million), by Country 2024 & 2032
- Figure 72: South America Triazine Market Volume (K Tons), by Country 2024 & 2032
- Figure 73: South America Triazine Market Revenue Share (%), by Country 2024 & 2032
- Figure 74: South America Triazine Market Volume Share (%), by Country 2024 & 2032
- Figure 75: Middle East & Africa Triazine Market Revenue (Million), by Derivative 2024 & 2032
- Figure 76: Middle East & Africa Triazine Market Volume (K Tons), by Derivative 2024 & 2032
- Figure 77: Middle East & Africa Triazine Market Revenue Share (%), by Derivative 2024 & 2032
- Figure 78: Middle East & Africa Triazine Market Volume Share (%), by Derivative 2024 & 2032
- Figure 79: Middle East & Africa Triazine Market Revenue (Million), by Application 2024 & 2032
- Figure 80: Middle East & Africa Triazine Market Volume (K Tons), by Application 2024 & 2032
- Figure 81: Middle East & Africa Triazine Market Revenue Share (%), by Application 2024 & 2032
- Figure 82: Middle East & Africa Triazine Market Volume Share (%), by Application 2024 & 2032
- Figure 83: Middle East & Africa Triazine Market Revenue (Million), by Country 2024 & 2032
- Figure 84: Middle East & Africa Triazine Market Volume (K Tons), by Country 2024 & 2032
- Figure 85: Middle East & Africa Triazine Market Revenue Share (%), by Country 2024 & 2032
- Figure 86: Middle East & Africa Triazine Market Volume Share (%), by Country 2024 & 2032
List of Tables
- Table 1: Global Triazine Market Revenue Million Forecast, by Region 2019 & 2032
- Table 2: Global Triazine Market Volume K Tons Forecast, by Region 2019 & 2032
- Table 3: Global Triazine Market Revenue Million Forecast, by Derivative 2019 & 2032
- Table 4: Global Triazine Market Volume K Tons Forecast, by Derivative 2019 & 2032
- Table 5: Global Triazine Market Revenue Million Forecast, by Application 2019 & 2032
- Table 6: Global Triazine Market Volume K Tons Forecast, by Application 2019 & 2032
- Table 7: Global Triazine Market Revenue Million Forecast, by Region 2019 & 2032
- Table 8: Global Triazine Market Volume K Tons Forecast, by Region 2019 & 2032
- Table 9: Global Triazine Market Revenue Million Forecast, by Country 2019 & 2032
- Table 10: Global Triazine Market Volume K Tons Forecast, by Country 2019 & 2032
- Table 11: United States Triazine Market Revenue (Million) Forecast, by Application 2019 & 2032
- Table 12: United States Triazine Market Volume (K Tons) Forecast, by Application 2019 & 2032
- Table 13: Canada Triazine Market Revenue (Million) Forecast, by Application 2019 & 2032
- Table 14: Canada Triazine Market Volume (K Tons) Forecast, by Application 2019 & 2032
- Table 15: Mexico Triazine Market Revenue (Million) Forecast, by Application 2019 & 2032
- Table 16: Mexico Triazine Market Volume (K Tons) Forecast, by Application 2019 & 2032
- Table 17: Global Triazine Market Revenue Million Forecast, by Country 2019 & 2032
- Table 18: Global Triazine Market Volume K Tons Forecast, by Country 2019 & 2032
- Table 19: Germany Triazine Market Revenue (Million) Forecast, by Application 2019 & 2032
- Table 20: Germany Triazine Market Volume (K Tons) Forecast, by Application 2019 & 2032
- Table 21: United Kingdom Triazine Market Revenue (Million) Forecast, by Application 2019 & 2032
- Table 22: United Kingdom Triazine Market Volume (K Tons) Forecast, by Application 2019 & 2032
- Table 23: France Triazine Market Revenue (Million) Forecast, by Application 2019 & 2032
- Table 24: France Triazine Market Volume (K Tons) Forecast, by Application 2019 & 2032
- Table 25: Spain Triazine Market Revenue (Million) Forecast, by Application 2019 & 2032
- Table 26: Spain Triazine Market Volume (K Tons) Forecast, by Application 2019 & 2032
- Table 27: Italy Triazine Market Revenue (Million) Forecast, by Application 2019 & 2032
- Table 28: Italy Triazine Market Volume (K Tons) Forecast, by Application 2019 & 2032
- Table 29: Spain Triazine Market Revenue (Million) Forecast, by Application 2019 & 2032
- Table 30: Spain Triazine Market Volume (K Tons) Forecast, by Application 2019 & 2032
- Table 31: Belgium Triazine Market Revenue (Million) Forecast, by Application 2019 & 2032
- Table 32: Belgium Triazine Market Volume (K Tons) Forecast, by Application 2019 & 2032
- Table 33: Netherland Triazine Market Revenue (Million) Forecast, by Application 2019 & 2032
- Table 34: Netherland Triazine Market Volume (K Tons) Forecast, by Application 2019 & 2032
- Table 35: Nordics Triazine Market Revenue (Million) Forecast, by Application 2019 & 2032
- Table 36: Nordics Triazine Market Volume (K Tons) Forecast, by Application 2019 & 2032
- Table 37: Rest of Europe Triazine Market Revenue (Million) Forecast, by Application 2019 & 2032
- Table 38: Rest of Europe Triazine Market Volume (K Tons) Forecast, by Application 2019 & 2032
- Table 39: Global Triazine Market Revenue Million Forecast, by Country 2019 & 2032
- Table 40: Global Triazine Market Volume K Tons Forecast, by Country 2019 & 2032
- Table 41: China Triazine Market Revenue (Million) Forecast, by Application 2019 & 2032
- Table 42: China Triazine Market Volume (K Tons) Forecast, by Application 2019 & 2032
- Table 43: Japan Triazine Market Revenue (Million) Forecast, by Application 2019 & 2032
- Table 44: Japan Triazine Market Volume (K Tons) Forecast, by Application 2019 & 2032
- Table 45: India Triazine Market Revenue (Million) Forecast, by Application 2019 & 2032
- Table 46: India Triazine Market Volume (K Tons) Forecast, by Application 2019 & 2032
- Table 47: South Korea Triazine Market Revenue (Million) Forecast, by Application 2019 & 2032
- Table 48: South Korea Triazine Market Volume (K Tons) Forecast, by Application 2019 & 2032
- Table 49: Southeast Asia Triazine Market Revenue (Million) Forecast, by Application 2019 & 2032
- Table 50: Southeast Asia Triazine Market Volume (K Tons) Forecast, by Application 2019 & 2032
- Table 51: Australia Triazine Market Revenue (Million) Forecast, by Application 2019 & 2032
- Table 52: Australia Triazine Market Volume (K Tons) Forecast, by Application 2019 & 2032
- Table 53: Indonesia Triazine Market Revenue (Million) Forecast, by Application 2019 & 2032
- Table 54: Indonesia Triazine Market Volume (K Tons) Forecast, by Application 2019 & 2032
- Table 55: Phillipes Triazine Market Revenue (Million) Forecast, by Application 2019 & 2032
- Table 56: Phillipes Triazine Market Volume (K Tons) Forecast, by Application 2019 & 2032
- Table 57: Singapore Triazine Market Revenue (Million) Forecast, by Application 2019 & 2032
- Table 58: Singapore Triazine Market Volume (K Tons) Forecast, by Application 2019 & 2032
- Table 59: Thailandc Triazine Market Revenue (Million) Forecast, by Application 2019 & 2032
- Table 60: Thailandc Triazine Market Volume (K Tons) Forecast, by Application 2019 & 2032
- Table 61: Rest of Asia Pacific Triazine Market Revenue (Million) Forecast, by Application 2019 & 2032
- Table 62: Rest of Asia Pacific Triazine Market Volume (K Tons) Forecast, by Application 2019 & 2032
- Table 63: Global Triazine Market Revenue Million Forecast, by Country 2019 & 2032
- Table 64: Global Triazine Market Volume K Tons Forecast, by Country 2019 & 2032
- Table 65: Brazil Triazine Market Revenue (Million) Forecast, by Application 2019 & 2032
- Table 66: Brazil Triazine Market Volume (K Tons) Forecast, by Application 2019 & 2032
- Table 67: Argentina Triazine Market Revenue (Million) Forecast, by Application 2019 & 2032
- Table 68: Argentina Triazine Market Volume (K Tons) Forecast, by Application 2019 & 2032
- Table 69: Peru Triazine Market Revenue (Million) Forecast, by Application 2019 & 2032
- Table 70: Peru Triazine Market Volume (K Tons) Forecast, by Application 2019 & 2032
- Table 71: Chile Triazine Market Revenue (Million) Forecast, by Application 2019 & 2032
- Table 72: Chile Triazine Market Volume (K Tons) Forecast, by Application 2019 & 2032
- Table 73: Colombia Triazine Market Revenue (Million) Forecast, by Application 2019 & 2032
- Table 74: Colombia Triazine Market Volume (K Tons) Forecast, by Application 2019 & 2032
- Table 75: Ecuador Triazine Market Revenue (Million) Forecast, by Application 2019 & 2032
- Table 76: Ecuador Triazine Market Volume (K Tons) Forecast, by Application 2019 & 2032
- Table 77: Venezuela Triazine Market Revenue (Million) Forecast, by Application 2019 & 2032
- Table 78: Venezuela Triazine Market Volume (K Tons) Forecast, by Application 2019 & 2032
- Table 79: Rest of South America Triazine Market Revenue (Million) Forecast, by Application 2019 & 2032
- Table 80: Rest of South America Triazine Market Volume (K Tons) Forecast, by Application 2019 & 2032
- Table 81: Global Triazine Market Revenue Million Forecast, by Country 2019 & 2032
- Table 82: Global Triazine Market Volume K Tons Forecast, by Country 2019 & 2032
- Table 83: United States Triazine Market Revenue (Million) Forecast, by Application 2019 & 2032
- Table 84: United States Triazine Market Volume (K Tons) Forecast, by Application 2019 & 2032
- Table 85: Canada Triazine Market Revenue (Million) Forecast, by Application 2019 & 2032
- Table 86: Canada Triazine Market Volume (K Tons) Forecast, by Application 2019 & 2032
- Table 87: Mexico Triazine Market Revenue (Million) Forecast, by Application 2019 & 2032
- Table 88: Mexico Triazine Market Volume (K Tons) Forecast, by Application 2019 & 2032
- Table 89: Global Triazine Market Revenue Million Forecast, by Country 2019 & 2032
- Table 90: Global Triazine Market Volume K Tons Forecast, by Country 2019 & 2032
- Table 91: United Arab Emirates Triazine Market Revenue (Million) Forecast, by Application 2019 & 2032
- Table 92: United Arab Emirates Triazine Market Volume (K Tons) Forecast, by Application 2019 & 2032
- Table 93: Saudi Arabia Triazine Market Revenue (Million) Forecast, by Application 2019 & 2032
- Table 94: Saudi Arabia Triazine Market Volume (K Tons) Forecast, by Application 2019 & 2032
- Table 95: South Africa Triazine Market Revenue (Million) Forecast, by Application 2019 & 2032
- Table 96: South Africa Triazine Market Volume (K Tons) Forecast, by Application 2019 & 2032
- Table 97: Rest of Middle East and Africa Triazine Market Revenue (Million) Forecast, by Application 2019 & 2032
- Table 98: Rest of Middle East and Africa Triazine Market Volume (K Tons) Forecast, by Application 2019 & 2032
- Table 99: Global Triazine Market Revenue Million Forecast, by Derivative 2019 & 2032
- Table 100: Global Triazine Market Volume K Tons Forecast, by Derivative 2019 & 2032
- Table 101: Global Triazine Market Revenue Million Forecast, by Application 2019 & 2032
- Table 102: Global Triazine Market Volume K Tons Forecast, by Application 2019 & 2032
- Table 103: Global Triazine Market Revenue Million Forecast, by Country 2019 & 2032
- Table 104: Global Triazine Market Volume K Tons Forecast, by Country 2019 & 2032
- Table 105: China Triazine Market Revenue (Million) Forecast, by Application 2019 & 2032
- Table 106: China Triazine Market Volume (K Tons) Forecast, by Application 2019 & 2032
- Table 107: India Triazine Market Revenue (Million) Forecast, by Application 2019 & 2032
- Table 108: India Triazine Market Volume (K Tons) Forecast, by Application 2019 & 2032
- Table 109: Japan Triazine Market Revenue (Million) Forecast, by Application 2019 & 2032
- Table 110: Japan Triazine Market Volume (K Tons) Forecast, by Application 2019 & 2032
- Table 111: South Korea Triazine Market Revenue (Million) Forecast, by Application 2019 & 2032
- Table 112: South Korea Triazine Market Volume (K Tons) Forecast, by Application 2019 & 2032
- Table 113: Southeast Asia Triazine Market Revenue (Million) Forecast, by Application 2019 & 2032
- Table 114: Southeast Asia Triazine Market Volume (K Tons) Forecast, by Application 2019 & 2032
- Table 115: Australia Triazine Market Revenue (Million) Forecast, by Application 2019 & 2032
- Table 116: Australia Triazine Market Volume (K Tons) Forecast, by Application 2019 & 2032
- Table 117: Rest of Asia Pacific Triazine Market Revenue (Million) Forecast, by Application 2019 & 2032
- Table 118: Rest of Asia Pacific Triazine Market Volume (K Tons) Forecast, by Application 2019 & 2032
- Table 119: Global Triazine Market Revenue Million Forecast, by Derivative 2019 & 2032
- Table 120: Global Triazine Market Volume K Tons Forecast, by Derivative 2019 & 2032
- Table 121: Global Triazine Market Revenue Million Forecast, by Application 2019 & 2032
- Table 122: Global Triazine Market Volume K Tons Forecast, by Application 2019 & 2032
- Table 123: Global Triazine Market Revenue Million Forecast, by Country 2019 & 2032
- Table 124: Global Triazine Market Volume K Tons Forecast, by Country 2019 & 2032
- Table 125: United States Triazine Market Revenue (Million) Forecast, by Application 2019 & 2032
- Table 126: United States Triazine Market Volume (K Tons) Forecast, by Application 2019 & 2032
- Table 127: Canada Triazine Market Revenue (Million) Forecast, by Application 2019 & 2032
- Table 128: Canada Triazine Market Volume (K Tons) Forecast, by Application 2019 & 2032
- Table 129: Mexico Triazine Market Revenue (Million) Forecast, by Application 2019 & 2032
- Table 130: Mexico Triazine Market Volume (K Tons) Forecast, by Application 2019 & 2032
- Table 131: Global Triazine Market Revenue Million Forecast, by Derivative 2019 & 2032
- Table 132: Global Triazine Market Volume K Tons Forecast, by Derivative 2019 & 2032
- Table 133: Global Triazine Market Revenue Million Forecast, by Application 2019 & 2032
- Table 134: Global Triazine Market Volume K Tons Forecast, by Application 2019 & 2032
- Table 135: Global Triazine Market Revenue Million Forecast, by Country 2019 & 2032
- Table 136: Global Triazine Market Volume K Tons Forecast, by Country 2019 & 2032
- Table 137: Germany Triazine Market Revenue (Million) Forecast, by Application 2019 & 2032
- Table 138: Germany Triazine Market Volume (K Tons) Forecast, by Application 2019 & 2032
- Table 139: United Kingdom Triazine Market Revenue (Million) Forecast, by Application 2019 & 2032
- Table 140: United Kingdom Triazine Market Volume (K Tons) Forecast, by Application 2019 & 2032
- Table 141: France Triazine Market Revenue (Million) Forecast, by Application 2019 & 2032
- Table 142: France Triazine Market Volume (K Tons) Forecast, by Application 2019 & 2032
- Table 143: Italy Triazine Market Revenue (Million) Forecast, by Application 2019 & 2032
- Table 144: Italy Triazine Market Volume (K Tons) Forecast, by Application 2019 & 2032
- Table 145: Spain Triazine Market Revenue (Million) Forecast, by Application 2019 & 2032
- Table 146: Spain Triazine Market Volume (K Tons) Forecast, by Application 2019 & 2032
- Table 147: Rest of Europe Triazine Market Revenue (Million) Forecast, by Application 2019 & 2032
- Table 148: Rest of Europe Triazine Market Volume (K Tons) Forecast, by Application 2019 & 2032
- Table 149: Global Triazine Market Revenue Million Forecast, by Derivative 2019 & 2032
- Table 150: Global Triazine Market Volume K Tons Forecast, by Derivative 2019 & 2032
- Table 151: Global Triazine Market Revenue Million Forecast, by Application 2019 & 2032
- Table 152: Global Triazine Market Volume K Tons Forecast, by Application 2019 & 2032
- Table 153: Global Triazine Market Revenue Million Forecast, by Country 2019 & 2032
- Table 154: Global Triazine Market Volume K Tons Forecast, by Country 2019 & 2032
- Table 155: Brazil Triazine Market Revenue (Million) Forecast, by Application 2019 & 2032
- Table 156: Brazil Triazine Market Volume (K Tons) Forecast, by Application 2019 & 2032
- Table 157: Argentina Triazine Market Revenue (Million) Forecast, by Application 2019 & 2032
- Table 158: Argentina Triazine Market Volume (K Tons) Forecast, by Application 2019 & 2032
- Table 159: Rest of South America Triazine Market Revenue (Million) Forecast, by Application 2019 & 2032
- Table 160: Rest of South America Triazine Market Volume (K Tons) Forecast, by Application 2019 & 2032
- Table 161: Global Triazine Market Revenue Million Forecast, by Derivative 2019 & 2032
- Table 162: Global Triazine Market Volume K Tons Forecast, by Derivative 2019 & 2032
- Table 163: Global Triazine Market Revenue Million Forecast, by Application 2019 & 2032
- Table 164: Global Triazine Market Volume K Tons Forecast, by Application 2019 & 2032
- Table 165: Global Triazine Market Revenue Million Forecast, by Country 2019 & 2032
- Table 166: Global Triazine Market Volume K Tons Forecast, by Country 2019 & 2032
- Table 167: UAE Triazine Market Revenue (Million) Forecast, by Application 2019 & 2032
- Table 168: UAE Triazine Market Volume (K Tons) Forecast, by Application 2019 & 2032
- Table 169: Saudi Arabia Triazine Market Revenue (Million) Forecast, by Application 2019 & 2032
- Table 170: Saudi Arabia Triazine Market Volume (K Tons) Forecast, by Application 2019 & 2032
- Table 171: Nigeria Triazine Market Revenue (Million) Forecast, by Application 2019 & 2032
- Table 172: Nigeria Triazine Market Volume (K Tons) Forecast, by Application 2019 & 2032
- Table 173: South Africa Triazine Market Revenue (Million) Forecast, by Application 2019 & 2032
- Table 174: South Africa Triazine Market Volume (K Tons) Forecast, by Application 2019 & 2032
- Table 175: REst of Middle East & Africa Triazine Market Revenue (Million) Forecast, by Application 2019 & 2032
- Table 176: REst of Middle East & Africa Triazine Market Volume (K Tons) Forecast, by Application 2019 & 2032
Frequently Asked Questions
1. What is the projected Compound Annual Growth Rate (CAGR) of the Triazine Market?
The projected CAGR is approximately > 4.00%.
2. Which companies are prominent players in the Triazine Market?
Key companies in the market include Evonik Industries AG, Baker Hughes, Sintez OKA, Ashland, BASF SE, Eastman Chemical Company, Hexion, Halliburton, Lonza, Haihang Industry Co Ltd.
3. What are the main segments of the Triazine Market?
The market segments include Derivative, Application.
4. Can you provide details about the market size?
The market size is estimated to be USD XX Million as of 2022.
5. What are some drivers contributing to market growth?
; Growing Demand from Construction Sector; Rising Demand for Fuel Efficient and Light-weight Vehicles.
6. What are the notable trends driving market growth?
Melamine to Dominate the Market.
7. Are there any restraints impacting market growth?
; Increasing Consumer Concerns about Formaldehyde Emission from Melamine-based Molding Compounds; Other Restraints.
8. Can you provide examples of recent developments in the market?
N/A
9. What pricing options are available for accessing the report?
Pricing options include single-user, multi-user, and enterprise licenses priced at USD 4750, USD 5250, and USD 8750 respectively.
10. Is the market size provided in terms of value or volume?
The market size is provided in terms of value, measured in Million and volume, measured in K Tons.
11. Are there any specific market keywords associated with the report?
Yes, the market keyword associated with the report is "Triazine Market," which aids in identifying and referencing the specific market segment covered.
12. How do I determine which pricing option suits my needs best?
The pricing options vary based on user requirements and access needs. Individual users may opt for single-user licenses, while businesses requiring broader access may choose multi-user or enterprise licenses for cost-effective access to the report.
13. Are there any additional resources or data provided in the Triazine Market report?
While the report offers comprehensive insights, it's advisable to review the specific contents or supplementary materials provided to ascertain if additional resources or data are available.
14. How can I stay updated on further developments or reports in the Triazine Market?
To stay informed about further developments, trends, and reports in the Triazine Market, consider subscribing to industry newsletters, following relevant companies and organizations, or regularly checking reputable industry news sources and publications.
Methodology
Step 1 - Identification of Relevant Samples Size from Population Database


Step 2 - Approaches for Defining Global Market Size (Value, Volume* & Price*)

Note*: In applicable scenarios
Step 3 - Data Sources
Primary Research
- Web Analytics
- Survey Reports
- Research Institute
- Latest Research Reports
- Opinion Leaders
Secondary Research
- Annual Reports
- White Paper
- Latest Press Release
- Industry Association
- Paid Database
- Investor Presentations

Step 4 - Data Triangulation
Involves using different sources of information in order to increase the validity of a study
These sources are likely to be stakeholders in a program - participants, other researchers, program staff, other community members, and so on.
Then we put all data in single framework & apply various statistical tools to find out the dynamic on the market.
During the analysis stage, feedback from the stakeholder groups would be compared to determine areas of agreement as well as areas of divergence
