

Key Insights
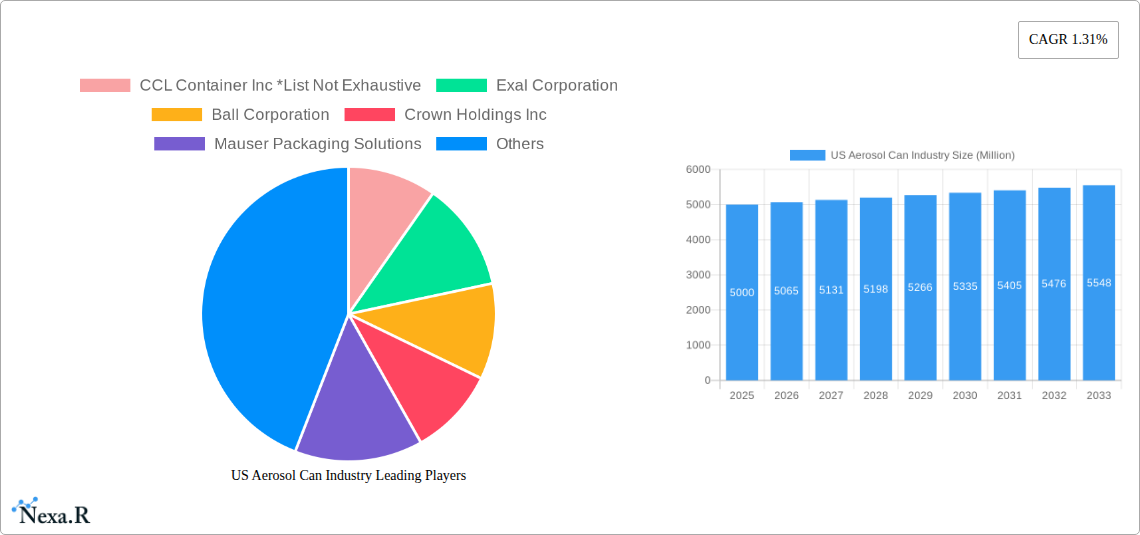
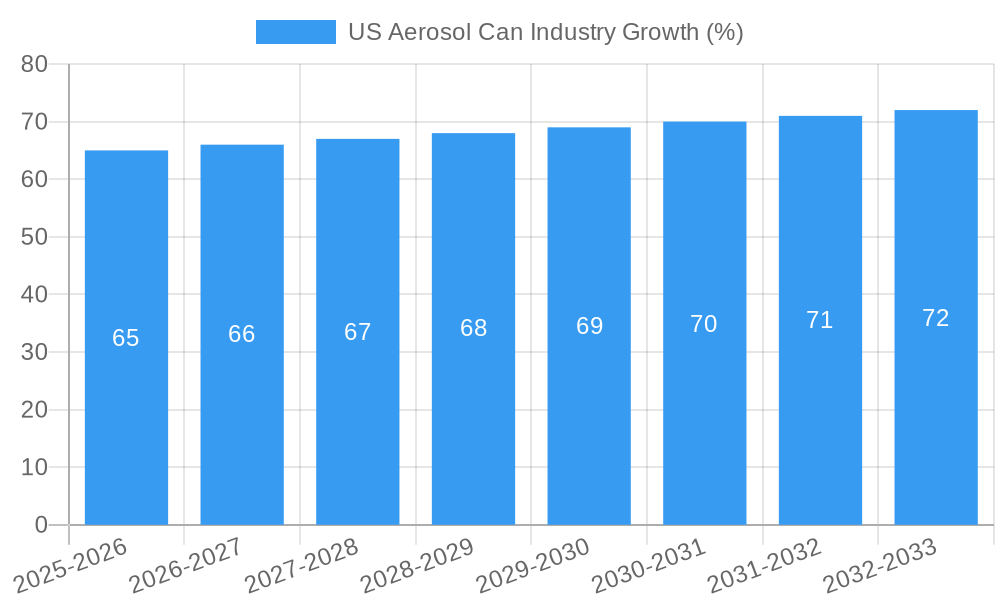
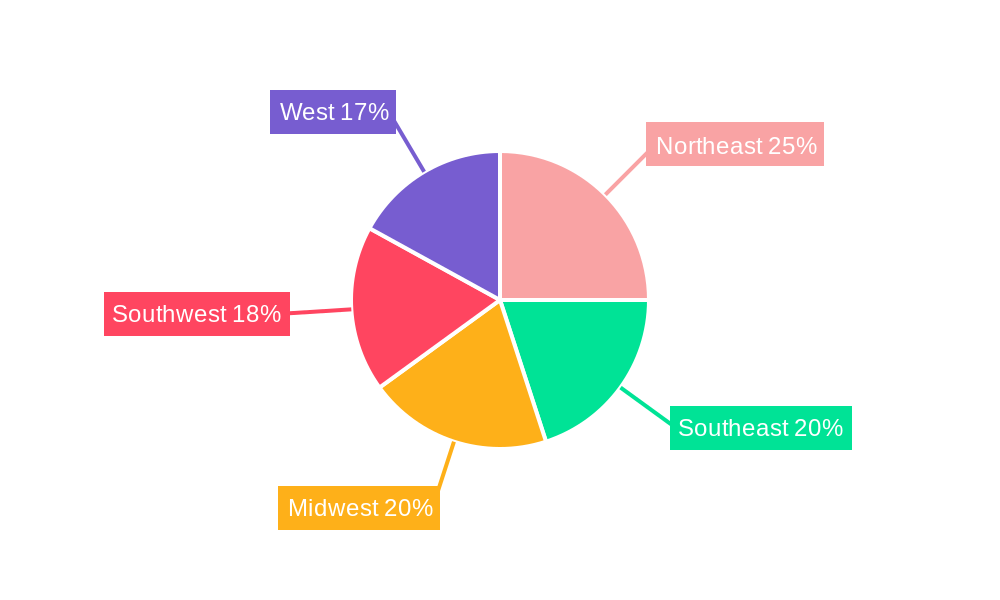
The US aerosol can market, valued at approximately $5 billion in 2025, is projected to experience steady growth, driven by the increasing demand for convenience packaging across various sectors. A Compound Annual Growth Rate (CAGR) of 1.31% from 2025 to 2033 indicates a gradual but consistent expansion. Key drivers include the rising popularity of aerosol-based products in personal care (hairsprays, deodorants), household cleaning, and automotive applications. The continued innovation in can materials, particularly lightweight aluminum and steel-tinplate alternatives, is also contributing to market growth. While the pharmaceutical and veterinary sectors represent a smaller segment, they still contribute to overall demand. The market faces some restraints, including environmental concerns regarding propellant gases and the growing focus on sustainable packaging solutions. However, ongoing research and development in eco-friendly propellants and recyclable can materials are mitigating these challenges. Segmentation by product type (aluminum, steel-tinplate, other materials) and end-user (cosmetic and personal care, household, pharmaceutical/veterinary, paints and varnishes, automotive/industrial) provides a granular view of market dynamics, allowing for targeted strategies. Major players like CCL Container Inc., Exal Corporation, Ball Corporation, Crown Holdings Inc., and Mauser Packaging Solutions are actively shaping market competition through product diversification and strategic acquisitions. Regional variations exist within the United States, with regions like the Northeast and West potentially exhibiting stronger growth due to higher population density and consumer spending.
The forecast period (2025-2033) presents opportunities for market expansion. Companies are focusing on improving can design, enhancing functionality, and offering customized solutions to meet the specific needs of various industries. This includes exploring sustainable options, such as biodegradable propellants and recycled materials, to align with growing environmental concerns. Growth in the automotive/industrial segment is anticipated due to increased use of aerosol-based coatings and lubricants. The competitive landscape remains dynamic, with mergers and acquisitions likely to reshape the market structure in the coming years. Continuous innovation and adapting to evolving consumer preferences will be crucial for success in this competitive market.
This comprehensive report provides a detailed analysis of the US aerosol can industry, covering market dynamics, growth trends, leading segments, and key players. With a focus on the period 2019-2033 (Base Year: 2025, Estimated Year: 2025, Forecast Period: 2025-2033), this in-depth study is essential for industry professionals, investors, and strategic decision-makers seeking a clear understanding of this dynamic market. The report analyzes parent markets (packaging) and child markets (aerosol can applications across various end-use sectors), offering granular insights into market size, competitive landscape, and future growth potential, all presented in Million units.
US Aerosol Can Industry Market Dynamics & Structure
This section analyzes the market's competitive structure, technological advancements, regulatory landscape, and end-user trends within the US aerosol can market. We examine the influence of mergers and acquisitions (M&A) activity, providing quantitative data on market share distribution and qualitative insights into innovation challenges.
- Market Concentration: The US aerosol can market exhibits a moderately concentrated structure, with a few major players holding significant market share. We project a xx% market share for the top 3 players in 2025.
- Technological Innovation: Key drivers include advancements in lightweighting, improved coatings for corrosion resistance, and sustainable material usage. Barriers include high R&D costs and stringent regulatory approvals.
- Regulatory Framework: Stringent environmental regulations, especially those concerning volatile organic compounds (VOCs) and propellants, significantly impact material choices and product design.
- Competitive Substitutes: Alternative packaging solutions like pouches and bottles pose a competitive threat, particularly in certain end-user segments.
- End-User Demographics: Growth is influenced by changing consumer preferences, particularly towards convenience and sustainability in various sectors like personal care and household products.
- M&A Trends: The past five years have witnessed xx M&A deals, primarily focused on expanding product portfolios and geographical reach. Consolidation is expected to continue, driven by economies of scale and technological integration.
US Aerosol Can Industry Growth Trends & Insights
This section presents a comprehensive analysis of market size evolution, adoption rates, and technological disruptions influencing the US aerosol can market. We utilize robust forecasting methodologies to project future market growth, outlining specific metrics and analyzing consumer behavior shifts driving market trends. The US Aerosol can market is projected to grow at a CAGR of xx% during the forecast period (2025-2033), reaching xx million units by 2033. This growth is attributed to factors such as [insert detailed reasons based on XXX analysis].
[Insert 600 words of detailed analysis based on XXX, covering market size evolution, adoption rates, technological disruptions, and consumer behavior shifts. Include specific metrics like CAGR and market penetration rates].
Dominant Regions, Countries, or Segments in US Aerosol Can Industry
This section identifies the leading regions, countries, or segments within the US aerosol can industry, highlighting key growth drivers and analyzing dominance factors.
Product Type:
- Aluminum: Aluminum remains the dominant material, driven by its lightweight nature, recyclability, and suitability for various applications. It holds a xx% market share in 2025.
- Steel-Tinplate: Steel-tinplate maintains a significant share, particularly in segments requiring high strength and barrier properties. Estimated share in 2025 is xx%.
- Other Materials: Materials such as plastic and composite cans are gaining traction due to specific applications demanding specific functionalities, however their total market share in 2025 remains relatively small at xx%.
End-User:
- Cosmetic and Personal Care: This is the largest end-user segment, driven by increasing demand for convenient and aesthetically pleasing packaging solutions. Market share in 2025: xx%.
- Household: This segment is characterized by steady growth fueled by established product categories like air fresheners and insecticides. Market share in 2025: xx%.
- Pharmaceutical/Veterinary: Growth in this segment is driven by specialized aerosol delivery systems for medications and veterinary products. Market share in 2025: xx%.
- Paints and Varnishes: This segment shows consistent demand for aerosol cans due to ease of application and convenience. Market share in 2025: xx%.
- Automotive/Industrial: The automotive and industrial sectors rely on specialized aerosol cans for applications requiring specific properties and performance metrics. Market share in 2025: xx%.
- Other End Users: This category comprises niche applications with moderate growth potential. Market share in 2025: xx%.
[Insert further detailed analysis (600 words) supporting the above points, including market share data and growth potential for each segment and region. Use paragraphs to analyze dominance factors and bullet points to highlight key drivers.]
US Aerosol Can Industry Product Landscape
The US aerosol can market features a range of products designed for diverse applications, showcasing technological advancements such as improved coatings for corrosion resistance and lightweighting for reduced material costs and enhanced sustainability. Unique selling propositions include customizability for various product formats and specialized dispensing mechanisms.
Key Drivers, Barriers & Challenges in US Aerosol Can Industry
Key Drivers:
- Increasing demand for convenient packaging across various industries.
- Technological advancements leading to improved product features and sustainability.
- Favorable regulatory environment promoting innovation in sustainable packaging.
Key Challenges:
- Fluctuations in raw material prices (e.g., aluminum, steel).
- Stringent environmental regulations impacting material choices and manufacturing processes.
- Intense competition from alternative packaging solutions.
Emerging Opportunities in US Aerosol Can Industry
Emerging opportunities include the growth of sustainable and eco-friendly aerosol cans, catering to the increasing consumer demand for environmentally responsible products. Expansion into niche markets with specialized applications and the development of innovative dispensing technologies represent significant growth prospects.
Growth Accelerators in the US Aerosol Can Industry
Technological breakthroughs in lightweighting and sustainable materials, strategic partnerships to enhance supply chain efficiency and access new markets, and expansion into new end-use segments such as personal care and industrial applications are key catalysts for accelerated growth.
Key Players Shaping the US Aerosol Can Industry Market
- CCL Container Inc
- Exal Corporation
- Ball Corporation
- Crown Holdings Inc
- Mauser Packaging Solutions
Notable Milestones in US Aerosol Can Industry Sector
- 2021: Introduction of a new line of recyclable aluminum aerosol cans by [Company Name].
- 2022: Merger between [Company A] and [Company B], leading to increased market share and expanded product portfolio.
- 2023: Launch of a biodegradable aerosol can by [Company Name]. [Add more milestones with year/month and impact]
In-Depth US Aerosol Can Industry Market Outlook
The US aerosol can market is poised for continued growth, driven by innovation in sustainable packaging, expanding end-user applications, and ongoing industry consolidation. Strategic partnerships and investments in R&D will be critical in leveraging future market potential and capitalizing on emerging opportunities.
US Aerosol Can Industry Segmentation
-
1. Product type
- 1.1. Aluminum
- 1.2. Steel-Tinplate
- 1.3. Other Materials
-
2. End-User
- 2.1. Cosmetic and Personal Care
- 2.2. Household
- 2.3. Pharmaceutical/Veterinary
- 2.4. Paints and Varnishes
- 2.5. Automotive/Industrial
- 2.6. Other End Users
US Aerosol Can Industry Segmentation By Geography
-
1. North America
- 1.1. United States
- 1.2. Canada
- 1.3. Mexico
-
2. South America
- 2.1. Brazil
- 2.2. Argentina
- 2.3. Rest of South America
-
3. Europe
- 3.1. United Kingdom
- 3.2. Germany
- 3.3. France
- 3.4. Italy
- 3.5. Spain
- 3.6. Russia
- 3.7. Benelux
- 3.8. Nordics
- 3.9. Rest of Europe
-
4. Middle East & Africa
- 4.1. Turkey
- 4.2. Israel
- 4.3. GCC
- 4.4. North Africa
- 4.5. South Africa
- 4.6. Rest of Middle East & Africa
-
5. Asia Pacific
- 5.1. China
- 5.2. India
- 5.3. Japan
- 5.4. South Korea
- 5.5. ASEAN
- 5.6. Oceania
- 5.7. Rest of Asia Pacific
US Aerosol Can Industry REPORT HIGHLIGHTS
| Aspects | Details |
|---|---|
| Study Period | 2019-2033 |
| Base Year | 2024 |
| Estimated Year | 2025 |
| Forecast Period | 2025-2033 |
| Historical Period | 2019-2024 |
| Growth Rate | CAGR of 1.31% from 2019-2033 |
| Segmentation |
|
Table of Contents
- 1. Introduction
- 1.1. Research Scope
- 1.2. Market Segmentation
- 1.3. Research Methodology
- 1.4. Definitions and Assumptions
- 2. Executive Summary
- 2.1. Introduction
- 3. Market Dynamics
- 3.1. Introduction
- 3.2. Market Drivers
- 3.2.1. ; Growing Demand from the Cosmetic Industry
- 3.3. Market Restrains
- 3.3.1. ; Increasing Competition from Substitute Packaging
- 3.4. Market Trends
- 3.4.1. Aluminum Cans to Register Highest Growth
- 4. Market Factor Analysis
- 4.1. Porters Five Forces
- 4.2. Supply/Value Chain
- 4.3. PESTEL analysis
- 4.4. Market Entropy
- 4.5. Patent/Trademark Analysis
- 5. Global US Aerosol Can Industry Analysis, Insights and Forecast, 2019-2031
- 5.1. Market Analysis, Insights and Forecast - by Product type
- 5.1.1. Aluminum
- 5.1.2. Steel-Tinplate
- 5.1.3. Other Materials
- 5.2. Market Analysis, Insights and Forecast - by End-User
- 5.2.1. Cosmetic and Personal Care
- 5.2.2. Household
- 5.2.3. Pharmaceutical/Veterinary
- 5.2.4. Paints and Varnishes
- 5.2.5. Automotive/Industrial
- 5.2.6. Other End Users
- 5.3. Market Analysis, Insights and Forecast - by Region
- 5.3.1. North America
- 5.3.2. South America
- 5.3.3. Europe
- 5.3.4. Middle East & Africa
- 5.3.5. Asia Pacific
- 5.1. Market Analysis, Insights and Forecast - by Product type
- 6. North America US Aerosol Can Industry Analysis, Insights and Forecast, 2019-2031
- 6.1. Market Analysis, Insights and Forecast - by Product type
- 6.1.1. Aluminum
- 6.1.2. Steel-Tinplate
- 6.1.3. Other Materials
- 6.2. Market Analysis, Insights and Forecast - by End-User
- 6.2.1. Cosmetic and Personal Care
- 6.2.2. Household
- 6.2.3. Pharmaceutical/Veterinary
- 6.2.4. Paints and Varnishes
- 6.2.5. Automotive/Industrial
- 6.2.6. Other End Users
- 6.1. Market Analysis, Insights and Forecast - by Product type
- 7. South America US Aerosol Can Industry Analysis, Insights and Forecast, 2019-2031
- 7.1. Market Analysis, Insights and Forecast - by Product type
- 7.1.1. Aluminum
- 7.1.2. Steel-Tinplate
- 7.1.3. Other Materials
- 7.2. Market Analysis, Insights and Forecast - by End-User
- 7.2.1. Cosmetic and Personal Care
- 7.2.2. Household
- 7.2.3. Pharmaceutical/Veterinary
- 7.2.4. Paints and Varnishes
- 7.2.5. Automotive/Industrial
- 7.2.6. Other End Users
- 7.1. Market Analysis, Insights and Forecast - by Product type
- 8. Europe US Aerosol Can Industry Analysis, Insights and Forecast, 2019-2031
- 8.1. Market Analysis, Insights and Forecast - by Product type
- 8.1.1. Aluminum
- 8.1.2. Steel-Tinplate
- 8.1.3. Other Materials
- 8.2. Market Analysis, Insights and Forecast - by End-User
- 8.2.1. Cosmetic and Personal Care
- 8.2.2. Household
- 8.2.3. Pharmaceutical/Veterinary
- 8.2.4. Paints and Varnishes
- 8.2.5. Automotive/Industrial
- 8.2.6. Other End Users
- 8.1. Market Analysis, Insights and Forecast - by Product type
- 9. Middle East & Africa US Aerosol Can Industry Analysis, Insights and Forecast, 2019-2031
- 9.1. Market Analysis, Insights and Forecast - by Product type
- 9.1.1. Aluminum
- 9.1.2. Steel-Tinplate
- 9.1.3. Other Materials
- 9.2. Market Analysis, Insights and Forecast - by End-User
- 9.2.1. Cosmetic and Personal Care
- 9.2.2. Household
- 9.2.3. Pharmaceutical/Veterinary
- 9.2.4. Paints and Varnishes
- 9.2.5. Automotive/Industrial
- 9.2.6. Other End Users
- 9.1. Market Analysis, Insights and Forecast - by Product type
- 10. Asia Pacific US Aerosol Can Industry Analysis, Insights and Forecast, 2019-2031
- 10.1. Market Analysis, Insights and Forecast - by Product type
- 10.1.1. Aluminum
- 10.1.2. Steel-Tinplate
- 10.1.3. Other Materials
- 10.2. Market Analysis, Insights and Forecast - by End-User
- 10.2.1. Cosmetic and Personal Care
- 10.2.2. Household
- 10.2.3. Pharmaceutical/Veterinary
- 10.2.4. Paints and Varnishes
- 10.2.5. Automotive/Industrial
- 10.2.6. Other End Users
- 10.1. Market Analysis, Insights and Forecast - by Product type
- 11. Northeast US Aerosol Can Industry Analysis, Insights and Forecast, 2019-2031
- 12. Southeast US Aerosol Can Industry Analysis, Insights and Forecast, 2019-2031
- 13. Midwest US Aerosol Can Industry Analysis, Insights and Forecast, 2019-2031
- 14. Southwest US Aerosol Can Industry Analysis, Insights and Forecast, 2019-2031
- 15. West US Aerosol Can Industry Analysis, Insights and Forecast, 2019-2031
- 16. Competitive Analysis
- 16.1. Global Market Share Analysis 2024
- 16.2. Company Profiles
- 16.2.1 CCL Container Inc *List Not Exhaustive
- 16.2.1.1. Overview
- 16.2.1.2. Products
- 16.2.1.3. SWOT Analysis
- 16.2.1.4. Recent Developments
- 16.2.1.5. Financials (Based on Availability)
- 16.2.2 Exal Corporation
- 16.2.2.1. Overview
- 16.2.2.2. Products
- 16.2.2.3. SWOT Analysis
- 16.2.2.4. Recent Developments
- 16.2.2.5. Financials (Based on Availability)
- 16.2.3 Ball Corporation
- 16.2.3.1. Overview
- 16.2.3.2. Products
- 16.2.3.3. SWOT Analysis
- 16.2.3.4. Recent Developments
- 16.2.3.5. Financials (Based on Availability)
- 16.2.4 Crown Holdings Inc
- 16.2.4.1. Overview
- 16.2.4.2. Products
- 16.2.4.3. SWOT Analysis
- 16.2.4.4. Recent Developments
- 16.2.4.5. Financials (Based on Availability)
- 16.2.5 Mauser Packaging Solutions
- 16.2.5.1. Overview
- 16.2.5.2. Products
- 16.2.5.3. SWOT Analysis
- 16.2.5.4. Recent Developments
- 16.2.5.5. Financials (Based on Availability)
- 16.2.1 CCL Container Inc *List Not Exhaustive
List of Figures
- Figure 1: Global US Aerosol Can Industry Revenue Breakdown (Million, %) by Region 2024 & 2032
- Figure 2: United states US Aerosol Can Industry Revenue (Million), by Country 2024 & 2032
- Figure 3: United states US Aerosol Can Industry Revenue Share (%), by Country 2024 & 2032
- Figure 4: North America US Aerosol Can Industry Revenue (Million), by Product type 2024 & 2032
- Figure 5: North America US Aerosol Can Industry Revenue Share (%), by Product type 2024 & 2032
- Figure 6: North America US Aerosol Can Industry Revenue (Million), by End-User 2024 & 2032
- Figure 7: North America US Aerosol Can Industry Revenue Share (%), by End-User 2024 & 2032
- Figure 8: North America US Aerosol Can Industry Revenue (Million), by Country 2024 & 2032
- Figure 9: North America US Aerosol Can Industry Revenue Share (%), by Country 2024 & 2032
- Figure 10: South America US Aerosol Can Industry Revenue (Million), by Product type 2024 & 2032
- Figure 11: South America US Aerosol Can Industry Revenue Share (%), by Product type 2024 & 2032
- Figure 12: South America US Aerosol Can Industry Revenue (Million), by End-User 2024 & 2032
- Figure 13: South America US Aerosol Can Industry Revenue Share (%), by End-User 2024 & 2032
- Figure 14: South America US Aerosol Can Industry Revenue (Million), by Country 2024 & 2032
- Figure 15: South America US Aerosol Can Industry Revenue Share (%), by Country 2024 & 2032
- Figure 16: Europe US Aerosol Can Industry Revenue (Million), by Product type 2024 & 2032
- Figure 17: Europe US Aerosol Can Industry Revenue Share (%), by Product type 2024 & 2032
- Figure 18: Europe US Aerosol Can Industry Revenue (Million), by End-User 2024 & 2032
- Figure 19: Europe US Aerosol Can Industry Revenue Share (%), by End-User 2024 & 2032
- Figure 20: Europe US Aerosol Can Industry Revenue (Million), by Country 2024 & 2032
- Figure 21: Europe US Aerosol Can Industry Revenue Share (%), by Country 2024 & 2032
- Figure 22: Middle East & Africa US Aerosol Can Industry Revenue (Million), by Product type 2024 & 2032
- Figure 23: Middle East & Africa US Aerosol Can Industry Revenue Share (%), by Product type 2024 & 2032
- Figure 24: Middle East & Africa US Aerosol Can Industry Revenue (Million), by End-User 2024 & 2032
- Figure 25: Middle East & Africa US Aerosol Can Industry Revenue Share (%), by End-User 2024 & 2032
- Figure 26: Middle East & Africa US Aerosol Can Industry Revenue (Million), by Country 2024 & 2032
- Figure 27: Middle East & Africa US Aerosol Can Industry Revenue Share (%), by Country 2024 & 2032
- Figure 28: Asia Pacific US Aerosol Can Industry Revenue (Million), by Product type 2024 & 2032
- Figure 29: Asia Pacific US Aerosol Can Industry Revenue Share (%), by Product type 2024 & 2032
- Figure 30: Asia Pacific US Aerosol Can Industry Revenue (Million), by End-User 2024 & 2032
- Figure 31: Asia Pacific US Aerosol Can Industry Revenue Share (%), by End-User 2024 & 2032
- Figure 32: Asia Pacific US Aerosol Can Industry Revenue (Million), by Country 2024 & 2032
- Figure 33: Asia Pacific US Aerosol Can Industry Revenue Share (%), by Country 2024 & 2032
List of Tables
- Table 1: Global US Aerosol Can Industry Revenue Million Forecast, by Region 2019 & 2032
- Table 2: Global US Aerosol Can Industry Revenue Million Forecast, by Product type 2019 & 2032
- Table 3: Global US Aerosol Can Industry Revenue Million Forecast, by End-User 2019 & 2032
- Table 4: Global US Aerosol Can Industry Revenue Million Forecast, by Region 2019 & 2032
- Table 5: Global US Aerosol Can Industry Revenue Million Forecast, by Country 2019 & 2032
- Table 6: Northeast US Aerosol Can Industry Revenue (Million) Forecast, by Application 2019 & 2032
- Table 7: Southeast US Aerosol Can Industry Revenue (Million) Forecast, by Application 2019 & 2032
- Table 8: Midwest US Aerosol Can Industry Revenue (Million) Forecast, by Application 2019 & 2032
- Table 9: Southwest US Aerosol Can Industry Revenue (Million) Forecast, by Application 2019 & 2032
- Table 10: West US Aerosol Can Industry Revenue (Million) Forecast, by Application 2019 & 2032
- Table 11: Global US Aerosol Can Industry Revenue Million Forecast, by Product type 2019 & 2032
- Table 12: Global US Aerosol Can Industry Revenue Million Forecast, by End-User 2019 & 2032
- Table 13: Global US Aerosol Can Industry Revenue Million Forecast, by Country 2019 & 2032
- Table 14: United States US Aerosol Can Industry Revenue (Million) Forecast, by Application 2019 & 2032
- Table 15: Canada US Aerosol Can Industry Revenue (Million) Forecast, by Application 2019 & 2032
- Table 16: Mexico US Aerosol Can Industry Revenue (Million) Forecast, by Application 2019 & 2032
- Table 17: Global US Aerosol Can Industry Revenue Million Forecast, by Product type 2019 & 2032
- Table 18: Global US Aerosol Can Industry Revenue Million Forecast, by End-User 2019 & 2032
- Table 19: Global US Aerosol Can Industry Revenue Million Forecast, by Country 2019 & 2032
- Table 20: Brazil US Aerosol Can Industry Revenue (Million) Forecast, by Application 2019 & 2032
- Table 21: Argentina US Aerosol Can Industry Revenue (Million) Forecast, by Application 2019 & 2032
- Table 22: Rest of South America US Aerosol Can Industry Revenue (Million) Forecast, by Application 2019 & 2032
- Table 23: Global US Aerosol Can Industry Revenue Million Forecast, by Product type 2019 & 2032
- Table 24: Global US Aerosol Can Industry Revenue Million Forecast, by End-User 2019 & 2032
- Table 25: Global US Aerosol Can Industry Revenue Million Forecast, by Country 2019 & 2032
- Table 26: United Kingdom US Aerosol Can Industry Revenue (Million) Forecast, by Application 2019 & 2032
- Table 27: Germany US Aerosol Can Industry Revenue (Million) Forecast, by Application 2019 & 2032
- Table 28: France US Aerosol Can Industry Revenue (Million) Forecast, by Application 2019 & 2032
- Table 29: Italy US Aerosol Can Industry Revenue (Million) Forecast, by Application 2019 & 2032
- Table 30: Spain US Aerosol Can Industry Revenue (Million) Forecast, by Application 2019 & 2032
- Table 31: Russia US Aerosol Can Industry Revenue (Million) Forecast, by Application 2019 & 2032
- Table 32: Benelux US Aerosol Can Industry Revenue (Million) Forecast, by Application 2019 & 2032
- Table 33: Nordics US Aerosol Can Industry Revenue (Million) Forecast, by Application 2019 & 2032
- Table 34: Rest of Europe US Aerosol Can Industry Revenue (Million) Forecast, by Application 2019 & 2032
- Table 35: Global US Aerosol Can Industry Revenue Million Forecast, by Product type 2019 & 2032
- Table 36: Global US Aerosol Can Industry Revenue Million Forecast, by End-User 2019 & 2032
- Table 37: Global US Aerosol Can Industry Revenue Million Forecast, by Country 2019 & 2032
- Table 38: Turkey US Aerosol Can Industry Revenue (Million) Forecast, by Application 2019 & 2032
- Table 39: Israel US Aerosol Can Industry Revenue (Million) Forecast, by Application 2019 & 2032
- Table 40: GCC US Aerosol Can Industry Revenue (Million) Forecast, by Application 2019 & 2032
- Table 41: North Africa US Aerosol Can Industry Revenue (Million) Forecast, by Application 2019 & 2032
- Table 42: South Africa US Aerosol Can Industry Revenue (Million) Forecast, by Application 2019 & 2032
- Table 43: Rest of Middle East & Africa US Aerosol Can Industry Revenue (Million) Forecast, by Application 2019 & 2032
- Table 44: Global US Aerosol Can Industry Revenue Million Forecast, by Product type 2019 & 2032
- Table 45: Global US Aerosol Can Industry Revenue Million Forecast, by End-User 2019 & 2032
- Table 46: Global US Aerosol Can Industry Revenue Million Forecast, by Country 2019 & 2032
- Table 47: China US Aerosol Can Industry Revenue (Million) Forecast, by Application 2019 & 2032
- Table 48: India US Aerosol Can Industry Revenue (Million) Forecast, by Application 2019 & 2032
- Table 49: Japan US Aerosol Can Industry Revenue (Million) Forecast, by Application 2019 & 2032
- Table 50: South Korea US Aerosol Can Industry Revenue (Million) Forecast, by Application 2019 & 2032
- Table 51: ASEAN US Aerosol Can Industry Revenue (Million) Forecast, by Application 2019 & 2032
- Table 52: Oceania US Aerosol Can Industry Revenue (Million) Forecast, by Application 2019 & 2032
- Table 53: Rest of Asia Pacific US Aerosol Can Industry Revenue (Million) Forecast, by Application 2019 & 2032
Frequently Asked Questions
1. What is the projected Compound Annual Growth Rate (CAGR) of the US Aerosol Can Industry?
The projected CAGR is approximately 1.31%.
2. Which companies are prominent players in the US Aerosol Can Industry?
Key companies in the market include CCL Container Inc *List Not Exhaustive, Exal Corporation, Ball Corporation, Crown Holdings Inc, Mauser Packaging Solutions.
3. What are the main segments of the US Aerosol Can Industry?
The market segments include Product type, End-User.
4. Can you provide details about the market size?
The market size is estimated to be USD XX Million as of 2022.
5. What are some drivers contributing to market growth?
; Growing Demand from the Cosmetic Industry.
6. What are the notable trends driving market growth?
Aluminum Cans to Register Highest Growth.
7. Are there any restraints impacting market growth?
; Increasing Competition from Substitute Packaging.
8. Can you provide examples of recent developments in the market?
N/A
9. What pricing options are available for accessing the report?
Pricing options include single-user, multi-user, and enterprise licenses priced at USD 3800, USD 4500, and USD 5800 respectively.
10. Is the market size provided in terms of value or volume?
The market size is provided in terms of value, measured in Million.
11. Are there any specific market keywords associated with the report?
Yes, the market keyword associated with the report is "US Aerosol Can Industry," which aids in identifying and referencing the specific market segment covered.
12. How do I determine which pricing option suits my needs best?
The pricing options vary based on user requirements and access needs. Individual users may opt for single-user licenses, while businesses requiring broader access may choose multi-user or enterprise licenses for cost-effective access to the report.
13. Are there any additional resources or data provided in the US Aerosol Can Industry report?
While the report offers comprehensive insights, it's advisable to review the specific contents or supplementary materials provided to ascertain if additional resources or data are available.
14. How can I stay updated on further developments or reports in the US Aerosol Can Industry?
To stay informed about further developments, trends, and reports in the US Aerosol Can Industry, consider subscribing to industry newsletters, following relevant companies and organizations, or regularly checking reputable industry news sources and publications.
Methodology
Step 1 - Identification of Relevant Samples Size from Population Database


Step 2 - Approaches for Defining Global Market Size (Value, Volume* & Price*)

Note*: In applicable scenarios
Step 3 - Data Sources
Primary Research
- Web Analytics
- Survey Reports
- Research Institute
- Latest Research Reports
- Opinion Leaders
Secondary Research
- Annual Reports
- White Paper
- Latest Press Release
- Industry Association
- Paid Database
- Investor Presentations

Step 4 - Data Triangulation
Involves using different sources of information in order to increase the validity of a study
These sources are likely to be stakeholders in a program - participants, other researchers, program staff, other community members, and so on.
Then we put all data in single framework & apply various statistical tools to find out the dynamic on the market.
During the analysis stage, feedback from the stakeholder groups would be compared to determine areas of agreement as well as areas of divergence
