

Key Insights
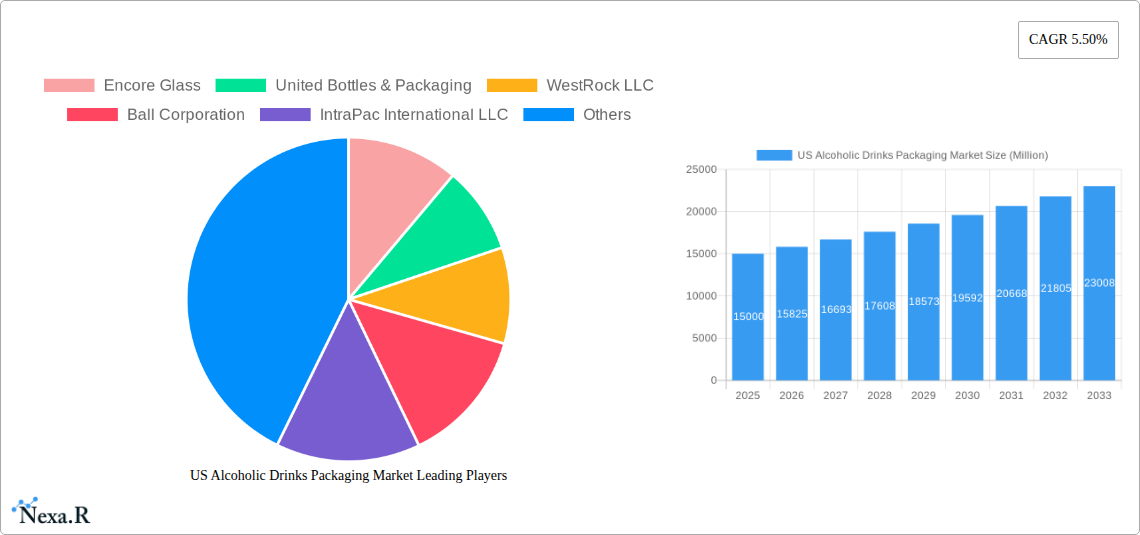
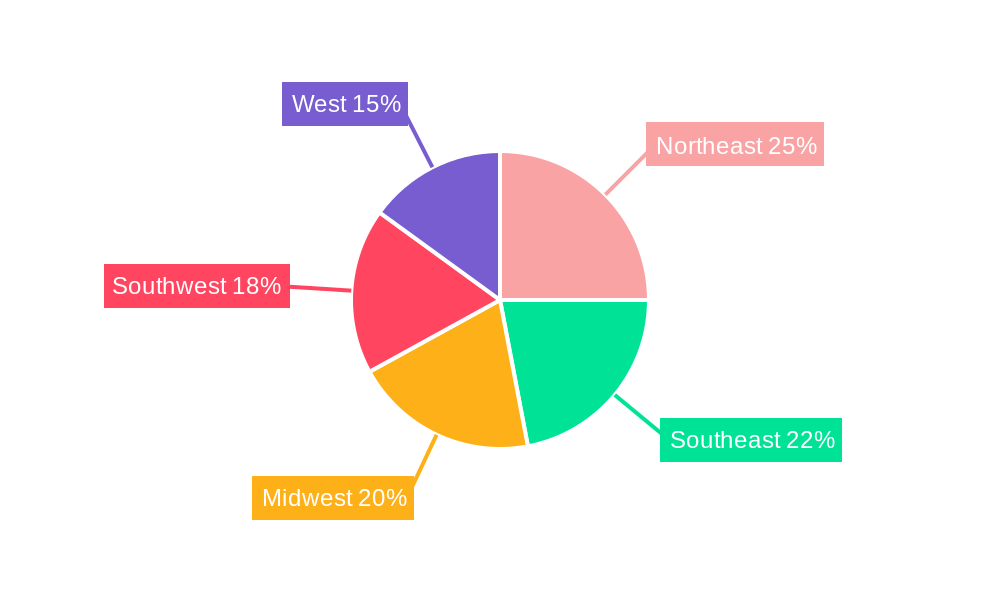
The US alcoholic drinks packaging market, valued at approximately $XX million in 2025, is projected to experience robust growth, exhibiting a Compound Annual Growth Rate (CAGR) of 5.50% from 2025 to 2033. This expansion is fueled by several key drivers. The increasing demand for ready-to-drink (RTD) alcoholic beverages, coupled with a rising preference for convenient and portable packaging formats like cans and pouches, significantly contributes to market growth. Furthermore, the premiumization trend within the alcoholic beverage industry, with brands focusing on sophisticated packaging designs to enhance shelf appeal and brand image, is driving demand for higher-quality packaging materials like glass and metal. Consumer preference for sustainable and eco-friendly packaging options is another significant factor influencing market dynamics. This includes a growing interest in recyclable materials, lightweight packaging to reduce transportation costs and environmental impact, and innovative packaging designs that minimize waste. However, fluctuating raw material prices, particularly for glass and metal, pose a significant restraint to market growth. Additionally, stringent government regulations regarding packaging materials and labeling, along with concerns about potential health impacts from certain packaging components, are factors that the industry must navigate. Segmentation analysis reveals that glass bottles dominate the market by product type, while wine holds a significant share in the alcohol type segment. Regionally, the market is geographically diverse, with significant growth potential across all US regions including the Northeast, Southeast, Midwest, Southwest, and West, driven by varying consumption patterns and regional preferences.
The competitive landscape is characterized by a mix of established players and emerging companies. Key market participants, including Encore Glass, United Bottles & Packaging, WestRock LLC, Ball Corporation, and others, are actively engaged in strategic initiatives such as product innovation, capacity expansion, and mergers and acquisitions to strengthen their market positions. Their success depends on adapting to changing consumer preferences, embracing sustainability initiatives, and proactively managing supply chain disruptions and escalating raw material costs. Growth opportunities lie in developing innovative packaging solutions that address both consumer demand and environmental concerns, while maintaining cost-effectiveness and aligning with evolving regulatory landscapes. This includes exploring lighter-weight materials, exploring biodegradable and compostable packaging options, and investing in advanced technologies for efficient and sustainable packaging production. The market's trajectory indicates a bright outlook, but necessitates a strategic approach to navigate challenges and leverage growth opportunities.
US Alcoholic Drinks Packaging Market: A Comprehensive Report (2019-2033)
This comprehensive report provides a detailed analysis of the US alcoholic drinks packaging market, offering invaluable insights for industry professionals, investors, and stakeholders. We delve into market dynamics, growth trends, regional dominance, product landscapes, and key players, forecasting market evolution from 2019 to 2033. The report covers a broad spectrum, including parent markets (packaging industry) and child markets (wine, spirits, beer packaging), delivering a granular view of this dynamic sector. Estimated market size in 2025 is valued at xx Million units.
US Alcoholic Drinks Packaging Market Dynamics & Structure
The US alcoholic drinks packaging market is characterized by a moderately concentrated landscape, with key players holding significant market share. Technological innovation, particularly in sustainable and lightweight packaging solutions, is a major driver. Stringent regulatory frameworks concerning material composition, labeling, and recyclability significantly influence market dynamics. The market faces competition from substitute packaging materials, pushing manufacturers to constantly innovate. End-user demographics, particularly shifts in consumer preferences towards premiumization and sustainability, significantly impact demand. M&A activity within the industry remains consistent, with approximately xx deals recorded between 2019 and 2024, driving consolidation and market share realignment.
- Market Concentration: Moderately concentrated, with top 5 players holding approximately xx% market share in 2024.
- Technological Innovation: Focus on lightweighting, sustainability (recycled content, biodegradable materials), and enhanced barrier properties.
- Regulatory Framework: Compliance with FDA regulations and state-specific alcohol beverage control board rules.
- Competitive Substitutes: Competition from alternative packaging materials like flexible pouches and alternative closures.
- End-User Demographics: Increasing demand for premium and sustainable packaging among millennials and Gen Z.
- M&A Trends: Consolidation continues, with an average of xx M&A deals annually during 2019-2024.
US Alcoholic Drinks Packaging Market Growth Trends & Insights
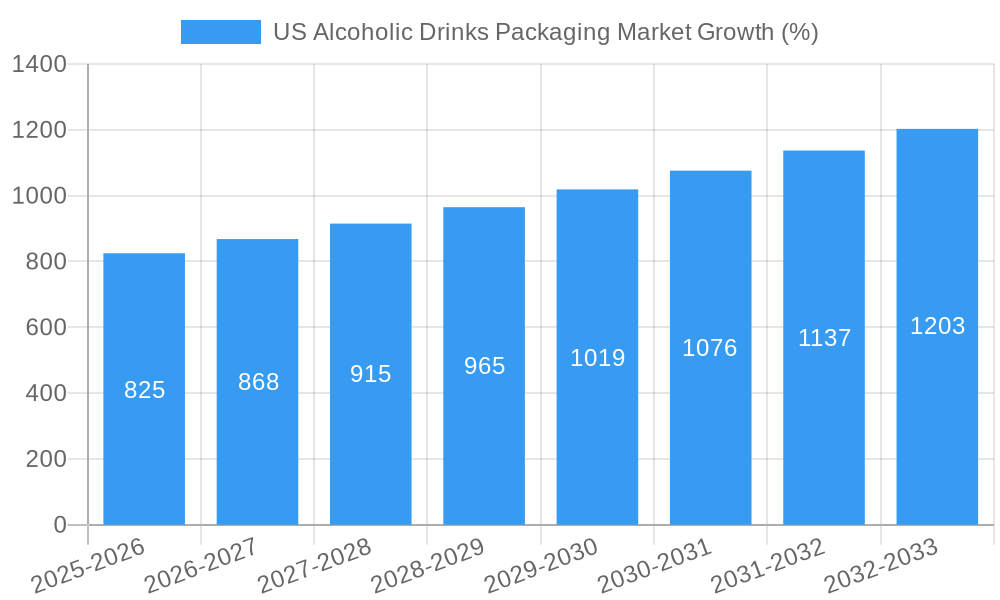
The US alcoholic drinks packaging market exhibits a robust growth trajectory, driven by several factors. The market size experienced a CAGR of xx% during the historical period (2019-2024), reaching xx Million units in 2024. This growth is projected to continue at a CAGR of xx% during the forecast period (2025-2033), reaching xx Million units by 2033. Technological disruptions, including the adoption of lightweighting technologies and sustainable materials, are accelerating market expansion. Consumer behavior shifts toward premiumization and convenience further fuel demand. The increasing preference for ready-to-drink (RTD) cocktails and craft beverages also impacts packaging choice and market growth. Market penetration of eco-friendly packaging is expected to increase to xx% by 2033. Detailed analysis of various segments' growth trends will be provided in the full report.
Dominant Regions, Countries, or Segments in US Alcoholic Drinks Packaging Market
The US alcoholic drinks packaging market displays diverse regional and segmental growth patterns. California, New York, and Texas are the leading states, driven by high alcohol consumption and a robust beverage industry. The glass segment maintains dominance in terms of primary material, driven by its premium image and recyclability. Within alcohol types, the wine and spirits segments exhibit high growth, influenced by premiumization and increasing consumer spending. The glass bottle segment retains its leading position in product type, however metal cans show strong growth in beer and RTD segments.
- Leading Regions: California, New York, and Texas account for xx% of the total market value.
- Dominant Primary Material: Glass, accounting for approximately xx% of market share in 2024.
- High-Growth Alcohol Types: Wine and spirits show the highest growth rates due to premiumization trends.
- Leading Product Type: Glass Bottles maintain a leading market position, followed by Metal Cans.
US Alcoholic Drinks Packaging Market Product Landscape
The product landscape is characterized by continuous innovation, with companies focusing on lightweighting, improved barrier properties, and enhanced sustainability. Glass bottles remain the dominant product, especially for premium spirits and wine, while metal cans are prevalent for beer and RTDs. Innovative closures, such as screw caps and resealable options, cater to evolving consumer preferences for convenience. The increasing adoption of sustainable materials, including recycled content and bio-based plastics, significantly impacts product development and market positioning. Unique selling propositions often center around sustainability certifications and improved recyclability. Technological advancements concentrate on reducing packaging weight without compromising product integrity.
Key Drivers, Barriers & Challenges in US Alcoholic Drinks Packaging Market
Key Drivers:
- Growing demand for alcoholic beverages, particularly premium segments.
- Consumer preference for convenient and sustainable packaging options.
- Technological advancements in lightweighting and sustainable materials.
- Increasing adoption of e-commerce and direct-to-consumer models.
Key Barriers and Challenges:
- Fluctuating raw material prices (e.g., glass, aluminum, plastic).
- Supply chain disruptions and logistics costs.
- Stringent regulatory compliance requirements.
- Intense competition among packaging manufacturers. Estimated annual impact of supply chain issues on market growth: xx% (2022-2024).
Emerging Opportunities in US Alcoholic Drinks Packaging Market
- Growing demand for sustainable and eco-friendly packaging solutions.
- Expanding opportunities in the craft beverage and RTD segments.
- Increased focus on personalization and customization of packaging.
- Exploration of innovative packaging formats, such as flexible pouches and innovative closures.
Growth Accelerators in the US Alcoholic Drinks Packaging Market Industry
Long-term growth will be driven by technological advancements, including the development of lighter, more sustainable, and more efficient packaging materials and processes. Strategic partnerships between packaging manufacturers and beverage companies will streamline supply chains and foster innovation. Market expansion into emerging segments, like hard seltzers and ready-to-drink cocktails, will continue to unlock growth opportunities. The increasing adoption of e-commerce will necessitate further innovation in packaging for enhanced protection and consumer experience.
Key Players Shaping the US Alcoholic Drinks Packaging Market Market
- Encore Glass
- United Bottles & Packaging
- WestRock LLC
- Ball Corporation
- IntraPac International LLC
- Crown Holdings Inc
- Amcor PLC
- Ardagh Group S
- Berry Global Inc
- Owens-Illinois Inc
- Brick Packaging LLC
Notable Milestones in US Alcoholic Drinks Packaging Market Sector
- July 2022: Owens-Illinois Inc. announces a new USD 240 million glass manufacturing facility in Bowling Green, KY, adding 140 jobs. This signifies a major investment in expanding glass packaging capacity to meet growing demand for sustainable packaging.
- May 2022: Amcor Plc launches PowerPostTM technology, enabling up to 30% lighter bottles made from 100% recycled material, enhancing sustainability and reducing transportation costs.
In-Depth US Alcoholic Drinks Packaging Market Market Outlook
The US alcoholic drinks packaging market is poised for sustained growth, driven by continued consumer demand, technological advancements in sustainable packaging, and strategic investments by key players. Future market potential hinges on the successful adoption of eco-friendly materials and innovative packaging formats. Strategic partnerships and collaborative efforts within the industry will be crucial in addressing challenges related to supply chain disruptions and regulatory changes. The market offers significant opportunities for companies that can effectively adapt to evolving consumer preferences and offer innovative, sustainable packaging solutions.
US Alcoholic Drinks Packaging Market Segmentation
-
1. Primary Material
- 1.1. Glass
- 1.2. Metal
- 1.3. Plastic
- 1.4. Paper
-
2. Alcohol Type
- 2.1. Wine
- 2.2. Spirits
- 2.3. Beer
- 2.4. Ready to Drink (RTD)
- 2.5. Other Alcohol Types
-
3. Product Type
- 3.1. Glass Bottles
- 3.2. Metal Cans
- 3.3. Plastic Bottles
- 3.4. Cartons
- 3.5. Pouches
- 3.6. Other Product Types
US Alcoholic Drinks Packaging Market Segmentation By Geography
-
1. North America
- 1.1. United States
- 1.2. Canada
- 1.3. Mexico
-
2. South America
- 2.1. Brazil
- 2.2. Argentina
- 2.3. Rest of South America
-
3. Europe
- 3.1. United Kingdom
- 3.2. Germany
- 3.3. France
- 3.4. Italy
- 3.5. Spain
- 3.6. Russia
- 3.7. Benelux
- 3.8. Nordics
- 3.9. Rest of Europe
-
4. Middle East & Africa
- 4.1. Turkey
- 4.2. Israel
- 4.3. GCC
- 4.4. North Africa
- 4.5. South Africa
- 4.6. Rest of Middle East & Africa
-
5. Asia Pacific
- 5.1. China
- 5.2. India
- 5.3. Japan
- 5.4. South Korea
- 5.5. ASEAN
- 5.6. Oceania
- 5.7. Rest of Asia Pacific
US Alcoholic Drinks Packaging Market REPORT HIGHLIGHTS
| Aspects | Details |
|---|---|
| Study Period | 2019-2033 |
| Base Year | 2024 |
| Estimated Year | 2025 |
| Forecast Period | 2025-2033 |
| Historical Period | 2019-2024 |
| Growth Rate | CAGR of 5.50% from 2019-2033 |
| Segmentation |
|
Table of Contents
- 1. Introduction
- 1.1. Research Scope
- 1.2. Market Segmentation
- 1.3. Research Methodology
- 1.4. Definitions and Assumptions
- 2. Executive Summary
- 2.1. Introduction
- 3. Market Dynamics
- 3.1. Introduction
- 3.2. Market Drivers
- 3.2.1. High Purchasing Power of Consumers; Increasing Consumption of Alcoholic Drinks
- 3.3. Market Restrains
- 3.3.1. Presence of Alternate Packaging Solutions
- 3.4. Market Trends
- 3.4.1. Plastic to Witness the Growth
- 4. Market Factor Analysis
- 4.1. Porters Five Forces
- 4.2. Supply/Value Chain
- 4.3. PESTEL analysis
- 4.4. Market Entropy
- 4.5. Patent/Trademark Analysis
- 5. Global US Alcoholic Drinks Packaging Market Analysis, Insights and Forecast, 2019-2031
- 5.1. Market Analysis, Insights and Forecast - by Primary Material
- 5.1.1. Glass
- 5.1.2. Metal
- 5.1.3. Plastic
- 5.1.4. Paper
- 5.2. Market Analysis, Insights and Forecast - by Alcohol Type
- 5.2.1. Wine
- 5.2.2. Spirits
- 5.2.3. Beer
- 5.2.4. Ready to Drink (RTD)
- 5.2.5. Other Alcohol Types
- 5.3. Market Analysis, Insights and Forecast - by Product Type
- 5.3.1. Glass Bottles
- 5.3.2. Metal Cans
- 5.3.3. Plastic Bottles
- 5.3.4. Cartons
- 5.3.5. Pouches
- 5.3.6. Other Product Types
- 5.4. Market Analysis, Insights and Forecast - by Region
- 5.4.1. North America
- 5.4.2. South America
- 5.4.3. Europe
- 5.4.4. Middle East & Africa
- 5.4.5. Asia Pacific
- 5.1. Market Analysis, Insights and Forecast - by Primary Material
- 6. North America US Alcoholic Drinks Packaging Market Analysis, Insights and Forecast, 2019-2031
- 6.1. Market Analysis, Insights and Forecast - by Primary Material
- 6.1.1. Glass
- 6.1.2. Metal
- 6.1.3. Plastic
- 6.1.4. Paper
- 6.2. Market Analysis, Insights and Forecast - by Alcohol Type
- 6.2.1. Wine
- 6.2.2. Spirits
- 6.2.3. Beer
- 6.2.4. Ready to Drink (RTD)
- 6.2.5. Other Alcohol Types
- 6.3. Market Analysis, Insights and Forecast - by Product Type
- 6.3.1. Glass Bottles
- 6.3.2. Metal Cans
- 6.3.3. Plastic Bottles
- 6.3.4. Cartons
- 6.3.5. Pouches
- 6.3.6. Other Product Types
- 6.1. Market Analysis, Insights and Forecast - by Primary Material
- 7. South America US Alcoholic Drinks Packaging Market Analysis, Insights and Forecast, 2019-2031
- 7.1. Market Analysis, Insights and Forecast - by Primary Material
- 7.1.1. Glass
- 7.1.2. Metal
- 7.1.3. Plastic
- 7.1.4. Paper
- 7.2. Market Analysis, Insights and Forecast - by Alcohol Type
- 7.2.1. Wine
- 7.2.2. Spirits
- 7.2.3. Beer
- 7.2.4. Ready to Drink (RTD)
- 7.2.5. Other Alcohol Types
- 7.3. Market Analysis, Insights and Forecast - by Product Type
- 7.3.1. Glass Bottles
- 7.3.2. Metal Cans
- 7.3.3. Plastic Bottles
- 7.3.4. Cartons
- 7.3.5. Pouches
- 7.3.6. Other Product Types
- 7.1. Market Analysis, Insights and Forecast - by Primary Material
- 8. Europe US Alcoholic Drinks Packaging Market Analysis, Insights and Forecast, 2019-2031
- 8.1. Market Analysis, Insights and Forecast - by Primary Material
- 8.1.1. Glass
- 8.1.2. Metal
- 8.1.3. Plastic
- 8.1.4. Paper
- 8.2. Market Analysis, Insights and Forecast - by Alcohol Type
- 8.2.1. Wine
- 8.2.2. Spirits
- 8.2.3. Beer
- 8.2.4. Ready to Drink (RTD)
- 8.2.5. Other Alcohol Types
- 8.3. Market Analysis, Insights and Forecast - by Product Type
- 8.3.1. Glass Bottles
- 8.3.2. Metal Cans
- 8.3.3. Plastic Bottles
- 8.3.4. Cartons
- 8.3.5. Pouches
- 8.3.6. Other Product Types
- 8.1. Market Analysis, Insights and Forecast - by Primary Material
- 9. Middle East & Africa US Alcoholic Drinks Packaging Market Analysis, Insights and Forecast, 2019-2031
- 9.1. Market Analysis, Insights and Forecast - by Primary Material
- 9.1.1. Glass
- 9.1.2. Metal
- 9.1.3. Plastic
- 9.1.4. Paper
- 9.2. Market Analysis, Insights and Forecast - by Alcohol Type
- 9.2.1. Wine
- 9.2.2. Spirits
- 9.2.3. Beer
- 9.2.4. Ready to Drink (RTD)
- 9.2.5. Other Alcohol Types
- 9.3. Market Analysis, Insights and Forecast - by Product Type
- 9.3.1. Glass Bottles
- 9.3.2. Metal Cans
- 9.3.3. Plastic Bottles
- 9.3.4. Cartons
- 9.3.5. Pouches
- 9.3.6. Other Product Types
- 9.1. Market Analysis, Insights and Forecast - by Primary Material
- 10. Asia Pacific US Alcoholic Drinks Packaging Market Analysis, Insights and Forecast, 2019-2031
- 10.1. Market Analysis, Insights and Forecast - by Primary Material
- 10.1.1. Glass
- 10.1.2. Metal
- 10.1.3. Plastic
- 10.1.4. Paper
- 10.2. Market Analysis, Insights and Forecast - by Alcohol Type
- 10.2.1. Wine
- 10.2.2. Spirits
- 10.2.3. Beer
- 10.2.4. Ready to Drink (RTD)
- 10.2.5. Other Alcohol Types
- 10.3. Market Analysis, Insights and Forecast - by Product Type
- 10.3.1. Glass Bottles
- 10.3.2. Metal Cans
- 10.3.3. Plastic Bottles
- 10.3.4. Cartons
- 10.3.5. Pouches
- 10.3.6. Other Product Types
- 10.1. Market Analysis, Insights and Forecast - by Primary Material
- 11. Northeast US Alcoholic Drinks Packaging Market Analysis, Insights and Forecast, 2019-2031
- 12. Southeast US Alcoholic Drinks Packaging Market Analysis, Insights and Forecast, 2019-2031
- 13. Midwest US Alcoholic Drinks Packaging Market Analysis, Insights and Forecast, 2019-2031
- 14. Southwest US Alcoholic Drinks Packaging Market Analysis, Insights and Forecast, 2019-2031
- 15. West US Alcoholic Drinks Packaging Market Analysis, Insights and Forecast, 2019-2031
- 16. Competitive Analysis
- 16.1. Global Market Share Analysis 2024
- 16.2. Company Profiles
- 16.2.1 Encore Glass
- 16.2.1.1. Overview
- 16.2.1.2. Products
- 16.2.1.3. SWOT Analysis
- 16.2.1.4. Recent Developments
- 16.2.1.5. Financials (Based on Availability)
- 16.2.2 United Bottles & Packaging
- 16.2.2.1. Overview
- 16.2.2.2. Products
- 16.2.2.3. SWOT Analysis
- 16.2.2.4. Recent Developments
- 16.2.2.5. Financials (Based on Availability)
- 16.2.3 WestRock LLC
- 16.2.3.1. Overview
- 16.2.3.2. Products
- 16.2.3.3. SWOT Analysis
- 16.2.3.4. Recent Developments
- 16.2.3.5. Financials (Based on Availability)
- 16.2.4 Ball Corporation
- 16.2.4.1. Overview
- 16.2.4.2. Products
- 16.2.4.3. SWOT Analysis
- 16.2.4.4. Recent Developments
- 16.2.4.5. Financials (Based on Availability)
- 16.2.5 IntraPac International LLC
- 16.2.5.1. Overview
- 16.2.5.2. Products
- 16.2.5.3. SWOT Analysis
- 16.2.5.4. Recent Developments
- 16.2.5.5. Financials (Based on Availability)
- 16.2.6 Crown Holdings Inc
- 16.2.6.1. Overview
- 16.2.6.2. Products
- 16.2.6.3. SWOT Analysis
- 16.2.6.4. Recent Developments
- 16.2.6.5. Financials (Based on Availability)
- 16.2.7 Amcor PLC
- 16.2.7.1. Overview
- 16.2.7.2. Products
- 16.2.7.3. SWOT Analysis
- 16.2.7.4. Recent Developments
- 16.2.7.5. Financials (Based on Availability)
- 16.2.8 Ardagh Group S
- 16.2.8.1. Overview
- 16.2.8.2. Products
- 16.2.8.3. SWOT Analysis
- 16.2.8.4. Recent Developments
- 16.2.8.5. Financials (Based on Availability)
- 16.2.9 Berry Global Inc
- 16.2.9.1. Overview
- 16.2.9.2. Products
- 16.2.9.3. SWOT Analysis
- 16.2.9.4. Recent Developments
- 16.2.9.5. Financials (Based on Availability)
- 16.2.10 Owens-Illinois Inc
- 16.2.10.1. Overview
- 16.2.10.2. Products
- 16.2.10.3. SWOT Analysis
- 16.2.10.4. Recent Developments
- 16.2.10.5. Financials (Based on Availability)
- 16.2.11 Brick Packaging LLC
- 16.2.11.1. Overview
- 16.2.11.2. Products
- 16.2.11.3. SWOT Analysis
- 16.2.11.4. Recent Developments
- 16.2.11.5. Financials (Based on Availability)
- 16.2.1 Encore Glass
List of Figures
- Figure 1: Global US Alcoholic Drinks Packaging Market Revenue Breakdown (Million, %) by Region 2024 & 2032
- Figure 2: United states US Alcoholic Drinks Packaging Market Revenue (Million), by Country 2024 & 2032
- Figure 3: United states US Alcoholic Drinks Packaging Market Revenue Share (%), by Country 2024 & 2032
- Figure 4: North America US Alcoholic Drinks Packaging Market Revenue (Million), by Primary Material 2024 & 2032
- Figure 5: North America US Alcoholic Drinks Packaging Market Revenue Share (%), by Primary Material 2024 & 2032
- Figure 6: North America US Alcoholic Drinks Packaging Market Revenue (Million), by Alcohol Type 2024 & 2032
- Figure 7: North America US Alcoholic Drinks Packaging Market Revenue Share (%), by Alcohol Type 2024 & 2032
- Figure 8: North America US Alcoholic Drinks Packaging Market Revenue (Million), by Product Type 2024 & 2032
- Figure 9: North America US Alcoholic Drinks Packaging Market Revenue Share (%), by Product Type 2024 & 2032
- Figure 10: North America US Alcoholic Drinks Packaging Market Revenue (Million), by Country 2024 & 2032
- Figure 11: North America US Alcoholic Drinks Packaging Market Revenue Share (%), by Country 2024 & 2032
- Figure 12: South America US Alcoholic Drinks Packaging Market Revenue (Million), by Primary Material 2024 & 2032
- Figure 13: South America US Alcoholic Drinks Packaging Market Revenue Share (%), by Primary Material 2024 & 2032
- Figure 14: South America US Alcoholic Drinks Packaging Market Revenue (Million), by Alcohol Type 2024 & 2032
- Figure 15: South America US Alcoholic Drinks Packaging Market Revenue Share (%), by Alcohol Type 2024 & 2032
- Figure 16: South America US Alcoholic Drinks Packaging Market Revenue (Million), by Product Type 2024 & 2032
- Figure 17: South America US Alcoholic Drinks Packaging Market Revenue Share (%), by Product Type 2024 & 2032
- Figure 18: South America US Alcoholic Drinks Packaging Market Revenue (Million), by Country 2024 & 2032
- Figure 19: South America US Alcoholic Drinks Packaging Market Revenue Share (%), by Country 2024 & 2032
- Figure 20: Europe US Alcoholic Drinks Packaging Market Revenue (Million), by Primary Material 2024 & 2032
- Figure 21: Europe US Alcoholic Drinks Packaging Market Revenue Share (%), by Primary Material 2024 & 2032
- Figure 22: Europe US Alcoholic Drinks Packaging Market Revenue (Million), by Alcohol Type 2024 & 2032
- Figure 23: Europe US Alcoholic Drinks Packaging Market Revenue Share (%), by Alcohol Type 2024 & 2032
- Figure 24: Europe US Alcoholic Drinks Packaging Market Revenue (Million), by Product Type 2024 & 2032
- Figure 25: Europe US Alcoholic Drinks Packaging Market Revenue Share (%), by Product Type 2024 & 2032
- Figure 26: Europe US Alcoholic Drinks Packaging Market Revenue (Million), by Country 2024 & 2032
- Figure 27: Europe US Alcoholic Drinks Packaging Market Revenue Share (%), by Country 2024 & 2032
- Figure 28: Middle East & Africa US Alcoholic Drinks Packaging Market Revenue (Million), by Primary Material 2024 & 2032
- Figure 29: Middle East & Africa US Alcoholic Drinks Packaging Market Revenue Share (%), by Primary Material 2024 & 2032
- Figure 30: Middle East & Africa US Alcoholic Drinks Packaging Market Revenue (Million), by Alcohol Type 2024 & 2032
- Figure 31: Middle East & Africa US Alcoholic Drinks Packaging Market Revenue Share (%), by Alcohol Type 2024 & 2032
- Figure 32: Middle East & Africa US Alcoholic Drinks Packaging Market Revenue (Million), by Product Type 2024 & 2032
- Figure 33: Middle East & Africa US Alcoholic Drinks Packaging Market Revenue Share (%), by Product Type 2024 & 2032
- Figure 34: Middle East & Africa US Alcoholic Drinks Packaging Market Revenue (Million), by Country 2024 & 2032
- Figure 35: Middle East & Africa US Alcoholic Drinks Packaging Market Revenue Share (%), by Country 2024 & 2032
- Figure 36: Asia Pacific US Alcoholic Drinks Packaging Market Revenue (Million), by Primary Material 2024 & 2032
- Figure 37: Asia Pacific US Alcoholic Drinks Packaging Market Revenue Share (%), by Primary Material 2024 & 2032
- Figure 38: Asia Pacific US Alcoholic Drinks Packaging Market Revenue (Million), by Alcohol Type 2024 & 2032
- Figure 39: Asia Pacific US Alcoholic Drinks Packaging Market Revenue Share (%), by Alcohol Type 2024 & 2032
- Figure 40: Asia Pacific US Alcoholic Drinks Packaging Market Revenue (Million), by Product Type 2024 & 2032
- Figure 41: Asia Pacific US Alcoholic Drinks Packaging Market Revenue Share (%), by Product Type 2024 & 2032
- Figure 42: Asia Pacific US Alcoholic Drinks Packaging Market Revenue (Million), by Country 2024 & 2032
- Figure 43: Asia Pacific US Alcoholic Drinks Packaging Market Revenue Share (%), by Country 2024 & 2032
List of Tables
- Table 1: Global US Alcoholic Drinks Packaging Market Revenue Million Forecast, by Region 2019 & 2032
- Table 2: Global US Alcoholic Drinks Packaging Market Revenue Million Forecast, by Primary Material 2019 & 2032
- Table 3: Global US Alcoholic Drinks Packaging Market Revenue Million Forecast, by Alcohol Type 2019 & 2032
- Table 4: Global US Alcoholic Drinks Packaging Market Revenue Million Forecast, by Product Type 2019 & 2032
- Table 5: Global US Alcoholic Drinks Packaging Market Revenue Million Forecast, by Region 2019 & 2032
- Table 6: Global US Alcoholic Drinks Packaging Market Revenue Million Forecast, by Country 2019 & 2032
- Table 7: Northeast US Alcoholic Drinks Packaging Market Revenue (Million) Forecast, by Application 2019 & 2032
- Table 8: Southeast US Alcoholic Drinks Packaging Market Revenue (Million) Forecast, by Application 2019 & 2032
- Table 9: Midwest US Alcoholic Drinks Packaging Market Revenue (Million) Forecast, by Application 2019 & 2032
- Table 10: Southwest US Alcoholic Drinks Packaging Market Revenue (Million) Forecast, by Application 2019 & 2032
- Table 11: West US Alcoholic Drinks Packaging Market Revenue (Million) Forecast, by Application 2019 & 2032
- Table 12: Global US Alcoholic Drinks Packaging Market Revenue Million Forecast, by Primary Material 2019 & 2032
- Table 13: Global US Alcoholic Drinks Packaging Market Revenue Million Forecast, by Alcohol Type 2019 & 2032
- Table 14: Global US Alcoholic Drinks Packaging Market Revenue Million Forecast, by Product Type 2019 & 2032
- Table 15: Global US Alcoholic Drinks Packaging Market Revenue Million Forecast, by Country 2019 & 2032
- Table 16: United States US Alcoholic Drinks Packaging Market Revenue (Million) Forecast, by Application 2019 & 2032
- Table 17: Canada US Alcoholic Drinks Packaging Market Revenue (Million) Forecast, by Application 2019 & 2032
- Table 18: Mexico US Alcoholic Drinks Packaging Market Revenue (Million) Forecast, by Application 2019 & 2032
- Table 19: Global US Alcoholic Drinks Packaging Market Revenue Million Forecast, by Primary Material 2019 & 2032
- Table 20: Global US Alcoholic Drinks Packaging Market Revenue Million Forecast, by Alcohol Type 2019 & 2032
- Table 21: Global US Alcoholic Drinks Packaging Market Revenue Million Forecast, by Product Type 2019 & 2032
- Table 22: Global US Alcoholic Drinks Packaging Market Revenue Million Forecast, by Country 2019 & 2032
- Table 23: Brazil US Alcoholic Drinks Packaging Market Revenue (Million) Forecast, by Application 2019 & 2032
- Table 24: Argentina US Alcoholic Drinks Packaging Market Revenue (Million) Forecast, by Application 2019 & 2032
- Table 25: Rest of South America US Alcoholic Drinks Packaging Market Revenue (Million) Forecast, by Application 2019 & 2032
- Table 26: Global US Alcoholic Drinks Packaging Market Revenue Million Forecast, by Primary Material 2019 & 2032
- Table 27: Global US Alcoholic Drinks Packaging Market Revenue Million Forecast, by Alcohol Type 2019 & 2032
- Table 28: Global US Alcoholic Drinks Packaging Market Revenue Million Forecast, by Product Type 2019 & 2032
- Table 29: Global US Alcoholic Drinks Packaging Market Revenue Million Forecast, by Country 2019 & 2032
- Table 30: United Kingdom US Alcoholic Drinks Packaging Market Revenue (Million) Forecast, by Application 2019 & 2032
- Table 31: Germany US Alcoholic Drinks Packaging Market Revenue (Million) Forecast, by Application 2019 & 2032
- Table 32: France US Alcoholic Drinks Packaging Market Revenue (Million) Forecast, by Application 2019 & 2032
- Table 33: Italy US Alcoholic Drinks Packaging Market Revenue (Million) Forecast, by Application 2019 & 2032
- Table 34: Spain US Alcoholic Drinks Packaging Market Revenue (Million) Forecast, by Application 2019 & 2032
- Table 35: Russia US Alcoholic Drinks Packaging Market Revenue (Million) Forecast, by Application 2019 & 2032
- Table 36: Benelux US Alcoholic Drinks Packaging Market Revenue (Million) Forecast, by Application 2019 & 2032
- Table 37: Nordics US Alcoholic Drinks Packaging Market Revenue (Million) Forecast, by Application 2019 & 2032
- Table 38: Rest of Europe US Alcoholic Drinks Packaging Market Revenue (Million) Forecast, by Application 2019 & 2032
- Table 39: Global US Alcoholic Drinks Packaging Market Revenue Million Forecast, by Primary Material 2019 & 2032
- Table 40: Global US Alcoholic Drinks Packaging Market Revenue Million Forecast, by Alcohol Type 2019 & 2032
- Table 41: Global US Alcoholic Drinks Packaging Market Revenue Million Forecast, by Product Type 2019 & 2032
- Table 42: Global US Alcoholic Drinks Packaging Market Revenue Million Forecast, by Country 2019 & 2032
- Table 43: Turkey US Alcoholic Drinks Packaging Market Revenue (Million) Forecast, by Application 2019 & 2032
- Table 44: Israel US Alcoholic Drinks Packaging Market Revenue (Million) Forecast, by Application 2019 & 2032
- Table 45: GCC US Alcoholic Drinks Packaging Market Revenue (Million) Forecast, by Application 2019 & 2032
- Table 46: North Africa US Alcoholic Drinks Packaging Market Revenue (Million) Forecast, by Application 2019 & 2032
- Table 47: South Africa US Alcoholic Drinks Packaging Market Revenue (Million) Forecast, by Application 2019 & 2032
- Table 48: Rest of Middle East & Africa US Alcoholic Drinks Packaging Market Revenue (Million) Forecast, by Application 2019 & 2032
- Table 49: Global US Alcoholic Drinks Packaging Market Revenue Million Forecast, by Primary Material 2019 & 2032
- Table 50: Global US Alcoholic Drinks Packaging Market Revenue Million Forecast, by Alcohol Type 2019 & 2032
- Table 51: Global US Alcoholic Drinks Packaging Market Revenue Million Forecast, by Product Type 2019 & 2032
- Table 52: Global US Alcoholic Drinks Packaging Market Revenue Million Forecast, by Country 2019 & 2032
- Table 53: China US Alcoholic Drinks Packaging Market Revenue (Million) Forecast, by Application 2019 & 2032
- Table 54: India US Alcoholic Drinks Packaging Market Revenue (Million) Forecast, by Application 2019 & 2032
- Table 55: Japan US Alcoholic Drinks Packaging Market Revenue (Million) Forecast, by Application 2019 & 2032
- Table 56: South Korea US Alcoholic Drinks Packaging Market Revenue (Million) Forecast, by Application 2019 & 2032
- Table 57: ASEAN US Alcoholic Drinks Packaging Market Revenue (Million) Forecast, by Application 2019 & 2032
- Table 58: Oceania US Alcoholic Drinks Packaging Market Revenue (Million) Forecast, by Application 2019 & 2032
- Table 59: Rest of Asia Pacific US Alcoholic Drinks Packaging Market Revenue (Million) Forecast, by Application 2019 & 2032
Frequently Asked Questions
1. What is the projected Compound Annual Growth Rate (CAGR) of the US Alcoholic Drinks Packaging Market?
The projected CAGR is approximately 5.50%.
2. Which companies are prominent players in the US Alcoholic Drinks Packaging Market?
Key companies in the market include Encore Glass, United Bottles & Packaging, WestRock LLC, Ball Corporation, IntraPac International LLC, Crown Holdings Inc, Amcor PLC, Ardagh Group S, Berry Global Inc, Owens-Illinois Inc, Brick Packaging LLC.
3. What are the main segments of the US Alcoholic Drinks Packaging Market?
The market segments include Primary Material, Alcohol Type, Product Type.
4. Can you provide details about the market size?
The market size is estimated to be USD XX Million as of 2022.
5. What are some drivers contributing to market growth?
High Purchasing Power of Consumers; Increasing Consumption of Alcoholic Drinks.
6. What are the notable trends driving market growth?
Plastic to Witness the Growth.
7. Are there any restraints impacting market growth?
Presence of Alternate Packaging Solutions.
8. Can you provide examples of recent developments in the market?
July 2022 - Owens-Illinois Inc. will make a new greenfield glass manufacturing facility in Bowling Green, KY. In response to the growing consumer demand for eco-friendly, recyclable, and sustainable food and beverage packaging, the company is expanding its ability to provide its clients with premium glass containers that help promote its brands. The business intends to invest up to USD 240 million over several expansion waves and add 140 new jobs to the area, approximately 140 new jobs in the region.
9. What pricing options are available for accessing the report?
Pricing options include single-user, multi-user, and enterprise licenses priced at USD 3800, USD 4500, and USD 5800 respectively.
10. Is the market size provided in terms of value or volume?
The market size is provided in terms of value, measured in Million.
11. Are there any specific market keywords associated with the report?
Yes, the market keyword associated with the report is "US Alcoholic Drinks Packaging Market," which aids in identifying and referencing the specific market segment covered.
12. How do I determine which pricing option suits my needs best?
The pricing options vary based on user requirements and access needs. Individual users may opt for single-user licenses, while businesses requiring broader access may choose multi-user or enterprise licenses for cost-effective access to the report.
13. Are there any additional resources or data provided in the US Alcoholic Drinks Packaging Market report?
While the report offers comprehensive insights, it's advisable to review the specific contents or supplementary materials provided to ascertain if additional resources or data are available.
14. How can I stay updated on further developments or reports in the US Alcoholic Drinks Packaging Market?
To stay informed about further developments, trends, and reports in the US Alcoholic Drinks Packaging Market, consider subscribing to industry newsletters, following relevant companies and organizations, or regularly checking reputable industry news sources and publications.
Methodology
Step 1 - Identification of Relevant Samples Size from Population Database


Step 2 - Approaches for Defining Global Market Size (Value, Volume* & Price*)

Note*: In applicable scenarios
Step 3 - Data Sources
Primary Research
- Web Analytics
- Survey Reports
- Research Institute
- Latest Research Reports
- Opinion Leaders
Secondary Research
- Annual Reports
- White Paper
- Latest Press Release
- Industry Association
- Paid Database
- Investor Presentations

Step 4 - Data Triangulation
Involves using different sources of information in order to increase the validity of a study
These sources are likely to be stakeholders in a program - participants, other researchers, program staff, other community members, and so on.
Then we put all data in single framework & apply various statistical tools to find out the dynamic on the market.
During the analysis stage, feedback from the stakeholder groups would be compared to determine areas of agreement as well as areas of divergence
