

Key Insights
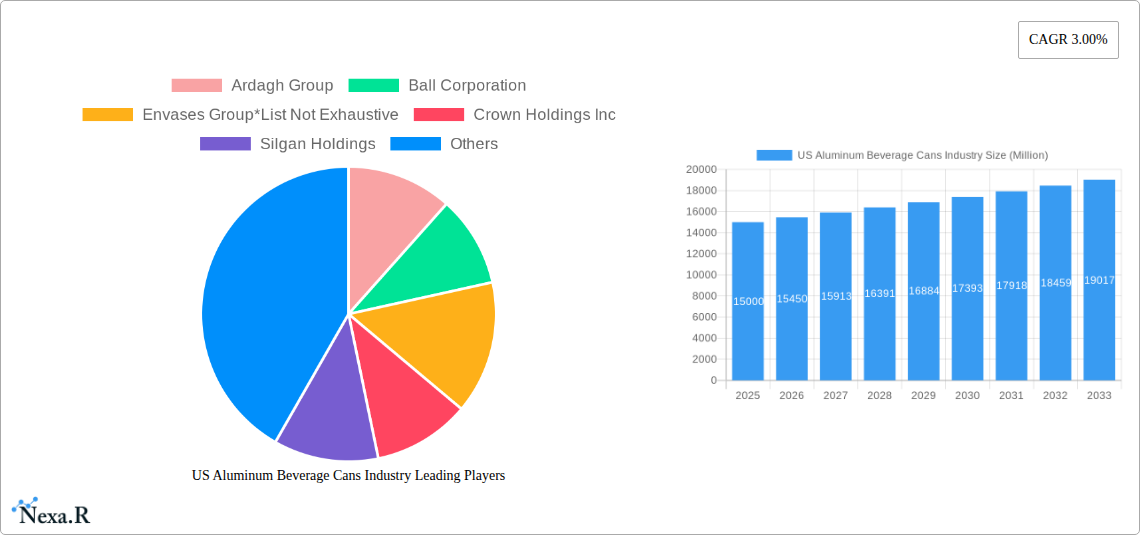
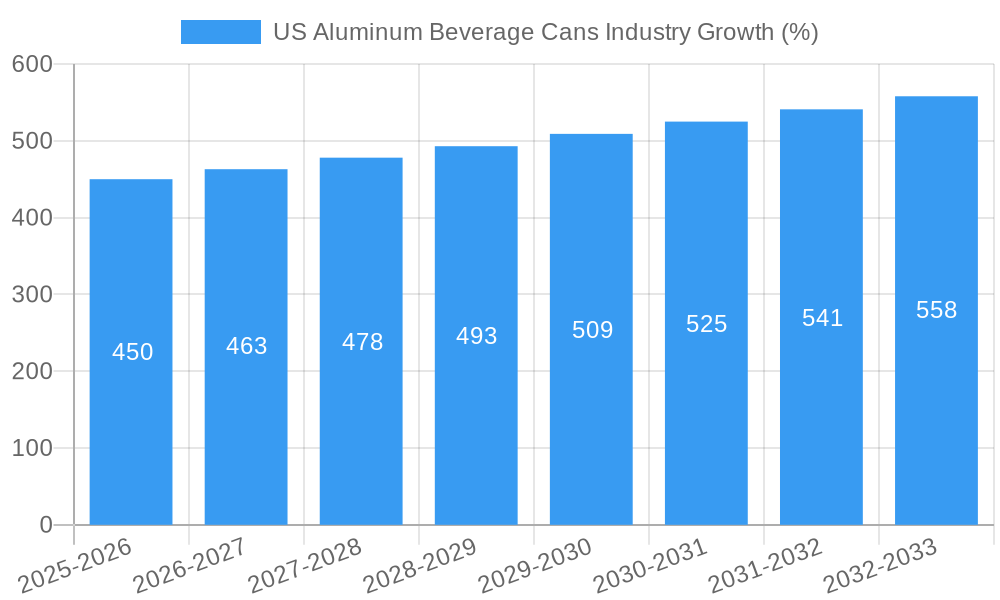
The US aluminum beverage can market, valued at approximately $15 billion in 2025, is experiencing steady growth, projected at a compound annual growth rate (CAGR) of 3.00% from 2025 to 2033. This growth is driven by several key factors. The increasing popularity of carbonated soft drinks, energy drinks, and craft beers fuels demand for lightweight, recyclable aluminum cans. Consumers are increasingly conscious of sustainability, favoring aluminum cans over other packaging options due to their high recycling rates and reduced environmental impact. Furthermore, advancements in can manufacturing technology, including lightweighting and improved printing capabilities, enhance the attractiveness of aluminum cans for beverage companies. The market is segmented by can type (2-piece and 3-piece) and beverage application (carbonated soft drinks, beer, water, energy drinks, and other beverages). While 2-piece cans dominate due to cost-effectiveness and high-speed production, 3-piece cans maintain a niche in specific applications requiring enhanced durability. The significant market share held by carbonated soft drinks and beer is expected to continue, although growth in energy drinks and other beverage segments will contribute to overall market expansion. Regional variations exist, with states like California, Texas, and Florida likely exhibiting higher demand due to population density and warmer climates. Major players like Ardagh Group, Ball Corporation, and Crown Holdings Inc. are actively investing in capacity expansion and innovative can designs to meet the growing demand and maintain their market positions. Competition is robust, with companies striving for differentiation through superior design, functionality, and sustainable practices.
The continued growth in the aluminum beverage can market will depend on several factors. Maintaining consumer preference for convenience and sustainability will be crucial. Fluctuations in aluminum prices and potential changes in environmental regulations could impact profitability. Companies will need to adapt to evolving consumer trends and preferences, such as the growing demand for smaller can sizes or specialized designs for premium beverages. Investing in research and development for lighter weight cans, improved recyclability, and innovative coatings will be key for maintaining competitiveness in the market. The success of individual companies will depend on their ability to effectively manage supply chains, optimize manufacturing processes, and engage in strategic marketing to capture market share in a competitive landscape.
US Aluminum Beverage Cans Industry: A Comprehensive Market Report (2019-2033)
This in-depth report provides a comprehensive analysis of the US aluminum beverage cans industry, offering invaluable insights for industry professionals, investors, and strategic decision-makers. Covering the period from 2019 to 2033, with a focus on 2025, this report meticulously examines market dynamics, growth trends, competitive landscapes, and future opportunities within this rapidly evolving sector. The report analyzes parent markets (packaging industry) and child markets (specific beverage types) to provide a nuanced understanding of market segmentation and growth drivers. Units are expressed in millions.
US Aluminum Beverage Cans Industry Market Dynamics & Structure
The US aluminum beverage cans market is characterized by a moderately concentrated structure, with key players like Ardagh Group, Ball Corporation, Envases Group, Crown Holdings Inc., Silgan Holdings, and Metal Container Corporation holding significant market share. The market's dynamics are shaped by several factors:
- Technological Innovation: Continuous advancements in can manufacturing processes (e.g., lightweighting, improved printing techniques) drive efficiency and cost reductions. However, high capital expenditure requirements for new technologies can present a barrier to entry for smaller players.
- Regulatory Framework: Environmental regulations (e.g., recycling mandates, carbon footprint reduction targets) significantly influence industry practices and product design. Compliance costs and the adoption of sustainable materials are key considerations.
- Competitive Product Substitutes: While aluminum cans maintain a strong position, competition exists from alternative packaging solutions like plastic bottles and cartons, particularly in certain beverage segments. The industry's response involves highlighting aluminum's recyclability and sustainability advantages.
- End-User Demographics: Changing consumer preferences and consumption patterns (e.g., increasing demand for healthier beverages, growth in premiumization) impact demand across different beverage categories.
- M&A Trends: Consolidation through mergers and acquisitions (M&A) is a common strategy within the industry, enabling companies to expand their market reach, enhance production capabilities, and improve their competitive positioning. The number of M&A deals fluctuated between xx and xx million deals between 2019 and 2024. Market share held by top 5 players averaged xx% during this period.
US Aluminum Beverage Cans Industry Growth Trends & Insights
The US aluminum beverage cans market exhibited a Compound Annual Growth Rate (CAGR) of xx% during the historical period (2019-2024), reaching a market size of xx million units in 2024. Growth is driven by several factors including increasing demand for convenient and sustainable packaging, particularly in rapidly expanding segments like energy drinks and ready-to-drink beverages. Technological disruptions, such as the introduction of innovative can designs and improved printing technologies, further fuel market growth. The rising adoption of eco-friendly materials and sustainable packaging solutions among consumers and brands increases demand for recyclable aluminum cans. A significant shift in consumer behavior towards healthier and premium beverages also contributes to the market's expansion. Market penetration reached xx% in 2024 and is expected to increase to xx% in 2033. The forecast period (2025-2033) projects continued growth, with a projected CAGR of xx%, reaching xx million units by 2033.
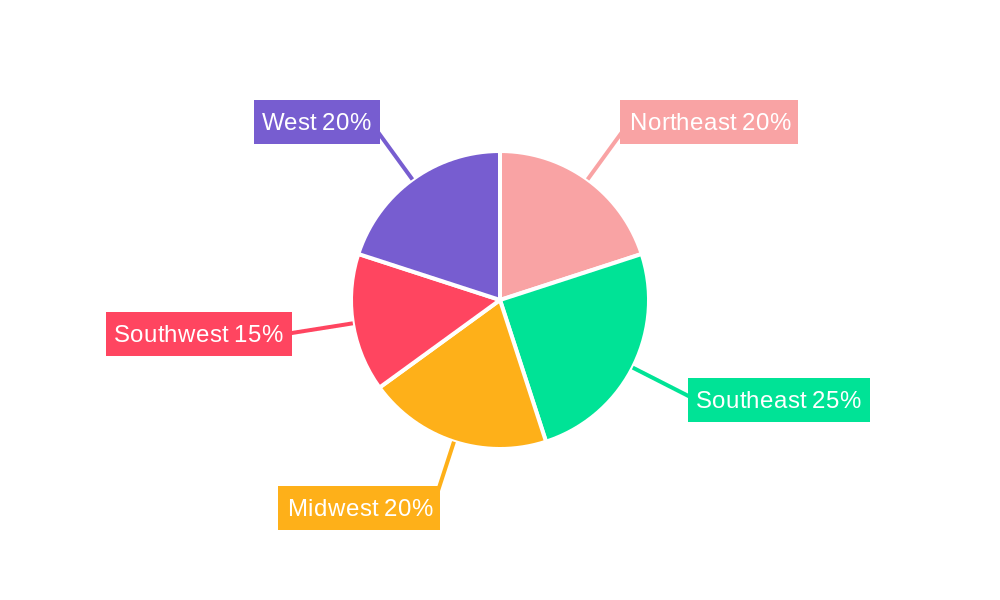
Dominant Regions, Countries, or Segments in US Aluminum Beverage Cans Industry
The largest regional markets for aluminum beverage cans within the US are concentrated in high-population, high-consumption areas. The most dominant segments are:
- By Type: The 2-piece can segment holds the largest market share, driven by its cost-effectiveness and efficient manufacturing processes. The 3-piece can segment maintains its relevance in specific applications.
- By Application: Carbonated soft drinks (CSDs) and beer remain the largest application segments, although growth is witnessed in energy drinks and other ready-to-drink beverages. The "Other Type of Beverages" category encompassing wine, spirits, flavored alcoholic beverages, juices, and dairy-based beverages are experiencing slower but steady growth.
Key drivers for these dominant segments include:
- Strong consumer preference for these beverages.
- Well-established distribution networks.
- Significant investments by key beverage manufacturers.
- Established branding and consumer loyalty.
These factors contribute to higher market share and significant growth potential within these segments compared to others.
US Aluminum Beverage Cans Industry Product Landscape
The product landscape is characterized by continuous innovation in can design, materials, and printing technologies. Lightweighting initiatives reduce material costs and carbon footprint, while improved printing techniques allow for enhanced branding and customization. Unique selling propositions (USPs) often center on sustainability features (recyclability, recycled content), convenience, and enhanced shelf appeal. Technological advancements include improved coatings for enhanced durability and tamper-evidence features.
Key Drivers, Barriers & Challenges in US Aluminum Beverage Cans Industry
Key Drivers: Increasing demand for convenient and sustainable packaging solutions, growing consumption of beverages in cans, and technological innovations in can manufacturing and design. Government regulations promoting recycling and sustainable packaging also act as a driver.
Key Challenges: Fluctuations in raw material prices (aluminum), competitive pressure from alternative packaging materials, environmental regulations, and supply chain disruptions. These challenges are expected to affect the industry's growth trajectory, with the impact potentially reducing growth by an estimated xx million units per year over the next five years.
Emerging Opportunities in US Aluminum Beverage Cans Industry
Emerging opportunities include expansion into untapped markets (e.g., craft breweries, niche beverage segments), development of innovative can designs (e.g., slim cans, multi-pack configurations), and the growing demand for sustainable and eco-friendly packaging solutions with recycled aluminum content. The increasing interest in personalized and customized cans also presents a substantial opportunity.
Growth Accelerators in the US Aluminum Beverage Cans Industry Industry
Technological advancements in can manufacturing, strategic partnerships between can manufacturers and beverage companies, and expansion into new market segments (e.g., ready-to-drink cocktails) are key accelerators. Investments in sustainable manufacturing practices, recycling programs, and innovative designs enhance the industry's long-term growth prospects.
Key Players Shaping the US Aluminum Beverage Cans Industry Market
- Ardagh Group
- Ball Corporation
- Envases Group
- Crown Holdings Inc.
- Silgan Holdings
- Metal Container Corporation
Notable Milestones in US Aluminum Beverage Cans Industry Sector
- August 2020: Crown Holdings Inc. launched its Twentyby30 initiative, outlining 20 ESG goals, including a focus on recycled content and packaging recycling.
- September 2020: Ball Corporation announced plans for a new aluminum beverage can plant in Pittston, PA, to meet the rising demand for aluminum containers.
In-Depth US Aluminum Beverage Cans Industry Market Outlook
The US aluminum beverage cans market is poised for continued growth, driven by a strong demand for sustainable packaging, innovation in can design and materials, and strategic investments by key players. The focus on sustainability, coupled with technological advancements, will shape the future of the industry, presenting significant opportunities for companies that can adapt and innovate to meet the evolving needs of the market. The market is projected to reach xx million units by 2033, representing a substantial increase from the 2024 levels.
US Aluminum Beverage Cans Industry Segmentation
-
1. Type
- 1.1. 2-Piece
- 1.2. 3-Piece
-
2. Application
- 2.1. Carbonated Soft Drinks
- 2.2. Beer
- 2.3. Water
- 2.4. Energy Drinks
- 2.5. Other Ty
US Aluminum Beverage Cans Industry Segmentation By Geography
-
1. North America
- 1.1. United States
- 1.2. Canada
- 1.3. Mexico
-
2. South America
- 2.1. Brazil
- 2.2. Argentina
- 2.3. Rest of South America
-
3. Europe
- 3.1. United Kingdom
- 3.2. Germany
- 3.3. France
- 3.4. Italy
- 3.5. Spain
- 3.6. Russia
- 3.7. Benelux
- 3.8. Nordics
- 3.9. Rest of Europe
-
4. Middle East & Africa
- 4.1. Turkey
- 4.2. Israel
- 4.3. GCC
- 4.4. North Africa
- 4.5. South Africa
- 4.6. Rest of Middle East & Africa
-
5. Asia Pacific
- 5.1. China
- 5.2. India
- 5.3. Japan
- 5.4. South Korea
- 5.5. ASEAN
- 5.6. Oceania
- 5.7. Rest of Asia Pacific
US Aluminum Beverage Cans Industry REPORT HIGHLIGHTS
| Aspects | Details |
|---|---|
| Study Period | 2019-2033 |
| Base Year | 2024 |
| Estimated Year | 2025 |
| Forecast Period | 2025-2033 |
| Historical Period | 2019-2024 |
| Growth Rate | CAGR of 3.00% from 2019-2033 |
| Segmentation |
|
Table of Contents
- 1. Introduction
- 1.1. Research Scope
- 1.2. Market Segmentation
- 1.3. Research Methodology
- 1.4. Definitions and Assumptions
- 2. Executive Summary
- 2.1. Introduction
- 3. Market Dynamics
- 3.1. Introduction
- 3.2. Market Drivers
- 3.2.1. Growing demand from the Non-Alcoholic Beverage sector; High Recyclability Rates of Metal Packaging
- 3.3. Market Restrains
- 3.3.1. Availability Of Alernative Packaging Solutions; Food Stored In Metallic Cans Cause Severe Health Issues
- 3.4. Market Trends
- 3.4.1. High Recyclability Rates of Metal Packaging is Expected to Drive the Market Growth
- 4. Market Factor Analysis
- 4.1. Porters Five Forces
- 4.2. Supply/Value Chain
- 4.3. PESTEL analysis
- 4.4. Market Entropy
- 4.5. Patent/Trademark Analysis
- 5. Global US Aluminum Beverage Cans Industry Analysis, Insights and Forecast, 2019-2031
- 5.1. Market Analysis, Insights and Forecast - by Type
- 5.1.1. 2-Piece
- 5.1.2. 3-Piece
- 5.2. Market Analysis, Insights and Forecast - by Application
- 5.2.1. Carbonated Soft Drinks
- 5.2.2. Beer
- 5.2.3. Water
- 5.2.4. Energy Drinks
- 5.2.5. Other Ty
- 5.3. Market Analysis, Insights and Forecast - by Region
- 5.3.1. North America
- 5.3.2. South America
- 5.3.3. Europe
- 5.3.4. Middle East & Africa
- 5.3.5. Asia Pacific
- 5.1. Market Analysis, Insights and Forecast - by Type
- 6. North America US Aluminum Beverage Cans Industry Analysis, Insights and Forecast, 2019-2031
- 6.1. Market Analysis, Insights and Forecast - by Type
- 6.1.1. 2-Piece
- 6.1.2. 3-Piece
- 6.2. Market Analysis, Insights and Forecast - by Application
- 6.2.1. Carbonated Soft Drinks
- 6.2.2. Beer
- 6.2.3. Water
- 6.2.4. Energy Drinks
- 6.2.5. Other Ty
- 6.1. Market Analysis, Insights and Forecast - by Type
- 7. South America US Aluminum Beverage Cans Industry Analysis, Insights and Forecast, 2019-2031
- 7.1. Market Analysis, Insights and Forecast - by Type
- 7.1.1. 2-Piece
- 7.1.2. 3-Piece
- 7.2. Market Analysis, Insights and Forecast - by Application
- 7.2.1. Carbonated Soft Drinks
- 7.2.2. Beer
- 7.2.3. Water
- 7.2.4. Energy Drinks
- 7.2.5. Other Ty
- 7.1. Market Analysis, Insights and Forecast - by Type
- 8. Europe US Aluminum Beverage Cans Industry Analysis, Insights and Forecast, 2019-2031
- 8.1. Market Analysis, Insights and Forecast - by Type
- 8.1.1. 2-Piece
- 8.1.2. 3-Piece
- 8.2. Market Analysis, Insights and Forecast - by Application
- 8.2.1. Carbonated Soft Drinks
- 8.2.2. Beer
- 8.2.3. Water
- 8.2.4. Energy Drinks
- 8.2.5. Other Ty
- 8.1. Market Analysis, Insights and Forecast - by Type
- 9. Middle East & Africa US Aluminum Beverage Cans Industry Analysis, Insights and Forecast, 2019-2031
- 9.1. Market Analysis, Insights and Forecast - by Type
- 9.1.1. 2-Piece
- 9.1.2. 3-Piece
- 9.2. Market Analysis, Insights and Forecast - by Application
- 9.2.1. Carbonated Soft Drinks
- 9.2.2. Beer
- 9.2.3. Water
- 9.2.4. Energy Drinks
- 9.2.5. Other Ty
- 9.1. Market Analysis, Insights and Forecast - by Type
- 10. Asia Pacific US Aluminum Beverage Cans Industry Analysis, Insights and Forecast, 2019-2031
- 10.1. Market Analysis, Insights and Forecast - by Type
- 10.1.1. 2-Piece
- 10.1.2. 3-Piece
- 10.2. Market Analysis, Insights and Forecast - by Application
- 10.2.1. Carbonated Soft Drinks
- 10.2.2. Beer
- 10.2.3. Water
- 10.2.4. Energy Drinks
- 10.2.5. Other Ty
- 10.1. Market Analysis, Insights and Forecast - by Type
- 11. Northeast US Aluminum Beverage Cans Industry Analysis, Insights and Forecast, 2019-2031
- 12. Southeast US Aluminum Beverage Cans Industry Analysis, Insights and Forecast, 2019-2031
- 13. Midwest US Aluminum Beverage Cans Industry Analysis, Insights and Forecast, 2019-2031
- 14. Southwest US Aluminum Beverage Cans Industry Analysis, Insights and Forecast, 2019-2031
- 15. West US Aluminum Beverage Cans Industry Analysis, Insights and Forecast, 2019-2031
- 16. Competitive Analysis
- 16.1. Global Market Share Analysis 2024
- 16.2. Company Profiles
- 16.2.1 Ardagh Group
- 16.2.1.1. Overview
- 16.2.1.2. Products
- 16.2.1.3. SWOT Analysis
- 16.2.1.4. Recent Developments
- 16.2.1.5. Financials (Based on Availability)
- 16.2.2 Ball Corporation
- 16.2.2.1. Overview
- 16.2.2.2. Products
- 16.2.2.3. SWOT Analysis
- 16.2.2.4. Recent Developments
- 16.2.2.5. Financials (Based on Availability)
- 16.2.3 Envases Group*List Not Exhaustive
- 16.2.3.1. Overview
- 16.2.3.2. Products
- 16.2.3.3. SWOT Analysis
- 16.2.3.4. Recent Developments
- 16.2.3.5. Financials (Based on Availability)
- 16.2.4 Crown Holdings Inc
- 16.2.4.1. Overview
- 16.2.4.2. Products
- 16.2.4.3. SWOT Analysis
- 16.2.4.4. Recent Developments
- 16.2.4.5. Financials (Based on Availability)
- 16.2.5 Silgan Holdings
- 16.2.5.1. Overview
- 16.2.5.2. Products
- 16.2.5.3. SWOT Analysis
- 16.2.5.4. Recent Developments
- 16.2.5.5. Financials (Based on Availability)
- 16.2.6 Metal Container Corporation
- 16.2.6.1. Overview
- 16.2.6.2. Products
- 16.2.6.3. SWOT Analysis
- 16.2.6.4. Recent Developments
- 16.2.6.5. Financials (Based on Availability)
- 16.2.1 Ardagh Group
List of Figures
- Figure 1: Global US Aluminum Beverage Cans Industry Revenue Breakdown (Million, %) by Region 2024 & 2032
- Figure 2: United states US Aluminum Beverage Cans Industry Revenue (Million), by Country 2024 & 2032
- Figure 3: United states US Aluminum Beverage Cans Industry Revenue Share (%), by Country 2024 & 2032
- Figure 4: North America US Aluminum Beverage Cans Industry Revenue (Million), by Type 2024 & 2032
- Figure 5: North America US Aluminum Beverage Cans Industry Revenue Share (%), by Type 2024 & 2032
- Figure 6: North America US Aluminum Beverage Cans Industry Revenue (Million), by Application 2024 & 2032
- Figure 7: North America US Aluminum Beverage Cans Industry Revenue Share (%), by Application 2024 & 2032
- Figure 8: North America US Aluminum Beverage Cans Industry Revenue (Million), by Country 2024 & 2032
- Figure 9: North America US Aluminum Beverage Cans Industry Revenue Share (%), by Country 2024 & 2032
- Figure 10: South America US Aluminum Beverage Cans Industry Revenue (Million), by Type 2024 & 2032
- Figure 11: South America US Aluminum Beverage Cans Industry Revenue Share (%), by Type 2024 & 2032
- Figure 12: South America US Aluminum Beverage Cans Industry Revenue (Million), by Application 2024 & 2032
- Figure 13: South America US Aluminum Beverage Cans Industry Revenue Share (%), by Application 2024 & 2032
- Figure 14: South America US Aluminum Beverage Cans Industry Revenue (Million), by Country 2024 & 2032
- Figure 15: South America US Aluminum Beverage Cans Industry Revenue Share (%), by Country 2024 & 2032
- Figure 16: Europe US Aluminum Beverage Cans Industry Revenue (Million), by Type 2024 & 2032
- Figure 17: Europe US Aluminum Beverage Cans Industry Revenue Share (%), by Type 2024 & 2032
- Figure 18: Europe US Aluminum Beverage Cans Industry Revenue (Million), by Application 2024 & 2032
- Figure 19: Europe US Aluminum Beverage Cans Industry Revenue Share (%), by Application 2024 & 2032
- Figure 20: Europe US Aluminum Beverage Cans Industry Revenue (Million), by Country 2024 & 2032
- Figure 21: Europe US Aluminum Beverage Cans Industry Revenue Share (%), by Country 2024 & 2032
- Figure 22: Middle East & Africa US Aluminum Beverage Cans Industry Revenue (Million), by Type 2024 & 2032
- Figure 23: Middle East & Africa US Aluminum Beverage Cans Industry Revenue Share (%), by Type 2024 & 2032
- Figure 24: Middle East & Africa US Aluminum Beverage Cans Industry Revenue (Million), by Application 2024 & 2032
- Figure 25: Middle East & Africa US Aluminum Beverage Cans Industry Revenue Share (%), by Application 2024 & 2032
- Figure 26: Middle East & Africa US Aluminum Beverage Cans Industry Revenue (Million), by Country 2024 & 2032
- Figure 27: Middle East & Africa US Aluminum Beverage Cans Industry Revenue Share (%), by Country 2024 & 2032
- Figure 28: Asia Pacific US Aluminum Beverage Cans Industry Revenue (Million), by Type 2024 & 2032
- Figure 29: Asia Pacific US Aluminum Beverage Cans Industry Revenue Share (%), by Type 2024 & 2032
- Figure 30: Asia Pacific US Aluminum Beverage Cans Industry Revenue (Million), by Application 2024 & 2032
- Figure 31: Asia Pacific US Aluminum Beverage Cans Industry Revenue Share (%), by Application 2024 & 2032
- Figure 32: Asia Pacific US Aluminum Beverage Cans Industry Revenue (Million), by Country 2024 & 2032
- Figure 33: Asia Pacific US Aluminum Beverage Cans Industry Revenue Share (%), by Country 2024 & 2032
List of Tables
- Table 1: Global US Aluminum Beverage Cans Industry Revenue Million Forecast, by Region 2019 & 2032
- Table 2: Global US Aluminum Beverage Cans Industry Revenue Million Forecast, by Type 2019 & 2032
- Table 3: Global US Aluminum Beverage Cans Industry Revenue Million Forecast, by Application 2019 & 2032
- Table 4: Global US Aluminum Beverage Cans Industry Revenue Million Forecast, by Region 2019 & 2032
- Table 5: Global US Aluminum Beverage Cans Industry Revenue Million Forecast, by Country 2019 & 2032
- Table 6: Northeast US Aluminum Beverage Cans Industry Revenue (Million) Forecast, by Application 2019 & 2032
- Table 7: Southeast US Aluminum Beverage Cans Industry Revenue (Million) Forecast, by Application 2019 & 2032
- Table 8: Midwest US Aluminum Beverage Cans Industry Revenue (Million) Forecast, by Application 2019 & 2032
- Table 9: Southwest US Aluminum Beverage Cans Industry Revenue (Million) Forecast, by Application 2019 & 2032
- Table 10: West US Aluminum Beverage Cans Industry Revenue (Million) Forecast, by Application 2019 & 2032
- Table 11: Global US Aluminum Beverage Cans Industry Revenue Million Forecast, by Type 2019 & 2032
- Table 12: Global US Aluminum Beverage Cans Industry Revenue Million Forecast, by Application 2019 & 2032
- Table 13: Global US Aluminum Beverage Cans Industry Revenue Million Forecast, by Country 2019 & 2032
- Table 14: United States US Aluminum Beverage Cans Industry Revenue (Million) Forecast, by Application 2019 & 2032
- Table 15: Canada US Aluminum Beverage Cans Industry Revenue (Million) Forecast, by Application 2019 & 2032
- Table 16: Mexico US Aluminum Beverage Cans Industry Revenue (Million) Forecast, by Application 2019 & 2032
- Table 17: Global US Aluminum Beverage Cans Industry Revenue Million Forecast, by Type 2019 & 2032
- Table 18: Global US Aluminum Beverage Cans Industry Revenue Million Forecast, by Application 2019 & 2032
- Table 19: Global US Aluminum Beverage Cans Industry Revenue Million Forecast, by Country 2019 & 2032
- Table 20: Brazil US Aluminum Beverage Cans Industry Revenue (Million) Forecast, by Application 2019 & 2032
- Table 21: Argentina US Aluminum Beverage Cans Industry Revenue (Million) Forecast, by Application 2019 & 2032
- Table 22: Rest of South America US Aluminum Beverage Cans Industry Revenue (Million) Forecast, by Application 2019 & 2032
- Table 23: Global US Aluminum Beverage Cans Industry Revenue Million Forecast, by Type 2019 & 2032
- Table 24: Global US Aluminum Beverage Cans Industry Revenue Million Forecast, by Application 2019 & 2032
- Table 25: Global US Aluminum Beverage Cans Industry Revenue Million Forecast, by Country 2019 & 2032
- Table 26: United Kingdom US Aluminum Beverage Cans Industry Revenue (Million) Forecast, by Application 2019 & 2032
- Table 27: Germany US Aluminum Beverage Cans Industry Revenue (Million) Forecast, by Application 2019 & 2032
- Table 28: France US Aluminum Beverage Cans Industry Revenue (Million) Forecast, by Application 2019 & 2032
- Table 29: Italy US Aluminum Beverage Cans Industry Revenue (Million) Forecast, by Application 2019 & 2032
- Table 30: Spain US Aluminum Beverage Cans Industry Revenue (Million) Forecast, by Application 2019 & 2032
- Table 31: Russia US Aluminum Beverage Cans Industry Revenue (Million) Forecast, by Application 2019 & 2032
- Table 32: Benelux US Aluminum Beverage Cans Industry Revenue (Million) Forecast, by Application 2019 & 2032
- Table 33: Nordics US Aluminum Beverage Cans Industry Revenue (Million) Forecast, by Application 2019 & 2032
- Table 34: Rest of Europe US Aluminum Beverage Cans Industry Revenue (Million) Forecast, by Application 2019 & 2032
- Table 35: Global US Aluminum Beverage Cans Industry Revenue Million Forecast, by Type 2019 & 2032
- Table 36: Global US Aluminum Beverage Cans Industry Revenue Million Forecast, by Application 2019 & 2032
- Table 37: Global US Aluminum Beverage Cans Industry Revenue Million Forecast, by Country 2019 & 2032
- Table 38: Turkey US Aluminum Beverage Cans Industry Revenue (Million) Forecast, by Application 2019 & 2032
- Table 39: Israel US Aluminum Beverage Cans Industry Revenue (Million) Forecast, by Application 2019 & 2032
- Table 40: GCC US Aluminum Beverage Cans Industry Revenue (Million) Forecast, by Application 2019 & 2032
- Table 41: North Africa US Aluminum Beverage Cans Industry Revenue (Million) Forecast, by Application 2019 & 2032
- Table 42: South Africa US Aluminum Beverage Cans Industry Revenue (Million) Forecast, by Application 2019 & 2032
- Table 43: Rest of Middle East & Africa US Aluminum Beverage Cans Industry Revenue (Million) Forecast, by Application 2019 & 2032
- Table 44: Global US Aluminum Beverage Cans Industry Revenue Million Forecast, by Type 2019 & 2032
- Table 45: Global US Aluminum Beverage Cans Industry Revenue Million Forecast, by Application 2019 & 2032
- Table 46: Global US Aluminum Beverage Cans Industry Revenue Million Forecast, by Country 2019 & 2032
- Table 47: China US Aluminum Beverage Cans Industry Revenue (Million) Forecast, by Application 2019 & 2032
- Table 48: India US Aluminum Beverage Cans Industry Revenue (Million) Forecast, by Application 2019 & 2032
- Table 49: Japan US Aluminum Beverage Cans Industry Revenue (Million) Forecast, by Application 2019 & 2032
- Table 50: South Korea US Aluminum Beverage Cans Industry Revenue (Million) Forecast, by Application 2019 & 2032
- Table 51: ASEAN US Aluminum Beverage Cans Industry Revenue (Million) Forecast, by Application 2019 & 2032
- Table 52: Oceania US Aluminum Beverage Cans Industry Revenue (Million) Forecast, by Application 2019 & 2032
- Table 53: Rest of Asia Pacific US Aluminum Beverage Cans Industry Revenue (Million) Forecast, by Application 2019 & 2032
Frequently Asked Questions
1. What is the projected Compound Annual Growth Rate (CAGR) of the US Aluminum Beverage Cans Industry?
The projected CAGR is approximately 3.00%.
2. Which companies are prominent players in the US Aluminum Beverage Cans Industry?
Key companies in the market include Ardagh Group, Ball Corporation, Envases Group*List Not Exhaustive, Crown Holdings Inc, Silgan Holdings, Metal Container Corporation.
3. What are the main segments of the US Aluminum Beverage Cans Industry?
The market segments include Type, Application.
4. Can you provide details about the market size?
The market size is estimated to be USD XX Million as of 2022.
5. What are some drivers contributing to market growth?
Growing demand from the Non-Alcoholic Beverage sector; High Recyclability Rates of Metal Packaging.
6. What are the notable trends driving market growth?
High Recyclability Rates of Metal Packaging is Expected to Drive the Market Growth.
7. Are there any restraints impacting market growth?
Availability Of Alernative Packaging Solutions; Food Stored In Metallic Cans Cause Severe Health Issues.
8. Can you provide examples of recent developments in the market?
August 2020 - Crown Holdings Inc. announced an initiative called Twentyby30, which the company calls 'a robust program that outlines 20 measurable environmental, social and governance (ESG) goals to be completed by 2030 or sooner. The maker of steel and aluminum cans and other forms of packaging has deviced the 20 goals into five categories, one of which is called Optimum Circularity and addresses the use of recycled content and the recycling of discarded packaging.
9. What pricing options are available for accessing the report?
Pricing options include single-user, multi-user, and enterprise licenses priced at USD 3800, USD 4500, and USD 5800 respectively.
10. Is the market size provided in terms of value or volume?
The market size is provided in terms of value, measured in Million.
11. Are there any specific market keywords associated with the report?
Yes, the market keyword associated with the report is "US Aluminum Beverage Cans Industry," which aids in identifying and referencing the specific market segment covered.
12. How do I determine which pricing option suits my needs best?
The pricing options vary based on user requirements and access needs. Individual users may opt for single-user licenses, while businesses requiring broader access may choose multi-user or enterprise licenses for cost-effective access to the report.
13. Are there any additional resources or data provided in the US Aluminum Beverage Cans Industry report?
While the report offers comprehensive insights, it's advisable to review the specific contents or supplementary materials provided to ascertain if additional resources or data are available.
14. How can I stay updated on further developments or reports in the US Aluminum Beverage Cans Industry?
To stay informed about further developments, trends, and reports in the US Aluminum Beverage Cans Industry, consider subscribing to industry newsletters, following relevant companies and organizations, or regularly checking reputable industry news sources and publications.
Methodology
Step 1 - Identification of Relevant Samples Size from Population Database


Step 2 - Approaches for Defining Global Market Size (Value, Volume* & Price*)

Note*: In applicable scenarios
Step 3 - Data Sources
Primary Research
- Web Analytics
- Survey Reports
- Research Institute
- Latest Research Reports
- Opinion Leaders
Secondary Research
- Annual Reports
- White Paper
- Latest Press Release
- Industry Association
- Paid Database
- Investor Presentations

Step 4 - Data Triangulation
Involves using different sources of information in order to increase the validity of a study
These sources are likely to be stakeholders in a program - participants, other researchers, program staff, other community members, and so on.
Then we put all data in single framework & apply various statistical tools to find out the dynamic on the market.
During the analysis stage, feedback from the stakeholder groups would be compared to determine areas of agreement as well as areas of divergence
