

Key Insights
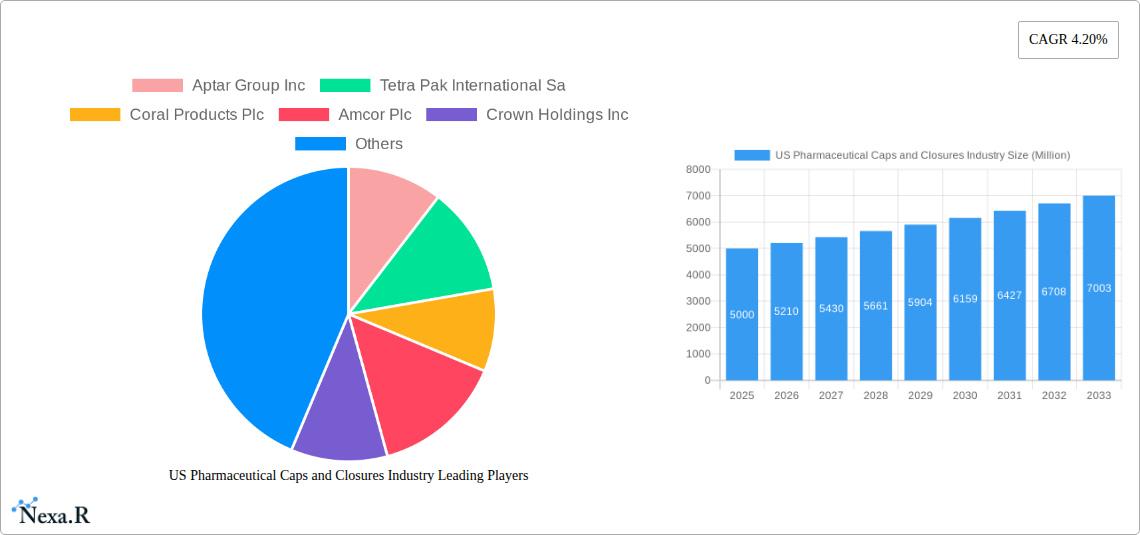
The US pharmaceutical caps and closures market, a critical component of drug packaging and safety, is experiencing robust growth. Driven by increasing pharmaceutical production, stringent regulatory requirements demanding tamper-evident and child-resistant closures, and a growing focus on product integrity and patient safety, the market is projected to maintain a steady expansion. The market's segmentation reflects diverse needs: plastic remains the dominant material due to its cost-effectiveness and versatility, though other materials like metal are used for specialized applications offering superior barrier properties or tamper-evidence features. The pharmaceutical and healthcare end-user segment constitutes a significant portion of the market, with substantial demand for closures ensuring drug efficacy and preventing contamination. Beverage applications, particularly bottled water and other drinks, constitute a significant secondary market, however, this analysis focuses on the pharmaceutical sector. Key players like Aptar Group, Amcor, and Berry Global are leading the innovation in this space, constantly developing advanced closure technologies to meet evolving industry demands. This includes innovations in materials science for improved barrier properties, enhanced child-resistant mechanisms, and integration of technologies for traceability and anti-counterfeiting measures.
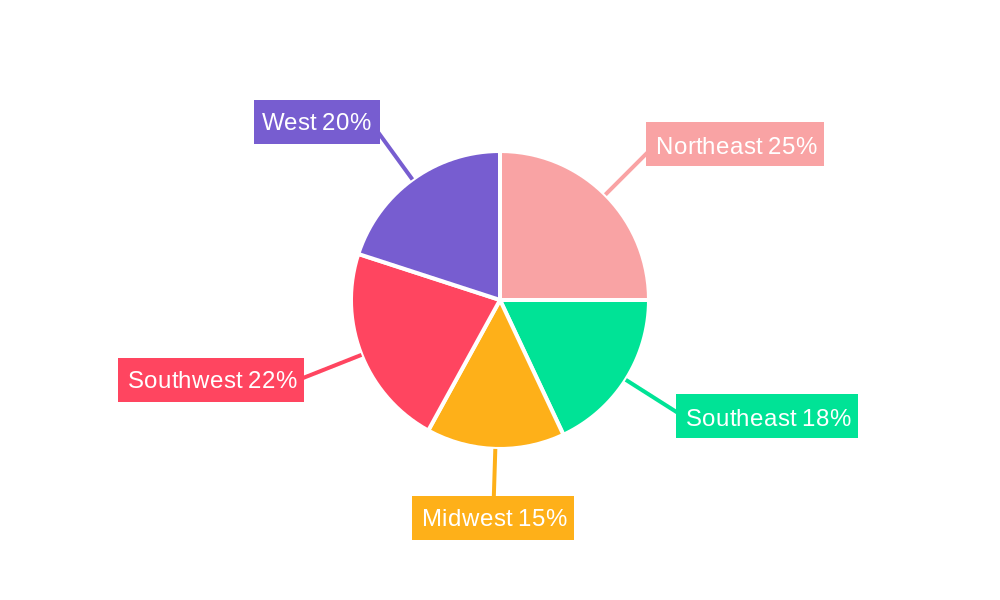
Competition is intense, with established players constantly striving for innovation and market share. The forecast period (2025-2033) suggests continued growth, fueled by technological advancements, increasing prescription drug usage, and an expanding aging population requiring more medications. However, potential restraints include fluctuating raw material costs and the need for continuous regulatory compliance. The Northeast and West regions of the US likely hold the largest market share due to higher concentrations of pharmaceutical manufacturing and distribution hubs. Strategic acquisitions, technological advancements, and expanding product portfolios are key strategies employed by major market players to maintain their competitive edge in this dynamic landscape. The ongoing focus on sustainable packaging solutions and environmentally friendly materials will also shape future market trends.
US Pharmaceutical Caps and Closures Industry Market Report: 2019-2033
This comprehensive report provides a detailed analysis of the US Pharmaceutical Caps and Closures market, offering invaluable insights for industry professionals, investors, and strategic decision-makers. The study covers the period from 2019 to 2033, with 2025 serving as the base year. We delve into market dynamics, growth trends, dominant segments, and key players, equipping you with the knowledge to navigate this dynamic sector.
US Pharmaceutical Caps and Closures Industry Market Dynamics & Structure
The US pharmaceutical caps and closures market is characterized by moderate concentration, with several major players holding significant market share. Technological innovation, driven by the need for improved tamper evidence, child-resistance, and ease of use, is a key driver. Stringent regulatory frameworks, including FDA compliance, shape manufacturing and material choices. Competition from substitute materials and packaging technologies exerts pressure on prices and innovation. The end-user demographic is largely driven by the pharmaceutical and healthcare sector, with demand influenced by prescription drug trends and population health. Recent years have witnessed a moderate level of M&A activity, with larger companies strategically acquiring smaller firms to expand their product portfolio and market reach.
- Market Concentration: Moderately concentrated, with top 5 players holding approximately xx% market share in 2025.
- Technological Innovation: Focus on tamper-evident, child-resistant, and sustainable closures.
- Regulatory Framework: Stringent FDA regulations drive compliance and material selection.
- Competitive Substitutes: Growing competition from alternative packaging materials and designs.
- M&A Activity: Moderate level of mergers and acquisitions, driven by expansion and diversification strategies (xx deals between 2019-2024).
US Pharmaceutical Caps and Closures Industry Growth Trends & Insights
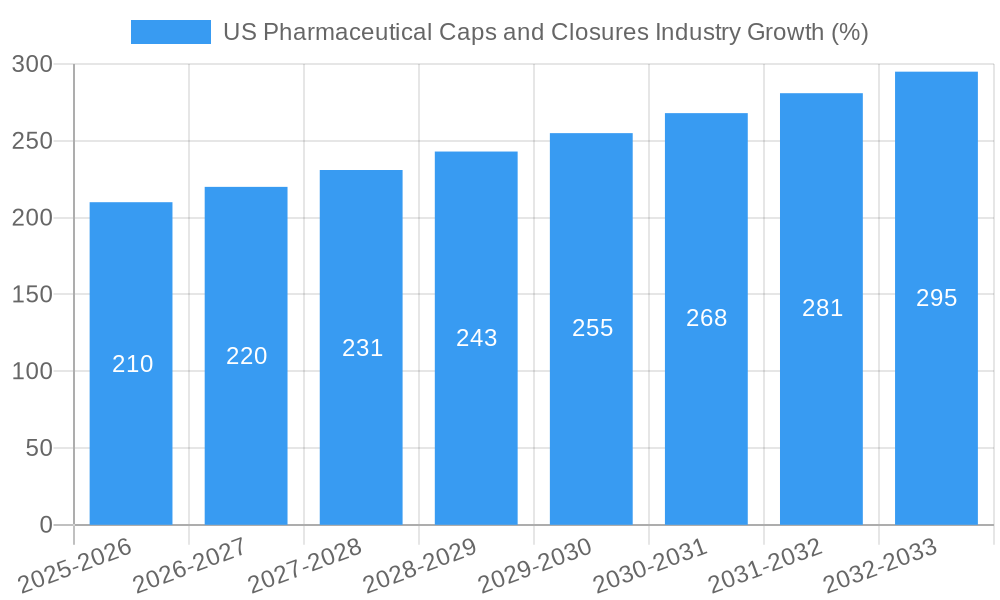
The US pharmaceutical caps and closures market experienced steady growth between 2019 and 2024, driven by factors such as the increasing demand for pharmaceutical products, rising healthcare expenditure, and the growing adoption of innovative packaging solutions. The market is expected to continue this growth trajectory, with a projected Compound Annual Growth Rate (CAGR) of xx% from 2025 to 2033. This growth is fueled by advancements in materials science, leading to enhanced barrier properties and improved tamper-evident features. Furthermore, increased consumer awareness of medication safety and the rising prevalence of chronic diseases are contributing to the market's expansion. Market penetration of innovative closures, such as those incorporating smart technologies for track and trace capabilities, remains relatively low but is expected to accelerate in the coming years.
Dominant Regions, Countries, or Segments in US Pharmaceutical Caps and Closures Industry
The pharmaceutical and healthcare segment constitutes the largest end-user industry for caps and closures in the US, significantly driving market growth. Within material types, plastic dominates due to its cost-effectiveness and versatility. Specific growth drivers vary across segments. For instance, the pharmaceutical segment is fueled by the rise in chronic diseases and increased prescription drug usage. The plastic segment benefits from its adaptability to diverse closure designs and cost-effectiveness. Geographic dominance is largely concentrated in regions with high pharmaceutical manufacturing and consumption.
- By Material Type: Plastic (xx Million units) dominates, followed by Metal (xx Million units) and Other Materials (xx Million units).
- By End-User Industry: Pharmaceutical and Healthcare (xx Million units) is the leading segment, followed by Food (xx Million units) and Cosmetics and Toiletries (xx Million units).
- Geographic Dominance: Concentrated in states with large pharmaceutical manufacturing hubs.
US Pharmaceutical Caps and Closures Industry Product Landscape
The US pharmaceutical caps and closures market showcases a diverse range of products, catering to various pharmaceutical packaging needs. Innovation centers around improved tamper evidence, child-resistant designs, and sustainable materials. Key features include enhanced barrier properties to protect medication integrity, precise dispensing mechanisms, and incorporation of serialization technologies for product tracking and authentication. The competitive landscape is marked by ongoing efforts to improve product performance, reduce environmental impact, and enhance convenience for patients.
Key Drivers, Barriers & Challenges in US Pharmaceutical Caps and Closures Industry
Key Drivers:
- Growing demand for pharmaceutical products.
- Increasing healthcare expenditure.
- Technological advancements in closure designs.
- Stringent regulatory requirements pushing for safer and more secure packaging.
Key Challenges and Restraints:
- Fluctuating raw material prices impacting profitability.
- Intense competition among manufacturers.
- Stringent regulatory compliance requirements leading to high costs.
- Supply chain disruptions, potentially affecting material availability and production timelines.
Emerging Opportunities in US Pharmaceutical Caps and Closures Industry
Emerging opportunities lie in developing sustainable and eco-friendly closures made from recycled materials, integrating smart packaging technologies for enhanced drug traceability and security, and expanding into niche markets such as personalized medicine packaging. There's also potential in the development of innovative dispensing mechanisms that cater to specific patient needs and improve medication adherence. Furthermore, exploring partnerships with pharmaceutical companies for co-development of innovative closure solutions could unlock new revenue streams.
Growth Accelerators in the US Pharmaceutical Caps and Closures Industry Industry
Long-term growth will be accelerated by technological breakthroughs in materials science, leading to more effective barrier properties and sustainable packaging options. Strategic partnerships between closure manufacturers and pharmaceutical companies will foster innovation and accelerate market penetration. Expansion into emerging markets and increasing focus on personalized medicine packaging will further boost market growth.
Key Players Shaping the US Pharmaceutical Caps and Closures Market
- Aptar Group Inc
- Tetra Pak International Sa
- Coral Products Plc
- Amcor Plc
- Crown Holdings Inc
- O Berk Company Llc
- Bericap Holdings
- Silgan Closures
- MJS Packaging
- Albéa S A
- Berry Global Inc
- Closure Systems International
Notable Milestones in US Pharmaceutical Caps and Closures Industry Sector
- 2020: Increased adoption of tamper-evident closures due to heightened consumer safety concerns.
- 2021: Several key players invested heavily in R&D for sustainable packaging solutions.
- 2022: Launch of innovative closures with integrated serialization features for enhanced track and trace capabilities.
- 2023: A significant merger between two major players reshaped the competitive landscape.
In-Depth US Pharmaceutical Caps and Closures Industry Market Outlook
The US pharmaceutical caps and closures market exhibits strong future potential, driven by several factors including continued growth in the pharmaceutical industry, increasing demand for safer and more secure packaging, and the rising adoption of innovative closure technologies. Strategic opportunities lie in developing sustainable and cost-effective solutions, exploring new dispensing mechanisms, and capitalizing on the growing demand for personalized medicine packaging. Companies focusing on innovation and strategic partnerships are well-positioned to capture significant market share in the coming years.
US Pharmaceutical Caps and Closures Industry Segmentation
-
1. Material Type
-
1.1. Plastic
- 1.1.1. PET
- 1.1.2. PP
- 1.1.3. HDPE and LDPE
- 1.1.4. Other Plastics
- 1.2. Metal
- 1.3. Other Material Types
-
1.1. Plastic
-
2. End-User Industry
- 2.1. Beverage
- 2.2. Food
- 2.3. Pharmaceutical and Healthcare
- 2.4. Cosmetics and Toiletries
- 2.5. Other En
US Pharmaceutical Caps and Closures Industry Segmentation By Geography
-
1. North America
- 1.1. United States
- 1.2. Canada
- 1.3. Mexico
-
2. South America
- 2.1. Brazil
- 2.2. Argentina
- 2.3. Rest of South America
-
3. Europe
- 3.1. United Kingdom
- 3.2. Germany
- 3.3. France
- 3.4. Italy
- 3.5. Spain
- 3.6. Russia
- 3.7. Benelux
- 3.8. Nordics
- 3.9. Rest of Europe
-
4. Middle East & Africa
- 4.1. Turkey
- 4.2. Israel
- 4.3. GCC
- 4.4. North Africa
- 4.5. South Africa
- 4.6. Rest of Middle East & Africa
-
5. Asia Pacific
- 5.1. China
- 5.2. India
- 5.3. Japan
- 5.4. South Korea
- 5.5. ASEAN
- 5.6. Oceania
- 5.7. Rest of Asia Pacific
US Pharmaceutical Caps and Closures Industry REPORT HIGHLIGHTS
| Aspects | Details |
|---|---|
| Study Period | 2019-2033 |
| Base Year | 2024 |
| Estimated Year | 2025 |
| Forecast Period | 2025-2033 |
| Historical Period | 2019-2024 |
| Growth Rate | CAGR of 4.20% from 2019-2033 |
| Segmentation |
|
Table of Contents
- 1. Introduction
- 1.1. Research Scope
- 1.2. Market Segmentation
- 1.3. Research Methodology
- 1.4. Definitions and Assumptions
- 2. Executive Summary
- 2.1. Introduction
- 3. Market Dynamics
- 3.1. Introduction
- 3.2. Market Drivers
- 3.2.1. ; The Increased Demand for Innovative Solutions from Different End Users.
- 3.3. Market Restrains
- 3.3.1. ; Stringent Regulation on Manufacturers Pertaining to Environmental Degradation
- 3.4. Market Trends
- 3.4.1. Plastic to Witness a Highest Growth
- 4. Market Factor Analysis
- 4.1. Porters Five Forces
- 4.2. Supply/Value Chain
- 4.3. PESTEL analysis
- 4.4. Market Entropy
- 4.5. Patent/Trademark Analysis
- 5. Global US Pharmaceutical Caps and Closures Industry Analysis, Insights and Forecast, 2019-2031
- 5.1. Market Analysis, Insights and Forecast - by Material Type
- 5.1.1. Plastic
- 5.1.1.1. PET
- 5.1.1.2. PP
- 5.1.1.3. HDPE and LDPE
- 5.1.1.4. Other Plastics
- 5.1.2. Metal
- 5.1.3. Other Material Types
- 5.1.1. Plastic
- 5.2. Market Analysis, Insights and Forecast - by End-User Industry
- 5.2.1. Beverage
- 5.2.2. Food
- 5.2.3. Pharmaceutical and Healthcare
- 5.2.4. Cosmetics and Toiletries
- 5.2.5. Other En
- 5.3. Market Analysis, Insights and Forecast - by Region
- 5.3.1. North America
- 5.3.2. South America
- 5.3.3. Europe
- 5.3.4. Middle East & Africa
- 5.3.5. Asia Pacific
- 5.1. Market Analysis, Insights and Forecast - by Material Type
- 6. North America US Pharmaceutical Caps and Closures Industry Analysis, Insights and Forecast, 2019-2031
- 6.1. Market Analysis, Insights and Forecast - by Material Type
- 6.1.1. Plastic
- 6.1.1.1. PET
- 6.1.1.2. PP
- 6.1.1.3. HDPE and LDPE
- 6.1.1.4. Other Plastics
- 6.1.2. Metal
- 6.1.3. Other Material Types
- 6.1.1. Plastic
- 6.2. Market Analysis, Insights and Forecast - by End-User Industry
- 6.2.1. Beverage
- 6.2.2. Food
- 6.2.3. Pharmaceutical and Healthcare
- 6.2.4. Cosmetics and Toiletries
- 6.2.5. Other En
- 6.1. Market Analysis, Insights and Forecast - by Material Type
- 7. South America US Pharmaceutical Caps and Closures Industry Analysis, Insights and Forecast, 2019-2031
- 7.1. Market Analysis, Insights and Forecast - by Material Type
- 7.1.1. Plastic
- 7.1.1.1. PET
- 7.1.1.2. PP
- 7.1.1.3. HDPE and LDPE
- 7.1.1.4. Other Plastics
- 7.1.2. Metal
- 7.1.3. Other Material Types
- 7.1.1. Plastic
- 7.2. Market Analysis, Insights and Forecast - by End-User Industry
- 7.2.1. Beverage
- 7.2.2. Food
- 7.2.3. Pharmaceutical and Healthcare
- 7.2.4. Cosmetics and Toiletries
- 7.2.5. Other En
- 7.1. Market Analysis, Insights and Forecast - by Material Type
- 8. Europe US Pharmaceutical Caps and Closures Industry Analysis, Insights and Forecast, 2019-2031
- 8.1. Market Analysis, Insights and Forecast - by Material Type
- 8.1.1. Plastic
- 8.1.1.1. PET
- 8.1.1.2. PP
- 8.1.1.3. HDPE and LDPE
- 8.1.1.4. Other Plastics
- 8.1.2. Metal
- 8.1.3. Other Material Types
- 8.1.1. Plastic
- 8.2. Market Analysis, Insights and Forecast - by End-User Industry
- 8.2.1. Beverage
- 8.2.2. Food
- 8.2.3. Pharmaceutical and Healthcare
- 8.2.4. Cosmetics and Toiletries
- 8.2.5. Other En
- 8.1. Market Analysis, Insights and Forecast - by Material Type
- 9. Middle East & Africa US Pharmaceutical Caps and Closures Industry Analysis, Insights and Forecast, 2019-2031
- 9.1. Market Analysis, Insights and Forecast - by Material Type
- 9.1.1. Plastic
- 9.1.1.1. PET
- 9.1.1.2. PP
- 9.1.1.3. HDPE and LDPE
- 9.1.1.4. Other Plastics
- 9.1.2. Metal
- 9.1.3. Other Material Types
- 9.1.1. Plastic
- 9.2. Market Analysis, Insights and Forecast - by End-User Industry
- 9.2.1. Beverage
- 9.2.2. Food
- 9.2.3. Pharmaceutical and Healthcare
- 9.2.4. Cosmetics and Toiletries
- 9.2.5. Other En
- 9.1. Market Analysis, Insights and Forecast - by Material Type
- 10. Asia Pacific US Pharmaceutical Caps and Closures Industry Analysis, Insights and Forecast, 2019-2031
- 10.1. Market Analysis, Insights and Forecast - by Material Type
- 10.1.1. Plastic
- 10.1.1.1. PET
- 10.1.1.2. PP
- 10.1.1.3. HDPE and LDPE
- 10.1.1.4. Other Plastics
- 10.1.2. Metal
- 10.1.3. Other Material Types
- 10.1.1. Plastic
- 10.2. Market Analysis, Insights and Forecast - by End-User Industry
- 10.2.1. Beverage
- 10.2.2. Food
- 10.2.3. Pharmaceutical and Healthcare
- 10.2.4. Cosmetics and Toiletries
- 10.2.5. Other En
- 10.1. Market Analysis, Insights and Forecast - by Material Type
- 11. Northeast US Pharmaceutical Caps and Closures Industry Analysis, Insights and Forecast, 2019-2031
- 12. Southeast US Pharmaceutical Caps and Closures Industry Analysis, Insights and Forecast, 2019-2031
- 13. Midwest US Pharmaceutical Caps and Closures Industry Analysis, Insights and Forecast, 2019-2031
- 14. Southwest US Pharmaceutical Caps and Closures Industry Analysis, Insights and Forecast, 2019-2031
- 15. West US Pharmaceutical Caps and Closures Industry Analysis, Insights and Forecast, 2019-2031
- 16. Competitive Analysis
- 16.1. Global Market Share Analysis 2024
- 16.2. Company Profiles
- 16.2.1 Aptar Group Inc
- 16.2.1.1. Overview
- 16.2.1.2. Products
- 16.2.1.3. SWOT Analysis
- 16.2.1.4. Recent Developments
- 16.2.1.5. Financials (Based on Availability)
- 16.2.2 Tetra Pak International Sa
- 16.2.2.1. Overview
- 16.2.2.2. Products
- 16.2.2.3. SWOT Analysis
- 16.2.2.4. Recent Developments
- 16.2.2.5. Financials (Based on Availability)
- 16.2.3 Coral Products Plc
- 16.2.3.1. Overview
- 16.2.3.2. Products
- 16.2.3.3. SWOT Analysis
- 16.2.3.4. Recent Developments
- 16.2.3.5. Financials (Based on Availability)
- 16.2.4 Amcor Plc
- 16.2.4.1. Overview
- 16.2.4.2. Products
- 16.2.4.3. SWOT Analysis
- 16.2.4.4. Recent Developments
- 16.2.4.5. Financials (Based on Availability)
- 16.2.5 Crown Holdings Inc
- 16.2.5.1. Overview
- 16.2.5.2. Products
- 16.2.5.3. SWOT Analysis
- 16.2.5.4. Recent Developments
- 16.2.5.5. Financials (Based on Availability)
- 16.2.6 O Berk Company Llc*List Not Exhaustive
- 16.2.6.1. Overview
- 16.2.6.2. Products
- 16.2.6.3. SWOT Analysis
- 16.2.6.4. Recent Developments
- 16.2.6.5. Financials (Based on Availability)
- 16.2.7 Bericap Holdings
- 16.2.7.1. Overview
- 16.2.7.2. Products
- 16.2.7.3. SWOT Analysis
- 16.2.7.4. Recent Developments
- 16.2.7.5. Financials (Based on Availability)
- 16.2.8 Silgan Closures
- 16.2.8.1. Overview
- 16.2.8.2. Products
- 16.2.8.3. SWOT Analysis
- 16.2.8.4. Recent Developments
- 16.2.8.5. Financials (Based on Availability)
- 16.2.9 Mjs Packaging
- 16.2.9.1. Overview
- 16.2.9.2. Products
- 16.2.9.3. SWOT Analysis
- 16.2.9.4. Recent Developments
- 16.2.9.5. Financials (Based on Availability)
- 16.2.10 Albéa S A
- 16.2.10.1. Overview
- 16.2.10.2. Products
- 16.2.10.3. SWOT Analysis
- 16.2.10.4. Recent Developments
- 16.2.10.5. Financials (Based on Availability)
- 16.2.11 Berry Global Inc
- 16.2.11.1. Overview
- 16.2.11.2. Products
- 16.2.11.3. SWOT Analysis
- 16.2.11.4. Recent Developments
- 16.2.11.5. Financials (Based on Availability)
- 16.2.12 Closure Systems International
- 16.2.12.1. Overview
- 16.2.12.2. Products
- 16.2.12.3. SWOT Analysis
- 16.2.12.4. Recent Developments
- 16.2.12.5. Financials (Based on Availability)
- 16.2.1 Aptar Group Inc
List of Figures
- Figure 1: Global US Pharmaceutical Caps and Closures Industry Revenue Breakdown (Million, %) by Region 2024 & 2032
- Figure 2: United states US Pharmaceutical Caps and Closures Industry Revenue (Million), by Country 2024 & 2032
- Figure 3: United states US Pharmaceutical Caps and Closures Industry Revenue Share (%), by Country 2024 & 2032
- Figure 4: North America US Pharmaceutical Caps and Closures Industry Revenue (Million), by Material Type 2024 & 2032
- Figure 5: North America US Pharmaceutical Caps and Closures Industry Revenue Share (%), by Material Type 2024 & 2032
- Figure 6: North America US Pharmaceutical Caps and Closures Industry Revenue (Million), by End-User Industry 2024 & 2032
- Figure 7: North America US Pharmaceutical Caps and Closures Industry Revenue Share (%), by End-User Industry 2024 & 2032
- Figure 8: North America US Pharmaceutical Caps and Closures Industry Revenue (Million), by Country 2024 & 2032
- Figure 9: North America US Pharmaceutical Caps and Closures Industry Revenue Share (%), by Country 2024 & 2032
- Figure 10: South America US Pharmaceutical Caps and Closures Industry Revenue (Million), by Material Type 2024 & 2032
- Figure 11: South America US Pharmaceutical Caps and Closures Industry Revenue Share (%), by Material Type 2024 & 2032
- Figure 12: South America US Pharmaceutical Caps and Closures Industry Revenue (Million), by End-User Industry 2024 & 2032
- Figure 13: South America US Pharmaceutical Caps and Closures Industry Revenue Share (%), by End-User Industry 2024 & 2032
- Figure 14: South America US Pharmaceutical Caps and Closures Industry Revenue (Million), by Country 2024 & 2032
- Figure 15: South America US Pharmaceutical Caps and Closures Industry Revenue Share (%), by Country 2024 & 2032
- Figure 16: Europe US Pharmaceutical Caps and Closures Industry Revenue (Million), by Material Type 2024 & 2032
- Figure 17: Europe US Pharmaceutical Caps and Closures Industry Revenue Share (%), by Material Type 2024 & 2032
- Figure 18: Europe US Pharmaceutical Caps and Closures Industry Revenue (Million), by End-User Industry 2024 & 2032
- Figure 19: Europe US Pharmaceutical Caps and Closures Industry Revenue Share (%), by End-User Industry 2024 & 2032
- Figure 20: Europe US Pharmaceutical Caps and Closures Industry Revenue (Million), by Country 2024 & 2032
- Figure 21: Europe US Pharmaceutical Caps and Closures Industry Revenue Share (%), by Country 2024 & 2032
- Figure 22: Middle East & Africa US Pharmaceutical Caps and Closures Industry Revenue (Million), by Material Type 2024 & 2032
- Figure 23: Middle East & Africa US Pharmaceutical Caps and Closures Industry Revenue Share (%), by Material Type 2024 & 2032
- Figure 24: Middle East & Africa US Pharmaceutical Caps and Closures Industry Revenue (Million), by End-User Industry 2024 & 2032
- Figure 25: Middle East & Africa US Pharmaceutical Caps and Closures Industry Revenue Share (%), by End-User Industry 2024 & 2032
- Figure 26: Middle East & Africa US Pharmaceutical Caps and Closures Industry Revenue (Million), by Country 2024 & 2032
- Figure 27: Middle East & Africa US Pharmaceutical Caps and Closures Industry Revenue Share (%), by Country 2024 & 2032
- Figure 28: Asia Pacific US Pharmaceutical Caps and Closures Industry Revenue (Million), by Material Type 2024 & 2032
- Figure 29: Asia Pacific US Pharmaceutical Caps and Closures Industry Revenue Share (%), by Material Type 2024 & 2032
- Figure 30: Asia Pacific US Pharmaceutical Caps and Closures Industry Revenue (Million), by End-User Industry 2024 & 2032
- Figure 31: Asia Pacific US Pharmaceutical Caps and Closures Industry Revenue Share (%), by End-User Industry 2024 & 2032
- Figure 32: Asia Pacific US Pharmaceutical Caps and Closures Industry Revenue (Million), by Country 2024 & 2032
- Figure 33: Asia Pacific US Pharmaceutical Caps and Closures Industry Revenue Share (%), by Country 2024 & 2032
List of Tables
- Table 1: Global US Pharmaceutical Caps and Closures Industry Revenue Million Forecast, by Region 2019 & 2032
- Table 2: Global US Pharmaceutical Caps and Closures Industry Revenue Million Forecast, by Material Type 2019 & 2032
- Table 3: Global US Pharmaceutical Caps and Closures Industry Revenue Million Forecast, by End-User Industry 2019 & 2032
- Table 4: Global US Pharmaceutical Caps and Closures Industry Revenue Million Forecast, by Region 2019 & 2032
- Table 5: Global US Pharmaceutical Caps and Closures Industry Revenue Million Forecast, by Country 2019 & 2032
- Table 6: Northeast US Pharmaceutical Caps and Closures Industry Revenue (Million) Forecast, by Application 2019 & 2032
- Table 7: Southeast US Pharmaceutical Caps and Closures Industry Revenue (Million) Forecast, by Application 2019 & 2032
- Table 8: Midwest US Pharmaceutical Caps and Closures Industry Revenue (Million) Forecast, by Application 2019 & 2032
- Table 9: Southwest US Pharmaceutical Caps and Closures Industry Revenue (Million) Forecast, by Application 2019 & 2032
- Table 10: West US Pharmaceutical Caps and Closures Industry Revenue (Million) Forecast, by Application 2019 & 2032
- Table 11: Global US Pharmaceutical Caps and Closures Industry Revenue Million Forecast, by Material Type 2019 & 2032
- Table 12: Global US Pharmaceutical Caps and Closures Industry Revenue Million Forecast, by End-User Industry 2019 & 2032
- Table 13: Global US Pharmaceutical Caps and Closures Industry Revenue Million Forecast, by Country 2019 & 2032
- Table 14: United States US Pharmaceutical Caps and Closures Industry Revenue (Million) Forecast, by Application 2019 & 2032
- Table 15: Canada US Pharmaceutical Caps and Closures Industry Revenue (Million) Forecast, by Application 2019 & 2032
- Table 16: Mexico US Pharmaceutical Caps and Closures Industry Revenue (Million) Forecast, by Application 2019 & 2032
- Table 17: Global US Pharmaceutical Caps and Closures Industry Revenue Million Forecast, by Material Type 2019 & 2032
- Table 18: Global US Pharmaceutical Caps and Closures Industry Revenue Million Forecast, by End-User Industry 2019 & 2032
- Table 19: Global US Pharmaceutical Caps and Closures Industry Revenue Million Forecast, by Country 2019 & 2032
- Table 20: Brazil US Pharmaceutical Caps and Closures Industry Revenue (Million) Forecast, by Application 2019 & 2032
- Table 21: Argentina US Pharmaceutical Caps and Closures Industry Revenue (Million) Forecast, by Application 2019 & 2032
- Table 22: Rest of South America US Pharmaceutical Caps and Closures Industry Revenue (Million) Forecast, by Application 2019 & 2032
- Table 23: Global US Pharmaceutical Caps and Closures Industry Revenue Million Forecast, by Material Type 2019 & 2032
- Table 24: Global US Pharmaceutical Caps and Closures Industry Revenue Million Forecast, by End-User Industry 2019 & 2032
- Table 25: Global US Pharmaceutical Caps and Closures Industry Revenue Million Forecast, by Country 2019 & 2032
- Table 26: United Kingdom US Pharmaceutical Caps and Closures Industry Revenue (Million) Forecast, by Application 2019 & 2032
- Table 27: Germany US Pharmaceutical Caps and Closures Industry Revenue (Million) Forecast, by Application 2019 & 2032
- Table 28: France US Pharmaceutical Caps and Closures Industry Revenue (Million) Forecast, by Application 2019 & 2032
- Table 29: Italy US Pharmaceutical Caps and Closures Industry Revenue (Million) Forecast, by Application 2019 & 2032
- Table 30: Spain US Pharmaceutical Caps and Closures Industry Revenue (Million) Forecast, by Application 2019 & 2032
- Table 31: Russia US Pharmaceutical Caps and Closures Industry Revenue (Million) Forecast, by Application 2019 & 2032
- Table 32: Benelux US Pharmaceutical Caps and Closures Industry Revenue (Million) Forecast, by Application 2019 & 2032
- Table 33: Nordics US Pharmaceutical Caps and Closures Industry Revenue (Million) Forecast, by Application 2019 & 2032
- Table 34: Rest of Europe US Pharmaceutical Caps and Closures Industry Revenue (Million) Forecast, by Application 2019 & 2032
- Table 35: Global US Pharmaceutical Caps and Closures Industry Revenue Million Forecast, by Material Type 2019 & 2032
- Table 36: Global US Pharmaceutical Caps and Closures Industry Revenue Million Forecast, by End-User Industry 2019 & 2032
- Table 37: Global US Pharmaceutical Caps and Closures Industry Revenue Million Forecast, by Country 2019 & 2032
- Table 38: Turkey US Pharmaceutical Caps and Closures Industry Revenue (Million) Forecast, by Application 2019 & 2032
- Table 39: Israel US Pharmaceutical Caps and Closures Industry Revenue (Million) Forecast, by Application 2019 & 2032
- Table 40: GCC US Pharmaceutical Caps and Closures Industry Revenue (Million) Forecast, by Application 2019 & 2032
- Table 41: North Africa US Pharmaceutical Caps and Closures Industry Revenue (Million) Forecast, by Application 2019 & 2032
- Table 42: South Africa US Pharmaceutical Caps and Closures Industry Revenue (Million) Forecast, by Application 2019 & 2032
- Table 43: Rest of Middle East & Africa US Pharmaceutical Caps and Closures Industry Revenue (Million) Forecast, by Application 2019 & 2032
- Table 44: Global US Pharmaceutical Caps and Closures Industry Revenue Million Forecast, by Material Type 2019 & 2032
- Table 45: Global US Pharmaceutical Caps and Closures Industry Revenue Million Forecast, by End-User Industry 2019 & 2032
- Table 46: Global US Pharmaceutical Caps and Closures Industry Revenue Million Forecast, by Country 2019 & 2032
- Table 47: China US Pharmaceutical Caps and Closures Industry Revenue (Million) Forecast, by Application 2019 & 2032
- Table 48: India US Pharmaceutical Caps and Closures Industry Revenue (Million) Forecast, by Application 2019 & 2032
- Table 49: Japan US Pharmaceutical Caps and Closures Industry Revenue (Million) Forecast, by Application 2019 & 2032
- Table 50: South Korea US Pharmaceutical Caps and Closures Industry Revenue (Million) Forecast, by Application 2019 & 2032
- Table 51: ASEAN US Pharmaceutical Caps and Closures Industry Revenue (Million) Forecast, by Application 2019 & 2032
- Table 52: Oceania US Pharmaceutical Caps and Closures Industry Revenue (Million) Forecast, by Application 2019 & 2032
- Table 53: Rest of Asia Pacific US Pharmaceutical Caps and Closures Industry Revenue (Million) Forecast, by Application 2019 & 2032
Frequently Asked Questions
1. What is the projected Compound Annual Growth Rate (CAGR) of the US Pharmaceutical Caps and Closures Industry?
The projected CAGR is approximately 4.20%.
2. Which companies are prominent players in the US Pharmaceutical Caps and Closures Industry?
Key companies in the market include Aptar Group Inc, Tetra Pak International Sa, Coral Products Plc, Amcor Plc, Crown Holdings Inc, O Berk Company Llc*List Not Exhaustive, Bericap Holdings, Silgan Closures, Mjs Packaging, Albéa S A, Berry Global Inc, Closure Systems International.
3. What are the main segments of the US Pharmaceutical Caps and Closures Industry?
The market segments include Material Type, End-User Industry.
4. Can you provide details about the market size?
The market size is estimated to be USD XX Million as of 2022.
5. What are some drivers contributing to market growth?
; The Increased Demand for Innovative Solutions from Different End Users..
6. What are the notable trends driving market growth?
Plastic to Witness a Highest Growth.
7. Are there any restraints impacting market growth?
; Stringent Regulation on Manufacturers Pertaining to Environmental Degradation.
8. Can you provide examples of recent developments in the market?
N/A
9. What pricing options are available for accessing the report?
Pricing options include single-user, multi-user, and enterprise licenses priced at USD 3800, USD 4500, and USD 5800 respectively.
10. Is the market size provided in terms of value or volume?
The market size is provided in terms of value, measured in Million.
11. Are there any specific market keywords associated with the report?
Yes, the market keyword associated with the report is "US Pharmaceutical Caps and Closures Industry," which aids in identifying and referencing the specific market segment covered.
12. How do I determine which pricing option suits my needs best?
The pricing options vary based on user requirements and access needs. Individual users may opt for single-user licenses, while businesses requiring broader access may choose multi-user or enterprise licenses for cost-effective access to the report.
13. Are there any additional resources or data provided in the US Pharmaceutical Caps and Closures Industry report?
While the report offers comprehensive insights, it's advisable to review the specific contents or supplementary materials provided to ascertain if additional resources or data are available.
14. How can I stay updated on further developments or reports in the US Pharmaceutical Caps and Closures Industry?
To stay informed about further developments, trends, and reports in the US Pharmaceutical Caps and Closures Industry, consider subscribing to industry newsletters, following relevant companies and organizations, or regularly checking reputable industry news sources and publications.
Methodology
Step 1 - Identification of Relevant Samples Size from Population Database


Step 2 - Approaches for Defining Global Market Size (Value, Volume* & Price*)

Note*: In applicable scenarios
Step 3 - Data Sources
Primary Research
- Web Analytics
- Survey Reports
- Research Institute
- Latest Research Reports
- Opinion Leaders
Secondary Research
- Annual Reports
- White Paper
- Latest Press Release
- Industry Association
- Paid Database
- Investor Presentations

Step 4 - Data Triangulation
Involves using different sources of information in order to increase the validity of a study
These sources are likely to be stakeholders in a program - participants, other researchers, program staff, other community members, and so on.
Then we put all data in single framework & apply various statistical tools to find out the dynamic on the market.
During the analysis stage, feedback from the stakeholder groups would be compared to determine areas of agreement as well as areas of divergence
