

Key Insights
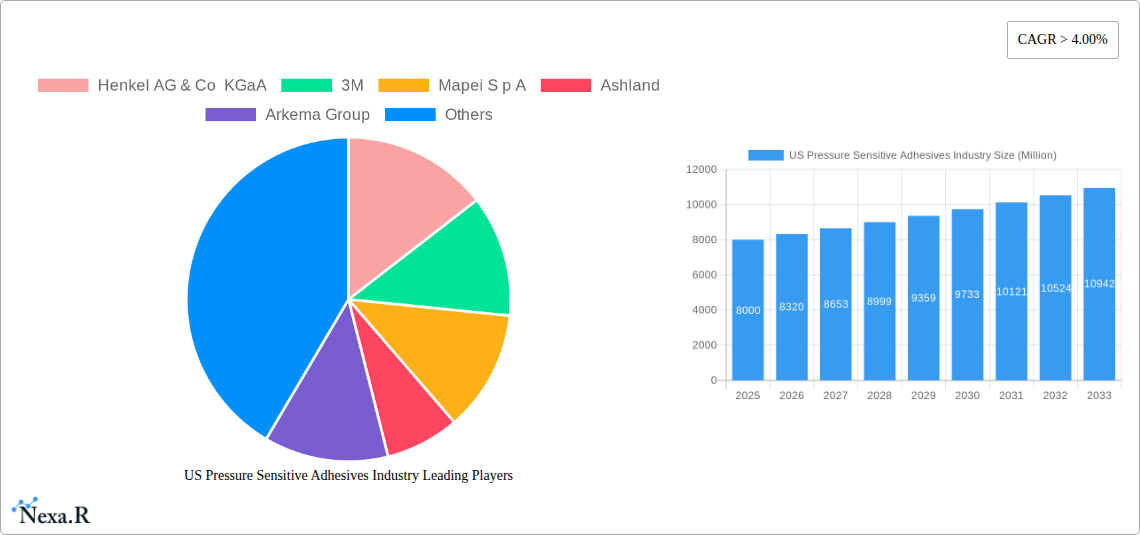
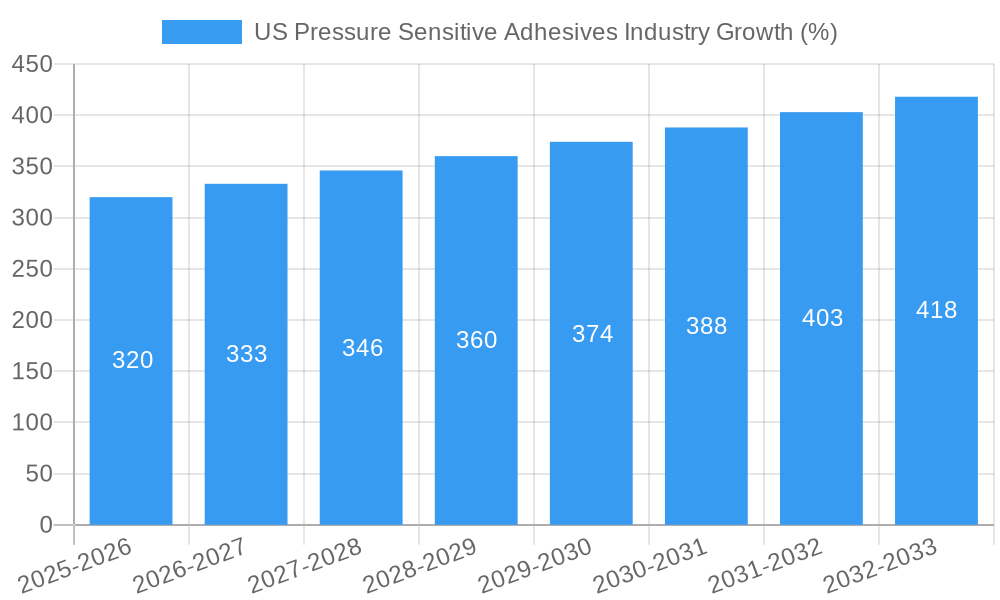
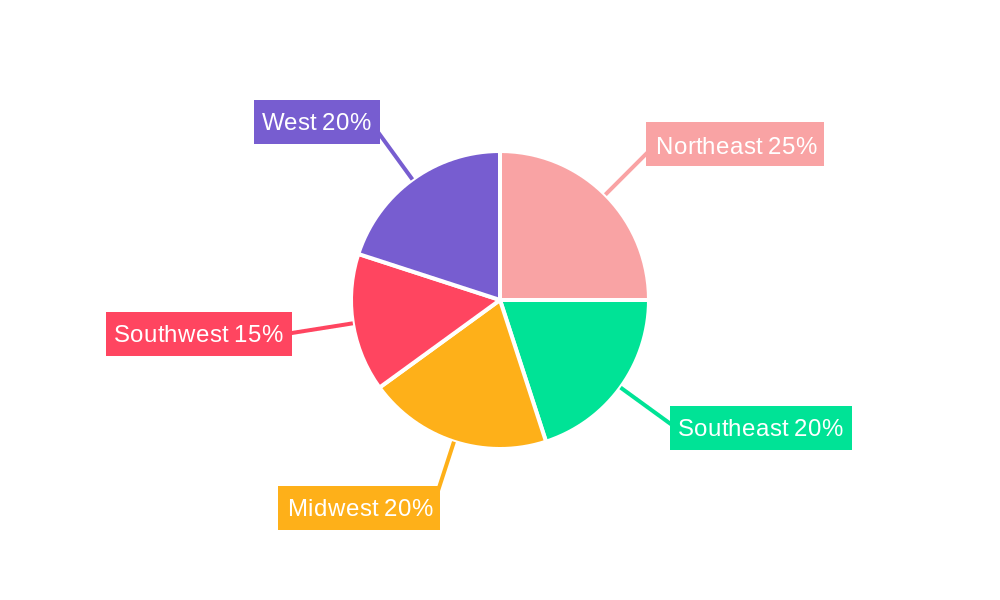
The US pressure-sensitive adhesives (PSA) market, valued at approximately $8 billion in 2025, is projected to experience robust growth, exhibiting a Compound Annual Growth Rate (CAGR) exceeding 4% from 2025 to 2033. This expansion is driven by several key factors. The burgeoning packaging industry, particularly e-commerce's relentless growth, fuels significant demand for PSAs in tapes and labels. Simultaneously, the increasing adoption of PSAs in specialized applications like medical devices and electronics contributes to market expansion. Technological advancements, including the development of more sustainable water-based PSAs and high-performance hot-melt adhesives, are further enhancing market appeal. Regional variations exist, with the Northeast and West Coast experiencing higher growth rates due to stronger manufacturing and technology hubs. However, the Midwest and South also contribute significantly to the overall market volume. The competitive landscape is characterized by both established global players like 3M and Henkel, and specialized regional manufacturers, indicating a healthy balance between innovation and established market presence.
Despite this positive outlook, certain challenges restrain market growth. Fluctuations in raw material prices, particularly for key resin components like acrylics and silicones, impact profitability and overall market dynamics. Moreover, increasing regulatory scrutiny concerning environmental impact necessitates ongoing investments in research and development of eco-friendly PSA formulations. The industry needs to continuously adapt to meet evolving sustainability standards and consumer demands for environmentally conscious products. This necessitates innovation in both material sourcing and production processes. Ultimately, the long-term prognosis for the US PSA market remains optimistic, driven by technological advancements, expanding end-user applications, and a rising demand for efficient and reliable adhesive solutions across diverse industries.
US Pressure Sensitive Adhesives Industry: 2019-2033 Market Report
This comprehensive report provides an in-depth analysis of the US pressure sensitive adhesives (PSA) industry, covering market dynamics, growth trends, dominant segments, and key players. The study period spans from 2019 to 2033, with 2025 as the base year and a forecast period extending to 2033. The report offers valuable insights for industry professionals, investors, and strategic decision-makers seeking to understand and capitalize on opportunities within this dynamic market. The total market size in 2025 is estimated at $XX Billion.
US Pressure Sensitive Adhesives Industry Market Dynamics & Structure
The US pressure sensitive adhesives market is characterized by moderate concentration, with several major players holding significant market share. The industry is driven by technological innovation, particularly in developing sustainable and high-performance adhesives. Regulatory frameworks, including environmental regulations and safety standards, play a crucial role in shaping market dynamics. Competitive pressures arise from substitute products like mechanical fasteners and other bonding agents. End-user demographics, such as the growth of e-commerce and the increasing demand for advanced packaging solutions, significantly influence market demand. M&A activity has been moderate, with several strategic acquisitions aimed at expanding product portfolios and market reach.
- Market Concentration: Moderately concentrated, with the top 5 players holding approximately xx% market share in 2025.
- Technological Innovation: Focus on eco-friendly, high-performance PSAs, including bio-based adhesives and those with improved tack, adhesion, and temperature resistance.
- Regulatory Framework: Stringent environmental regulations and safety standards impacting raw material sourcing and product formulation.
- Competitive Substitutes: Mechanical fasteners and other bonding technologies pose competition in specific applications.
- End-User Demographics: Growing e-commerce and demand for sophisticated packaging drive market growth.
- M&A Activity: Moderate level of mergers and acquisitions aimed at expanding product portfolios and geographical reach, with approximately xx deals recorded between 2019 and 2024.
US Pressure Sensitive Adhesives Industry Growth Trends & Insights
The US pressure sensitive adhesives market experienced steady growth between 2019 and 2024, driven by strong demand across various end-use sectors. The market is projected to continue its expansion throughout the forecast period (2025-2033), fueled by increasing adoption rates in packaging, healthcare, and electronics. Technological advancements, such as the development of specialized PSAs for niche applications, are further accelerating market growth. Consumer behavior shifts towards eco-friendly products and increased demand for convenience are also impacting market trends. The CAGR for the period 2025-2033 is estimated to be xx%. Market penetration in key segments like packaging and electronics is expected to reach xx% by 2033. Specific examples of technological disruptions include the rise of water-based PSAs and the increased use of renewable resources in adhesive formulations.
Dominant Regions, Countries, or Segments in US Pressure Sensitive Adhesives Industry
The packaging segment represents the largest end-user industry, driven by the booming e-commerce sector and the growing demand for sustainable packaging solutions. Within resin types, acrylics dominate due to their versatility and cost-effectiveness. The water-based technology segment is experiencing robust growth due to increasing environmental concerns. Geographically, the Western region of the US exhibits the highest growth potential, fueled by a strong manufacturing base and substantial demand from various end-user industries.
- Key Drivers:
- Packaging: Growth of e-commerce and demand for sustainable packaging.
- Acrylic Resins: Versatility and cost-effectiveness.
- Water-based Technology: Growing preference for eco-friendly adhesives.
- Western US Region: Strong manufacturing and consumer demand.
- Dominance Factors: High market share, strong growth potential, and favorable economic conditions.
US Pressure Sensitive Adhesives Industry Product Landscape
The US PSA market showcases a diverse range of products, encompassing a wide array of formulations tailored to specific applications. Recent innovations focus on enhancing tack, adhesion, and temperature resistance, along with improved sustainability. Key product advancements include bio-based PSAs and those with enhanced durability and UV resistance. Unique selling propositions often involve specialized formulations for unique applications, such as medical devices or high-performance electronics.
Key Drivers, Barriers & Challenges in US Pressure Sensitive Adhesives Industry
Key Drivers: Increasing demand from packaging, electronics, and healthcare sectors; technological advancements leading to enhanced performance and sustainability; favorable government policies promoting sustainable manufacturing.
Key Challenges: Fluctuations in raw material prices; stringent environmental regulations; intense competition from substitute materials and foreign manufacturers; supply chain disruptions. These challenges have resulted in an estimated xx% increase in production costs between 2019 and 2024.
Emerging Opportunities in US Pressure Sensitive Adhesives Industry
Emerging opportunities lie in sustainable and bio-based PSAs, applications in renewable energy technologies, and advanced medical device bonding. Untapped markets include niche applications in aerospace and specialized industrial settings. Evolving consumer preferences towards eco-friendly and easily recyclable products drive demand for sustainable adhesives.
Growth Accelerators in the US Pressure Sensitive Adhesives Industry Industry
Technological breakthroughs in adhesive formulations, strategic partnerships between PSA manufacturers and end-users, and expansion into new geographic markets and applications are key growth accelerators. Innovation in areas such as high-temperature adhesives and those with improved peel strength will continue to drive market growth.
Key Players Shaping the US Pressure Sensitive Adhesives Industry Market
- Henkel AG & Co KGaA
- 3M
- Mapei S p A
- Ashland
- Arkema Group
- Dow
- H B Fuller Company
- Franklin International
- Sika AG
- Jowat SE
- Wacker Chemie AG *List Not Exhaustive
Notable Milestones in US Pressure Sensitive Adhesives Industry Sector
- 2020: Introduction of a new bio-based PSA by 3M.
- 2021: Merger between two smaller PSA manufacturers, resulting in increased market consolidation.
- 2022: Launch of a high-temperature adhesive by Henkel AG & Co KGaA for aerospace applications.
- 2023: Several major players announced investments in sustainable manufacturing processes.
In-Depth US Pressure Sensitive Adhesives Industry Market Outlook
The US pressure sensitive adhesives market is poised for sustained growth driven by technological innovation, increasing demand across various end-use sectors, and a focus on sustainability. Strategic partnerships and market expansion into new applications, such as renewable energy, present significant opportunities for players. The market's future potential is substantial, with continued growth expected throughout the forecast period.
US Pressure Sensitive Adhesives Industry Segmentation
-
1. Resin
- 1.1. Acrylics
- 1.2. Silicones
- 1.3. Elastomers
- 1.4. Other Resins
-
2. Technology
- 2.1. Water-based
- 2.2. Solvent-based
- 2.3. Hot Melt
- 2.4. Radiation
-
3. Application
- 3.1. Tapes
- 3.2. Labels
- 3.3. Graphics
- 3.4. Other Applications
-
4. End-user Industry
- 4.1. Packaging
- 4.2. Woodworking and Joinery
- 4.3. Medical
- 4.4. Commercial Graphics
- 4.5. Transportation
- 4.6. Electronics
- 4.7. Other End-user Industries
US Pressure Sensitive Adhesives Industry Segmentation By Geography
-
1. North America
- 1.1. United States
- 1.2. Canada
- 1.3. Mexico
-
2. South America
- 2.1. Brazil
- 2.2. Argentina
- 2.3. Rest of South America
-
3. Europe
- 3.1. United Kingdom
- 3.2. Germany
- 3.3. France
- 3.4. Italy
- 3.5. Spain
- 3.6. Russia
- 3.7. Benelux
- 3.8. Nordics
- 3.9. Rest of Europe
-
4. Middle East & Africa
- 4.1. Turkey
- 4.2. Israel
- 4.3. GCC
- 4.4. North Africa
- 4.5. South Africa
- 4.6. Rest of Middle East & Africa
-
5. Asia Pacific
- 5.1. China
- 5.2. India
- 5.3. Japan
- 5.4. South Korea
- 5.5. ASEAN
- 5.6. Oceania
- 5.7. Rest of Asia Pacific
US Pressure Sensitive Adhesives Industry REPORT HIGHLIGHTS
| Aspects | Details |
|---|---|
| Study Period | 2019-2033 |
| Base Year | 2024 |
| Estimated Year | 2025 |
| Forecast Period | 2025-2033 |
| Historical Period | 2019-2024 |
| Growth Rate | CAGR of > 4.00% from 2019-2033 |
| Segmentation |
|
Table of Contents
- 1. Introduction
- 1.1. Research Scope
- 1.2. Market Segmentation
- 1.3. Research Methodology
- 1.4. Definitions and Assumptions
- 2. Executive Summary
- 2.1. Introduction
- 3. Market Dynamics
- 3.1. Introduction
- 3.2. Market Drivers
- 3.2.1. ; Shifting Focus to Low-Cost Flexible Packaging; Other Drivers
- 3.3. Market Restrains
- 3.3.1. ; Stringent Environmental Regulations Regarding VOC Emissions; Other Restraints
- 3.4. Market Trends
- 3.4.1. Packaging Industry to Dominate the Market
- 4. Market Factor Analysis
- 4.1. Porters Five Forces
- 4.2. Supply/Value Chain
- 4.3. PESTEL analysis
- 4.4. Market Entropy
- 4.5. Patent/Trademark Analysis
- 5. Global US Pressure Sensitive Adhesives Industry Analysis, Insights and Forecast, 2019-2031
- 5.1. Market Analysis, Insights and Forecast - by Resin
- 5.1.1. Acrylics
- 5.1.2. Silicones
- 5.1.3. Elastomers
- 5.1.4. Other Resins
- 5.2. Market Analysis, Insights and Forecast - by Technology
- 5.2.1. Water-based
- 5.2.2. Solvent-based
- 5.2.3. Hot Melt
- 5.2.4. Radiation
- 5.3. Market Analysis, Insights and Forecast - by Application
- 5.3.1. Tapes
- 5.3.2. Labels
- 5.3.3. Graphics
- 5.3.4. Other Applications
- 5.4. Market Analysis, Insights and Forecast - by End-user Industry
- 5.4.1. Packaging
- 5.4.2. Woodworking and Joinery
- 5.4.3. Medical
- 5.4.4. Commercial Graphics
- 5.4.5. Transportation
- 5.4.6. Electronics
- 5.4.7. Other End-user Industries
- 5.5. Market Analysis, Insights and Forecast - by Region
- 5.5.1. North America
- 5.5.2. South America
- 5.5.3. Europe
- 5.5.4. Middle East & Africa
- 5.5.5. Asia Pacific
- 5.1. Market Analysis, Insights and Forecast - by Resin
- 6. North America US Pressure Sensitive Adhesives Industry Analysis, Insights and Forecast, 2019-2031
- 6.1. Market Analysis, Insights and Forecast - by Resin
- 6.1.1. Acrylics
- 6.1.2. Silicones
- 6.1.3. Elastomers
- 6.1.4. Other Resins
- 6.2. Market Analysis, Insights and Forecast - by Technology
- 6.2.1. Water-based
- 6.2.2. Solvent-based
- 6.2.3. Hot Melt
- 6.2.4. Radiation
- 6.3. Market Analysis, Insights and Forecast - by Application
- 6.3.1. Tapes
- 6.3.2. Labels
- 6.3.3. Graphics
- 6.3.4. Other Applications
- 6.4. Market Analysis, Insights and Forecast - by End-user Industry
- 6.4.1. Packaging
- 6.4.2. Woodworking and Joinery
- 6.4.3. Medical
- 6.4.4. Commercial Graphics
- 6.4.5. Transportation
- 6.4.6. Electronics
- 6.4.7. Other End-user Industries
- 6.1. Market Analysis, Insights and Forecast - by Resin
- 7. South America US Pressure Sensitive Adhesives Industry Analysis, Insights and Forecast, 2019-2031
- 7.1. Market Analysis, Insights and Forecast - by Resin
- 7.1.1. Acrylics
- 7.1.2. Silicones
- 7.1.3. Elastomers
- 7.1.4. Other Resins
- 7.2. Market Analysis, Insights and Forecast - by Technology
- 7.2.1. Water-based
- 7.2.2. Solvent-based
- 7.2.3. Hot Melt
- 7.2.4. Radiation
- 7.3. Market Analysis, Insights and Forecast - by Application
- 7.3.1. Tapes
- 7.3.2. Labels
- 7.3.3. Graphics
- 7.3.4. Other Applications
- 7.4. Market Analysis, Insights and Forecast - by End-user Industry
- 7.4.1. Packaging
- 7.4.2. Woodworking and Joinery
- 7.4.3. Medical
- 7.4.4. Commercial Graphics
- 7.4.5. Transportation
- 7.4.6. Electronics
- 7.4.7. Other End-user Industries
- 7.1. Market Analysis, Insights and Forecast - by Resin
- 8. Europe US Pressure Sensitive Adhesives Industry Analysis, Insights and Forecast, 2019-2031
- 8.1. Market Analysis, Insights and Forecast - by Resin
- 8.1.1. Acrylics
- 8.1.2. Silicones
- 8.1.3. Elastomers
- 8.1.4. Other Resins
- 8.2. Market Analysis, Insights and Forecast - by Technology
- 8.2.1. Water-based
- 8.2.2. Solvent-based
- 8.2.3. Hot Melt
- 8.2.4. Radiation
- 8.3. Market Analysis, Insights and Forecast - by Application
- 8.3.1. Tapes
- 8.3.2. Labels
- 8.3.3. Graphics
- 8.3.4. Other Applications
- 8.4. Market Analysis, Insights and Forecast - by End-user Industry
- 8.4.1. Packaging
- 8.4.2. Woodworking and Joinery
- 8.4.3. Medical
- 8.4.4. Commercial Graphics
- 8.4.5. Transportation
- 8.4.6. Electronics
- 8.4.7. Other End-user Industries
- 8.1. Market Analysis, Insights and Forecast - by Resin
- 9. Middle East & Africa US Pressure Sensitive Adhesives Industry Analysis, Insights and Forecast, 2019-2031
- 9.1. Market Analysis, Insights and Forecast - by Resin
- 9.1.1. Acrylics
- 9.1.2. Silicones
- 9.1.3. Elastomers
- 9.1.4. Other Resins
- 9.2. Market Analysis, Insights and Forecast - by Technology
- 9.2.1. Water-based
- 9.2.2. Solvent-based
- 9.2.3. Hot Melt
- 9.2.4. Radiation
- 9.3. Market Analysis, Insights and Forecast - by Application
- 9.3.1. Tapes
- 9.3.2. Labels
- 9.3.3. Graphics
- 9.3.4. Other Applications
- 9.4. Market Analysis, Insights and Forecast - by End-user Industry
- 9.4.1. Packaging
- 9.4.2. Woodworking and Joinery
- 9.4.3. Medical
- 9.4.4. Commercial Graphics
- 9.4.5. Transportation
- 9.4.6. Electronics
- 9.4.7. Other End-user Industries
- 9.1. Market Analysis, Insights and Forecast - by Resin
- 10. Asia Pacific US Pressure Sensitive Adhesives Industry Analysis, Insights and Forecast, 2019-2031
- 10.1. Market Analysis, Insights and Forecast - by Resin
- 10.1.1. Acrylics
- 10.1.2. Silicones
- 10.1.3. Elastomers
- 10.1.4. Other Resins
- 10.2. Market Analysis, Insights and Forecast - by Technology
- 10.2.1. Water-based
- 10.2.2. Solvent-based
- 10.2.3. Hot Melt
- 10.2.4. Radiation
- 10.3. Market Analysis, Insights and Forecast - by Application
- 10.3.1. Tapes
- 10.3.2. Labels
- 10.3.3. Graphics
- 10.3.4. Other Applications
- 10.4. Market Analysis, Insights and Forecast - by End-user Industry
- 10.4.1. Packaging
- 10.4.2. Woodworking and Joinery
- 10.4.3. Medical
- 10.4.4. Commercial Graphics
- 10.4.5. Transportation
- 10.4.6. Electronics
- 10.4.7. Other End-user Industries
- 10.1. Market Analysis, Insights and Forecast - by Resin
- 11. Northeast US Pressure Sensitive Adhesives Industry Analysis, Insights and Forecast, 2019-2031
- 12. Southeast US Pressure Sensitive Adhesives Industry Analysis, Insights and Forecast, 2019-2031
- 13. Midwest US Pressure Sensitive Adhesives Industry Analysis, Insights and Forecast, 2019-2031
- 14. Southwest US Pressure Sensitive Adhesives Industry Analysis, Insights and Forecast, 2019-2031
- 15. West US Pressure Sensitive Adhesives Industry Analysis, Insights and Forecast, 2019-2031
- 16. Competitive Analysis
- 16.1. Global Market Share Analysis 2024
- 16.2. Company Profiles
- 16.2.1 Henkel AG & Co KGaA
- 16.2.1.1. Overview
- 16.2.1.2. Products
- 16.2.1.3. SWOT Analysis
- 16.2.1.4. Recent Developments
- 16.2.1.5. Financials (Based on Availability)
- 16.2.2 3M
- 16.2.2.1. Overview
- 16.2.2.2. Products
- 16.2.2.3. SWOT Analysis
- 16.2.2.4. Recent Developments
- 16.2.2.5. Financials (Based on Availability)
- 16.2.3 Mapei S p A
- 16.2.3.1. Overview
- 16.2.3.2. Products
- 16.2.3.3. SWOT Analysis
- 16.2.3.4. Recent Developments
- 16.2.3.5. Financials (Based on Availability)
- 16.2.4 Ashland
- 16.2.4.1. Overview
- 16.2.4.2. Products
- 16.2.4.3. SWOT Analysis
- 16.2.4.4. Recent Developments
- 16.2.4.5. Financials (Based on Availability)
- 16.2.5 Arkema Group
- 16.2.5.1. Overview
- 16.2.5.2. Products
- 16.2.5.3. SWOT Analysis
- 16.2.5.4. Recent Developments
- 16.2.5.5. Financials (Based on Availability)
- 16.2.6 Dow
- 16.2.6.1. Overview
- 16.2.6.2. Products
- 16.2.6.3. SWOT Analysis
- 16.2.6.4. Recent Developments
- 16.2.6.5. Financials (Based on Availability)
- 16.2.7 H B Fuller Company
- 16.2.7.1. Overview
- 16.2.7.2. Products
- 16.2.7.3. SWOT Analysis
- 16.2.7.4. Recent Developments
- 16.2.7.5. Financials (Based on Availability)
- 16.2.8 Franklin International
- 16.2.8.1. Overview
- 16.2.8.2. Products
- 16.2.8.3. SWOT Analysis
- 16.2.8.4. Recent Developments
- 16.2.8.5. Financials (Based on Availability)
- 16.2.9 Sika AG
- 16.2.9.1. Overview
- 16.2.9.2. Products
- 16.2.9.3. SWOT Analysis
- 16.2.9.4. Recent Developments
- 16.2.9.5. Financials (Based on Availability)
- 16.2.10 Jowat SE
- 16.2.10.1. Overview
- 16.2.10.2. Products
- 16.2.10.3. SWOT Analysis
- 16.2.10.4. Recent Developments
- 16.2.10.5. Financials (Based on Availability)
- 16.2.11 Wacker Chemie AG*List Not Exhaustive
- 16.2.11.1. Overview
- 16.2.11.2. Products
- 16.2.11.3. SWOT Analysis
- 16.2.11.4. Recent Developments
- 16.2.11.5. Financials (Based on Availability)
- 16.2.1 Henkel AG & Co KGaA
List of Figures
- Figure 1: Global US Pressure Sensitive Adhesives Industry Revenue Breakdown (Million, %) by Region 2024 & 2032
- Figure 2: United states US Pressure Sensitive Adhesives Industry Revenue (Million), by Country 2024 & 2032
- Figure 3: United states US Pressure Sensitive Adhesives Industry Revenue Share (%), by Country 2024 & 2032
- Figure 4: North America US Pressure Sensitive Adhesives Industry Revenue (Million), by Resin 2024 & 2032
- Figure 5: North America US Pressure Sensitive Adhesives Industry Revenue Share (%), by Resin 2024 & 2032
- Figure 6: North America US Pressure Sensitive Adhesives Industry Revenue (Million), by Technology 2024 & 2032
- Figure 7: North America US Pressure Sensitive Adhesives Industry Revenue Share (%), by Technology 2024 & 2032
- Figure 8: North America US Pressure Sensitive Adhesives Industry Revenue (Million), by Application 2024 & 2032
- Figure 9: North America US Pressure Sensitive Adhesives Industry Revenue Share (%), by Application 2024 & 2032
- Figure 10: North America US Pressure Sensitive Adhesives Industry Revenue (Million), by End-user Industry 2024 & 2032
- Figure 11: North America US Pressure Sensitive Adhesives Industry Revenue Share (%), by End-user Industry 2024 & 2032
- Figure 12: North America US Pressure Sensitive Adhesives Industry Revenue (Million), by Country 2024 & 2032
- Figure 13: North America US Pressure Sensitive Adhesives Industry Revenue Share (%), by Country 2024 & 2032
- Figure 14: South America US Pressure Sensitive Adhesives Industry Revenue (Million), by Resin 2024 & 2032
- Figure 15: South America US Pressure Sensitive Adhesives Industry Revenue Share (%), by Resin 2024 & 2032
- Figure 16: South America US Pressure Sensitive Adhesives Industry Revenue (Million), by Technology 2024 & 2032
- Figure 17: South America US Pressure Sensitive Adhesives Industry Revenue Share (%), by Technology 2024 & 2032
- Figure 18: South America US Pressure Sensitive Adhesives Industry Revenue (Million), by Application 2024 & 2032
- Figure 19: South America US Pressure Sensitive Adhesives Industry Revenue Share (%), by Application 2024 & 2032
- Figure 20: South America US Pressure Sensitive Adhesives Industry Revenue (Million), by End-user Industry 2024 & 2032
- Figure 21: South America US Pressure Sensitive Adhesives Industry Revenue Share (%), by End-user Industry 2024 & 2032
- Figure 22: South America US Pressure Sensitive Adhesives Industry Revenue (Million), by Country 2024 & 2032
- Figure 23: South America US Pressure Sensitive Adhesives Industry Revenue Share (%), by Country 2024 & 2032
- Figure 24: Europe US Pressure Sensitive Adhesives Industry Revenue (Million), by Resin 2024 & 2032
- Figure 25: Europe US Pressure Sensitive Adhesives Industry Revenue Share (%), by Resin 2024 & 2032
- Figure 26: Europe US Pressure Sensitive Adhesives Industry Revenue (Million), by Technology 2024 & 2032
- Figure 27: Europe US Pressure Sensitive Adhesives Industry Revenue Share (%), by Technology 2024 & 2032
- Figure 28: Europe US Pressure Sensitive Adhesives Industry Revenue (Million), by Application 2024 & 2032
- Figure 29: Europe US Pressure Sensitive Adhesives Industry Revenue Share (%), by Application 2024 & 2032
- Figure 30: Europe US Pressure Sensitive Adhesives Industry Revenue (Million), by End-user Industry 2024 & 2032
- Figure 31: Europe US Pressure Sensitive Adhesives Industry Revenue Share (%), by End-user Industry 2024 & 2032
- Figure 32: Europe US Pressure Sensitive Adhesives Industry Revenue (Million), by Country 2024 & 2032
- Figure 33: Europe US Pressure Sensitive Adhesives Industry Revenue Share (%), by Country 2024 & 2032
- Figure 34: Middle East & Africa US Pressure Sensitive Adhesives Industry Revenue (Million), by Resin 2024 & 2032
- Figure 35: Middle East & Africa US Pressure Sensitive Adhesives Industry Revenue Share (%), by Resin 2024 & 2032
- Figure 36: Middle East & Africa US Pressure Sensitive Adhesives Industry Revenue (Million), by Technology 2024 & 2032
- Figure 37: Middle East & Africa US Pressure Sensitive Adhesives Industry Revenue Share (%), by Technology 2024 & 2032
- Figure 38: Middle East & Africa US Pressure Sensitive Adhesives Industry Revenue (Million), by Application 2024 & 2032
- Figure 39: Middle East & Africa US Pressure Sensitive Adhesives Industry Revenue Share (%), by Application 2024 & 2032
- Figure 40: Middle East & Africa US Pressure Sensitive Adhesives Industry Revenue (Million), by End-user Industry 2024 & 2032
- Figure 41: Middle East & Africa US Pressure Sensitive Adhesives Industry Revenue Share (%), by End-user Industry 2024 & 2032
- Figure 42: Middle East & Africa US Pressure Sensitive Adhesives Industry Revenue (Million), by Country 2024 & 2032
- Figure 43: Middle East & Africa US Pressure Sensitive Adhesives Industry Revenue Share (%), by Country 2024 & 2032
- Figure 44: Asia Pacific US Pressure Sensitive Adhesives Industry Revenue (Million), by Resin 2024 & 2032
- Figure 45: Asia Pacific US Pressure Sensitive Adhesives Industry Revenue Share (%), by Resin 2024 & 2032
- Figure 46: Asia Pacific US Pressure Sensitive Adhesives Industry Revenue (Million), by Technology 2024 & 2032
- Figure 47: Asia Pacific US Pressure Sensitive Adhesives Industry Revenue Share (%), by Technology 2024 & 2032
- Figure 48: Asia Pacific US Pressure Sensitive Adhesives Industry Revenue (Million), by Application 2024 & 2032
- Figure 49: Asia Pacific US Pressure Sensitive Adhesives Industry Revenue Share (%), by Application 2024 & 2032
- Figure 50: Asia Pacific US Pressure Sensitive Adhesives Industry Revenue (Million), by End-user Industry 2024 & 2032
- Figure 51: Asia Pacific US Pressure Sensitive Adhesives Industry Revenue Share (%), by End-user Industry 2024 & 2032
- Figure 52: Asia Pacific US Pressure Sensitive Adhesives Industry Revenue (Million), by Country 2024 & 2032
- Figure 53: Asia Pacific US Pressure Sensitive Adhesives Industry Revenue Share (%), by Country 2024 & 2032
List of Tables
- Table 1: Global US Pressure Sensitive Adhesives Industry Revenue Million Forecast, by Region 2019 & 2032
- Table 2: Global US Pressure Sensitive Adhesives Industry Revenue Million Forecast, by Resin 2019 & 2032
- Table 3: Global US Pressure Sensitive Adhesives Industry Revenue Million Forecast, by Technology 2019 & 2032
- Table 4: Global US Pressure Sensitive Adhesives Industry Revenue Million Forecast, by Application 2019 & 2032
- Table 5: Global US Pressure Sensitive Adhesives Industry Revenue Million Forecast, by End-user Industry 2019 & 2032
- Table 6: Global US Pressure Sensitive Adhesives Industry Revenue Million Forecast, by Region 2019 & 2032
- Table 7: Global US Pressure Sensitive Adhesives Industry Revenue Million Forecast, by Country 2019 & 2032
- Table 8: Northeast US Pressure Sensitive Adhesives Industry Revenue (Million) Forecast, by Application 2019 & 2032
- Table 9: Southeast US Pressure Sensitive Adhesives Industry Revenue (Million) Forecast, by Application 2019 & 2032
- Table 10: Midwest US Pressure Sensitive Adhesives Industry Revenue (Million) Forecast, by Application 2019 & 2032
- Table 11: Southwest US Pressure Sensitive Adhesives Industry Revenue (Million) Forecast, by Application 2019 & 2032
- Table 12: West US Pressure Sensitive Adhesives Industry Revenue (Million) Forecast, by Application 2019 & 2032
- Table 13: Global US Pressure Sensitive Adhesives Industry Revenue Million Forecast, by Resin 2019 & 2032
- Table 14: Global US Pressure Sensitive Adhesives Industry Revenue Million Forecast, by Technology 2019 & 2032
- Table 15: Global US Pressure Sensitive Adhesives Industry Revenue Million Forecast, by Application 2019 & 2032
- Table 16: Global US Pressure Sensitive Adhesives Industry Revenue Million Forecast, by End-user Industry 2019 & 2032
- Table 17: Global US Pressure Sensitive Adhesives Industry Revenue Million Forecast, by Country 2019 & 2032
- Table 18: United States US Pressure Sensitive Adhesives Industry Revenue (Million) Forecast, by Application 2019 & 2032
- Table 19: Canada US Pressure Sensitive Adhesives Industry Revenue (Million) Forecast, by Application 2019 & 2032
- Table 20: Mexico US Pressure Sensitive Adhesives Industry Revenue (Million) Forecast, by Application 2019 & 2032
- Table 21: Global US Pressure Sensitive Adhesives Industry Revenue Million Forecast, by Resin 2019 & 2032
- Table 22: Global US Pressure Sensitive Adhesives Industry Revenue Million Forecast, by Technology 2019 & 2032
- Table 23: Global US Pressure Sensitive Adhesives Industry Revenue Million Forecast, by Application 2019 & 2032
- Table 24: Global US Pressure Sensitive Adhesives Industry Revenue Million Forecast, by End-user Industry 2019 & 2032
- Table 25: Global US Pressure Sensitive Adhesives Industry Revenue Million Forecast, by Country 2019 & 2032
- Table 26: Brazil US Pressure Sensitive Adhesives Industry Revenue (Million) Forecast, by Application 2019 & 2032
- Table 27: Argentina US Pressure Sensitive Adhesives Industry Revenue (Million) Forecast, by Application 2019 & 2032
- Table 28: Rest of South America US Pressure Sensitive Adhesives Industry Revenue (Million) Forecast, by Application 2019 & 2032
- Table 29: Global US Pressure Sensitive Adhesives Industry Revenue Million Forecast, by Resin 2019 & 2032
- Table 30: Global US Pressure Sensitive Adhesives Industry Revenue Million Forecast, by Technology 2019 & 2032
- Table 31: Global US Pressure Sensitive Adhesives Industry Revenue Million Forecast, by Application 2019 & 2032
- Table 32: Global US Pressure Sensitive Adhesives Industry Revenue Million Forecast, by End-user Industry 2019 & 2032
- Table 33: Global US Pressure Sensitive Adhesives Industry Revenue Million Forecast, by Country 2019 & 2032
- Table 34: United Kingdom US Pressure Sensitive Adhesives Industry Revenue (Million) Forecast, by Application 2019 & 2032
- Table 35: Germany US Pressure Sensitive Adhesives Industry Revenue (Million) Forecast, by Application 2019 & 2032
- Table 36: France US Pressure Sensitive Adhesives Industry Revenue (Million) Forecast, by Application 2019 & 2032
- Table 37: Italy US Pressure Sensitive Adhesives Industry Revenue (Million) Forecast, by Application 2019 & 2032
- Table 38: Spain US Pressure Sensitive Adhesives Industry Revenue (Million) Forecast, by Application 2019 & 2032
- Table 39: Russia US Pressure Sensitive Adhesives Industry Revenue (Million) Forecast, by Application 2019 & 2032
- Table 40: Benelux US Pressure Sensitive Adhesives Industry Revenue (Million) Forecast, by Application 2019 & 2032
- Table 41: Nordics US Pressure Sensitive Adhesives Industry Revenue (Million) Forecast, by Application 2019 & 2032
- Table 42: Rest of Europe US Pressure Sensitive Adhesives Industry Revenue (Million) Forecast, by Application 2019 & 2032
- Table 43: Global US Pressure Sensitive Adhesives Industry Revenue Million Forecast, by Resin 2019 & 2032
- Table 44: Global US Pressure Sensitive Adhesives Industry Revenue Million Forecast, by Technology 2019 & 2032
- Table 45: Global US Pressure Sensitive Adhesives Industry Revenue Million Forecast, by Application 2019 & 2032
- Table 46: Global US Pressure Sensitive Adhesives Industry Revenue Million Forecast, by End-user Industry 2019 & 2032
- Table 47: Global US Pressure Sensitive Adhesives Industry Revenue Million Forecast, by Country 2019 & 2032
- Table 48: Turkey US Pressure Sensitive Adhesives Industry Revenue (Million) Forecast, by Application 2019 & 2032
- Table 49: Israel US Pressure Sensitive Adhesives Industry Revenue (Million) Forecast, by Application 2019 & 2032
- Table 50: GCC US Pressure Sensitive Adhesives Industry Revenue (Million) Forecast, by Application 2019 & 2032
- Table 51: North Africa US Pressure Sensitive Adhesives Industry Revenue (Million) Forecast, by Application 2019 & 2032
- Table 52: South Africa US Pressure Sensitive Adhesives Industry Revenue (Million) Forecast, by Application 2019 & 2032
- Table 53: Rest of Middle East & Africa US Pressure Sensitive Adhesives Industry Revenue (Million) Forecast, by Application 2019 & 2032
- Table 54: Global US Pressure Sensitive Adhesives Industry Revenue Million Forecast, by Resin 2019 & 2032
- Table 55: Global US Pressure Sensitive Adhesives Industry Revenue Million Forecast, by Technology 2019 & 2032
- Table 56: Global US Pressure Sensitive Adhesives Industry Revenue Million Forecast, by Application 2019 & 2032
- Table 57: Global US Pressure Sensitive Adhesives Industry Revenue Million Forecast, by End-user Industry 2019 & 2032
- Table 58: Global US Pressure Sensitive Adhesives Industry Revenue Million Forecast, by Country 2019 & 2032
- Table 59: China US Pressure Sensitive Adhesives Industry Revenue (Million) Forecast, by Application 2019 & 2032
- Table 60: India US Pressure Sensitive Adhesives Industry Revenue (Million) Forecast, by Application 2019 & 2032
- Table 61: Japan US Pressure Sensitive Adhesives Industry Revenue (Million) Forecast, by Application 2019 & 2032
- Table 62: South Korea US Pressure Sensitive Adhesives Industry Revenue (Million) Forecast, by Application 2019 & 2032
- Table 63: ASEAN US Pressure Sensitive Adhesives Industry Revenue (Million) Forecast, by Application 2019 & 2032
- Table 64: Oceania US Pressure Sensitive Adhesives Industry Revenue (Million) Forecast, by Application 2019 & 2032
- Table 65: Rest of Asia Pacific US Pressure Sensitive Adhesives Industry Revenue (Million) Forecast, by Application 2019 & 2032
Frequently Asked Questions
1. What is the projected Compound Annual Growth Rate (CAGR) of the US Pressure Sensitive Adhesives Industry?
The projected CAGR is approximately > 4.00%.
2. Which companies are prominent players in the US Pressure Sensitive Adhesives Industry?
Key companies in the market include Henkel AG & Co KGaA, 3M, Mapei S p A, Ashland, Arkema Group, Dow, H B Fuller Company, Franklin International, Sika AG, Jowat SE, Wacker Chemie AG*List Not Exhaustive.
3. What are the main segments of the US Pressure Sensitive Adhesives Industry?
The market segments include Resin, Technology, Application, End-user Industry.
4. Can you provide details about the market size?
The market size is estimated to be USD XX Million as of 2022.
5. What are some drivers contributing to market growth?
; Shifting Focus to Low-Cost Flexible Packaging; Other Drivers.
6. What are the notable trends driving market growth?
Packaging Industry to Dominate the Market.
7. Are there any restraints impacting market growth?
; Stringent Environmental Regulations Regarding VOC Emissions; Other Restraints.
8. Can you provide examples of recent developments in the market?
N/A
9. What pricing options are available for accessing the report?
Pricing options include single-user, multi-user, and enterprise licenses priced at USD 3800, USD 4500, and USD 5800 respectively.
10. Is the market size provided in terms of value or volume?
The market size is provided in terms of value, measured in Million.
11. Are there any specific market keywords associated with the report?
Yes, the market keyword associated with the report is "US Pressure Sensitive Adhesives Industry," which aids in identifying and referencing the specific market segment covered.
12. How do I determine which pricing option suits my needs best?
The pricing options vary based on user requirements and access needs. Individual users may opt for single-user licenses, while businesses requiring broader access may choose multi-user or enterprise licenses for cost-effective access to the report.
13. Are there any additional resources or data provided in the US Pressure Sensitive Adhesives Industry report?
While the report offers comprehensive insights, it's advisable to review the specific contents or supplementary materials provided to ascertain if additional resources or data are available.
14. How can I stay updated on further developments or reports in the US Pressure Sensitive Adhesives Industry?
To stay informed about further developments, trends, and reports in the US Pressure Sensitive Adhesives Industry, consider subscribing to industry newsletters, following relevant companies and organizations, or regularly checking reputable industry news sources and publications.
Methodology
Step 1 - Identification of Relevant Samples Size from Population Database


Step 2 - Approaches for Defining Global Market Size (Value, Volume* & Price*)

Note*: In applicable scenarios
Step 3 - Data Sources
Primary Research
- Web Analytics
- Survey Reports
- Research Institute
- Latest Research Reports
- Opinion Leaders
Secondary Research
- Annual Reports
- White Paper
- Latest Press Release
- Industry Association
- Paid Database
- Investor Presentations

Step 4 - Data Triangulation
Involves using different sources of information in order to increase the validity of a study
These sources are likely to be stakeholders in a program - participants, other researchers, program staff, other community members, and so on.
Then we put all data in single framework & apply various statistical tools to find out the dynamic on the market.
During the analysis stage, feedback from the stakeholder groups would be compared to determine areas of agreement as well as areas of divergence
