

Key Insights
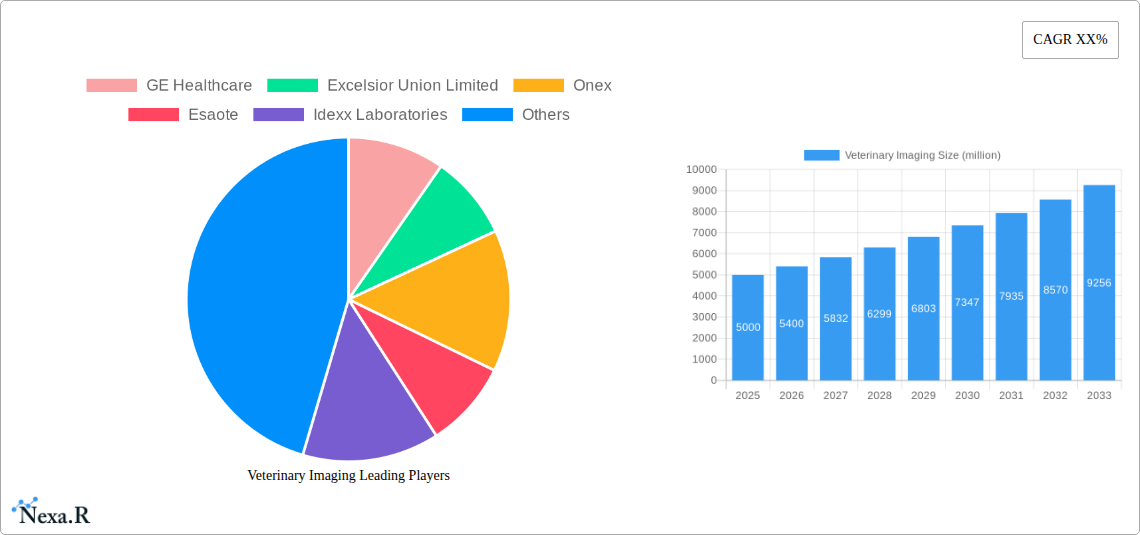
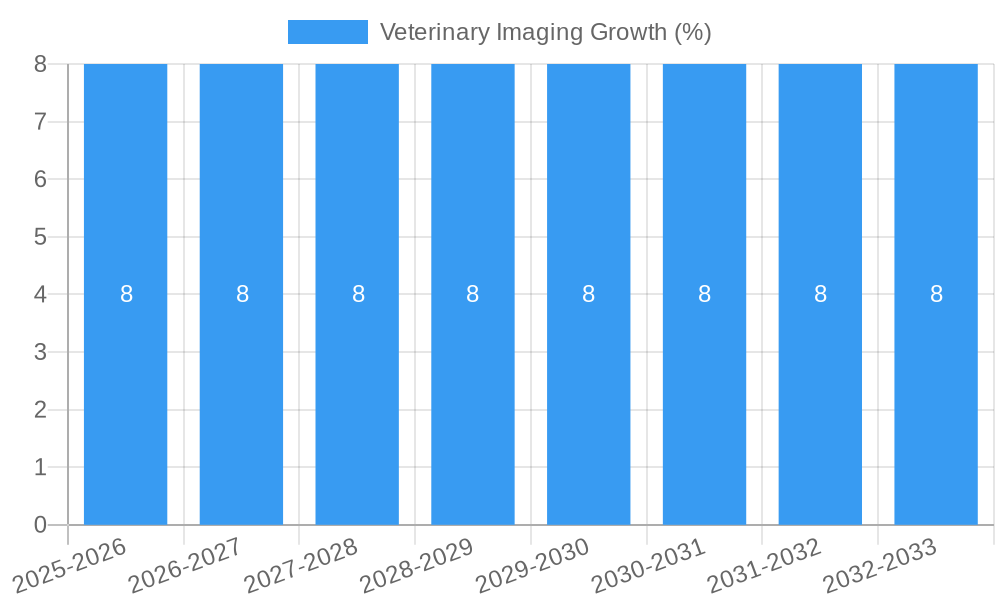
The global Veterinary Imaging market is poised for significant expansion, estimated at a substantial market size of approximately $5,000 million in 2025. This growth is projected to accelerate at a Compound Annual Growth Rate (CAGR) of around 8% through 2033. This robust expansion is primarily driven by an increasing pet ownership globally, coupled with a growing awareness among pet owners regarding the importance of advanced diagnostic tools for animal health. The rising disposable incomes in emerging economies also contribute to increased spending on veterinary care, including sophisticated imaging procedures. Furthermore, advancements in veterinary imaging technologies, such as enhanced resolution in X-ray and ultrasound, and the development of portable and AI-assisted devices, are making these diagnostic tools more accessible and effective, thereby fueling market demand. The competitive landscape features established players like GE Healthcare, Siemens, and Hitachi, alongside specialized veterinary diagnostics companies, all vying for market share through product innovation and strategic partnerships.
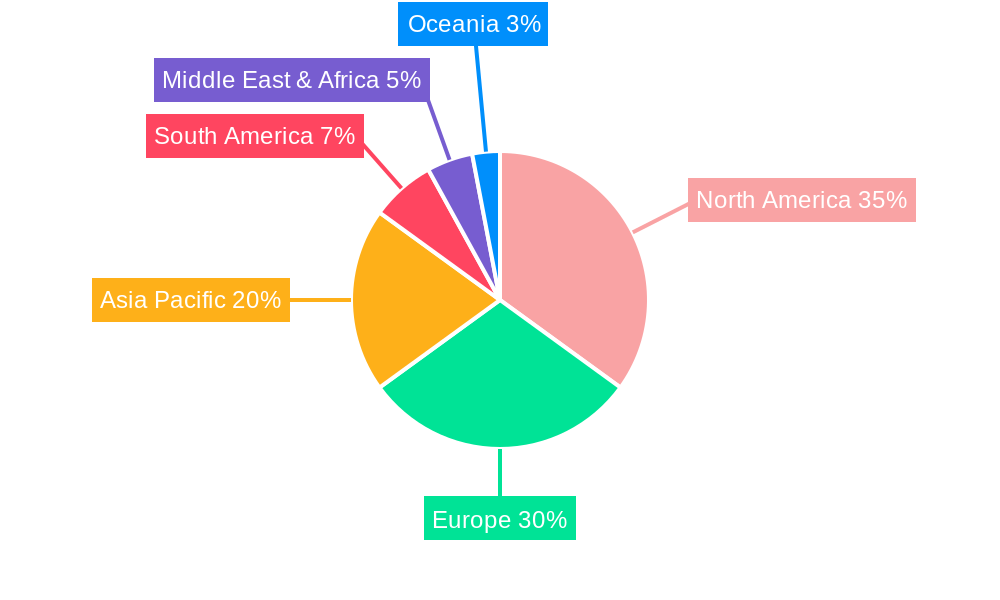
The market is segmented by application, with Hospitals and Clinics accounting for the dominant share due to the centralized nature of advanced veterinary care. Academic Institutes also represent a significant segment, contributing to research and development. In terms of technology, X-ray and Ultrasound imaging are the most prevalent, offering versatility and relatively lower costs. However, the "Other" category, which likely encompasses more advanced modalities like CT, MRI, and nuclear imaging, is expected to witness the fastest growth as veterinary medicine increasingly adopts human medical standards. Geographically, North America and Europe currently lead the market due to well-established veterinary infrastructure and high pet care expenditure. The Asia Pacific region is anticipated to emerge as a key growth engine, driven by rapid urbanization, a burgeoning pet population, and increasing investments in veterinary healthcare facilities. Restraints, such as the high cost of advanced imaging equipment and a shortage of trained veterinary imaging specialists in certain regions, may temper growth to some extent, but the overwhelming trend points towards sustained and significant market expansion.
Veterinary Imaging Market Dynamics & Structure
The global veterinary imaging market is characterized by a moderately concentrated structure, with key players like GE Healthcare, Siemens, Hitachi, and Esaote holding significant sway. Technological innovation remains a paramount driver, with continuous advancements in digital radiography, MRI, and ultrasound enhancing diagnostic accuracy and patient outcomes. Regulatory frameworks, though varied globally, are increasingly aligning to ensure safety and efficacy of veterinary imaging devices and consumables. Competitive product substitutes, such as advanced laboratory diagnostics, present an evolving landscape, necessitating constant innovation in imaging modalities. End-user demographics are shifting, with an increasing emphasis on pet humanization and a willingness among owners to invest in advanced healthcare for their companions, driving demand for sophisticated diagnostic tools. Mergers and acquisitions (M&A) activity is observed, aiming to consolidate market share and expand product portfolios. For instance, the acquisition of VCA by Mars Petcare significantly impacted the industry's consolidated infrastructure.
- Market Concentration: Moderate, with a few dominant global manufacturers.
- Technological Innovation: Driven by digital imaging, AI integration, and portable solutions.
- Regulatory Frameworks: Evolving global standards for device approval and data privacy.
- Competitive Product Substitutes: Advanced lab diagnostics and point-of-care testing.
- End-User Demographics: Growing demand for advanced diagnostics fueled by pet humanization.
- M&A Trends: Strategic acquisitions to expand product offerings and market reach.
Veterinary Imaging Growth Trends & Insights
The global veterinary imaging market is poised for substantial growth, projected to expand from an estimated $3,500 million in 2025 to $6,000 million by 2033, exhibiting a Compound Annual Growth Rate (CAGR) of approximately 6.5% during the forecast period of 2025–2033. This robust expansion is underpinned by a confluence of factors, including the escalating adoption of advanced imaging technologies across veterinary practices, a heightened awareness among pet owners regarding the importance of early and accurate diagnosis, and the increasing prevalence of chronic diseases and complex medical conditions in animals. The base year of 2025 sets a strong foundation, with historical data from 2019–2024 indicating a steady upward trajectory driven by initial investments in digital radiography and ultrasound.
Technological disruptions are at the forefront of market evolution. The integration of Artificial Intelligence (AI) in image analysis is revolutionizing diagnostic speed and accuracy, enabling veterinarians to detect subtle abnormalities more effectively. Furthermore, the development of more portable and user-friendly imaging devices, such as handheld ultrasound machines and compact digital X-ray systems, is democratizing access to advanced diagnostics, particularly in rural or smaller clinic settings. This accessibility directly influences adoption rates, allowing a wider spectrum of veterinary professionals to integrate these technologies into their daily practice.
Consumer behavior shifts are a significant catalyst. The anthropomorphism trend, where pets are increasingly viewed as integral family members, translates into a greater willingness to invest in their healthcare. This includes a demand for specialized veterinary care and diagnostic services that were previously reserved for human medicine. Consequently, veterinary hospitals are upgrading their imaging equipment to mirror human medical facilities, driving demand for high-resolution MRI, CT scanners, and advanced ultrasound systems. Academic institutes are also playing a crucial role, not only in research and development but also in training the next generation of veterinary radiologists and technicians, further solidifying the market's growth trajectory. The penetration of these advanced imaging solutions is expected to deepen significantly over the forecast period.
Dominant Regions, Countries, or Segments in Veterinary Imaging
North America currently stands as the dominant region in the global veterinary imaging market, driven by a confluence of strong economic policies, advanced healthcare infrastructure for animals, and a high level of pet ownership coupled with significant disposable income allocated to pet care. The United States, in particular, spearheads this dominance, boasting a large number of veterinary clinics, hospitals, and academic institutions that are early adopters of cutting-edge diagnostic technologies. The market share held by North America is estimated to be around 35% in 2025, with a projected growth potential that will see it maintain its leading position throughout the forecast period. Key drivers include robust government support for veterinary research, a well-established network of veterinary specialists, and an increasing prevalence of diagnostic imaging services.
Within the application segment, veterinary clinics are expected to be the largest contributors, accounting for an estimated 45% of the market revenue in 2025. This is attributed to the growing trend of general practitioners expanding their diagnostic capabilities to include in-house imaging services, thereby improving patient care and reducing referral times. Veterinary hospitals follow closely, representing approximately 30% of the market, as they are equipped to handle more complex cases requiring advanced imaging modalities like MRI and CT scans. Academic institutes, while smaller in terms of direct market share (around 25%), are crucial for driving innovation and demand through research and training.
In terms of technology types, X-ray technology continues to hold a significant market share, estimated at 40% in 2025, due to its affordability, ease of use, and widespread application in routine diagnostics. However, Ultrasound Technology is experiencing the fastest growth, projected to capture 35% of the market by 2025 and poised for further expansion. Its non-invasive nature, real-time imaging capabilities, and increasing portability make it indispensable for a wide range of diagnostic scenarios. The "Other" category, encompassing MRI, CT scans, and digital radiography, collectively represents the remaining 25%, with substantial growth anticipated as these advanced technologies become more accessible and affordable for veterinary practices. The increasing focus on sophisticated diagnostics for a growing number of companion animals, coupled with the rising disposable income of pet owners, are powerful factors propelling this market's expansion.
Veterinary Imaging Product Landscape
The veterinary imaging product landscape is continually being redefined by innovation, with a strong focus on enhanced resolution, portability, and user-friendliness. Companies are actively developing digital radiography systems that offer faster image acquisition and reduced radiation exposure for both animals and staff. Advancements in ultrasound technology include the introduction of higher frequency transducers for detailed imaging of smaller structures and AI-powered software that aids in image interpretation and workflow optimization. The "other" category is witnessing significant growth with the development of more compact and cost-effective MRI and CT scanners, making these powerful diagnostic tools accessible to a wider range of veterinary facilities. Unique selling propositions now revolve around integrated software solutions for seamless PACS (Picture Archiving and Communication System) integration, remote diagnostics, and specialized imaging protocols tailored for various animal species.
Key Drivers, Barriers & Challenges in Veterinary Imaging
The veterinary imaging market is propelled by several key drivers, including the burgeoning pet humanization trend, leading to increased spending on companion animal healthcare, and significant advancements in imaging technology that offer greater diagnostic accuracy and speed. The growing prevalence of chronic diseases in animals and a rising demand for specialized veterinary care also contribute to market expansion. Furthermore, favorable government initiatives and growing awareness among pet owners about the benefits of early disease detection through imaging are significant accelerators.
However, the market faces considerable barriers and challenges. High initial investment costs for advanced imaging equipment, particularly for smaller veterinary practices, remain a significant restraint. The limited availability of trained veterinary radiologists and technicians in certain regions poses a workforce challenge. Stringent regulatory approvals for new medical devices and the need for continuous software updates and maintenance can also impede widespread adoption. Additionally, supply chain disruptions and the increasing competition from established and emerging players create a dynamic and sometimes challenging operating environment.
Emerging Opportunities in Veterinary Imaging
Emerging opportunities in veterinary imaging lie in the development of AI-driven diagnostic tools that can automate preliminary image analysis, thereby improving efficiency and reducing diagnostic errors. The growing demand for point-of-care diagnostics is creating a niche for highly portable and affordable imaging devices suitable for field use or emergency situations. Furthermore, the expansion of telemedicine and remote diagnostic services presents a significant opportunity, enabling specialists to consult on complex cases irrespective of geographical location. The increasing focus on preventative care and early disease detection also opens avenues for new imaging protocols and screening programs for common animal ailments.
Growth Accelerators in the Veterinary Imaging Industry
Growth in the veterinary imaging industry is being significantly accelerated by technological breakthroughs, particularly in areas like miniaturization of equipment, enhancement of image resolution, and the integration of artificial intelligence for image analysis. Strategic partnerships between imaging technology providers and veterinary diagnostic companies are fostering innovation and expanding market reach. Furthermore, the global expansion of veterinary services, driven by increasing pet ownership in emerging economies and a rising standard of care worldwide, is creating new markets and demand for advanced imaging solutions. The continuous development of specialized imaging modalities for exotic animals and wildlife also represents a significant growth avenue.
Key Players Shaping the Veterinary Imaging Market
GE Healthcare Excelsior Union Limited Onex Esaote Idexx Laboratories VCA Hitachi Siemens
Notable Milestones in Veterinary Imaging Sector
- 2019: Introduction of AI-powered image analysis software for veterinary X-rays.
- 2020: Launch of a new generation of portable ultrasound devices with enhanced image quality.
- 2021: Significant advancements in digital radiography, offering lower radiation doses and faster scan times.
- 2022: Increased investment in research and development for compact MRI scanners for veterinary use.
- 2023: Growing trend of cloud-based PACS solutions for veterinary imaging, enabling remote access and collaboration.
- 2024: Emergence of AI-driven anomaly detection algorithms for common veterinary imaging modalities.
In-Depth Veterinary Imaging Market Outlook
The future of the veterinary imaging market appears exceptionally promising, driven by the sustained pet humanization trend and an ever-increasing demand for advanced diagnostics. AI integration is set to revolutionize image interpretation, while the development of more affordable and portable devices will democratize access to crucial diagnostic tools. Strategic collaborations and the expansion of veterinary services into emerging markets will further fuel growth. The market is expected to witness continued innovation, leading to improved patient outcomes and a more sophisticated approach to animal healthcare globally.
Veterinary Imaging Segmentation
-
1. Application
- 1.1. Clinics
- 1.2. Hospitals and Academic Institutes
-
2. Types
- 2.1. X-ray Technology
- 2.2. Ultrasound Technology
- 2.3. Other
Veterinary Imaging Segmentation By Geography
-
1. North America
- 1.1. United States
- 1.2. Canada
- 1.3. Mexico
-
2. South America
- 2.1. Brazil
- 2.2. Argentina
- 2.3. Rest of South America
-
3. Europe
- 3.1. United Kingdom
- 3.2. Germany
- 3.3. France
- 3.4. Italy
- 3.5. Spain
- 3.6. Russia
- 3.7. Benelux
- 3.8. Nordics
- 3.9. Rest of Europe
-
4. Middle East & Africa
- 4.1. Turkey
- 4.2. Israel
- 4.3. GCC
- 4.4. North Africa
- 4.5. South Africa
- 4.6. Rest of Middle East & Africa
-
5. Asia Pacific
- 5.1. China
- 5.2. India
- 5.3. Japan
- 5.4. South Korea
- 5.5. ASEAN
- 5.6. Oceania
- 5.7. Rest of Asia Pacific
Veterinary Imaging REPORT HIGHLIGHTS
| Aspects | Details |
|---|---|
| Study Period | 2019-2033 |
| Base Year | 2024 |
| Estimated Year | 2025 |
| Forecast Period | 2025-2033 |
| Historical Period | 2019-2024 |
| Growth Rate | CAGR of XX% from 2019-2033 |
| Segmentation |
|
Table of Contents
- 1. Introduction
- 1.1. Research Scope
- 1.2. Market Segmentation
- 1.3. Research Methodology
- 1.4. Definitions and Assumptions
- 2. Executive Summary
- 2.1. Introduction
- 3. Market Dynamics
- 3.1. Introduction
- 3.2. Market Drivers
- 3.3. Market Restrains
- 3.4. Market Trends
- 4. Market Factor Analysis
- 4.1. Porters Five Forces
- 4.2. Supply/Value Chain
- 4.3. PESTEL analysis
- 4.4. Market Entropy
- 4.5. Patent/Trademark Analysis
- 5. Global Veterinary Imaging Analysis, Insights and Forecast, 2019-2031
- 5.1. Market Analysis, Insights and Forecast - by Application
- 5.1.1. Clinics
- 5.1.2. Hospitals and Academic Institutes
- 5.2. Market Analysis, Insights and Forecast - by Types
- 5.2.1. X-ray Technology
- 5.2.2. Ultrasound Technology
- 5.2.3. Other
- 5.3. Market Analysis, Insights and Forecast - by Region
- 5.3.1. North America
- 5.3.2. South America
- 5.3.3. Europe
- 5.3.4. Middle East & Africa
- 5.3.5. Asia Pacific
- 5.1. Market Analysis, Insights and Forecast - by Application
- 6. North America Veterinary Imaging Analysis, Insights and Forecast, 2019-2031
- 6.1. Market Analysis, Insights and Forecast - by Application
- 6.1.1. Clinics
- 6.1.2. Hospitals and Academic Institutes
- 6.2. Market Analysis, Insights and Forecast - by Types
- 6.2.1. X-ray Technology
- 6.2.2. Ultrasound Technology
- 6.2.3. Other
- 6.1. Market Analysis, Insights and Forecast - by Application
- 7. South America Veterinary Imaging Analysis, Insights and Forecast, 2019-2031
- 7.1. Market Analysis, Insights and Forecast - by Application
- 7.1.1. Clinics
- 7.1.2. Hospitals and Academic Institutes
- 7.2. Market Analysis, Insights and Forecast - by Types
- 7.2.1. X-ray Technology
- 7.2.2. Ultrasound Technology
- 7.2.3. Other
- 7.1. Market Analysis, Insights and Forecast - by Application
- 8. Europe Veterinary Imaging Analysis, Insights and Forecast, 2019-2031
- 8.1. Market Analysis, Insights and Forecast - by Application
- 8.1.1. Clinics
- 8.1.2. Hospitals and Academic Institutes
- 8.2. Market Analysis, Insights and Forecast - by Types
- 8.2.1. X-ray Technology
- 8.2.2. Ultrasound Technology
- 8.2.3. Other
- 8.1. Market Analysis, Insights and Forecast - by Application
- 9. Middle East & Africa Veterinary Imaging Analysis, Insights and Forecast, 2019-2031
- 9.1. Market Analysis, Insights and Forecast - by Application
- 9.1.1. Clinics
- 9.1.2. Hospitals and Academic Institutes
- 9.2. Market Analysis, Insights and Forecast - by Types
- 9.2.1. X-ray Technology
- 9.2.2. Ultrasound Technology
- 9.2.3. Other
- 9.1. Market Analysis, Insights and Forecast - by Application
- 10. Asia Pacific Veterinary Imaging Analysis, Insights and Forecast, 2019-2031
- 10.1. Market Analysis, Insights and Forecast - by Application
- 10.1.1. Clinics
- 10.1.2. Hospitals and Academic Institutes
- 10.2. Market Analysis, Insights and Forecast - by Types
- 10.2.1. X-ray Technology
- 10.2.2. Ultrasound Technology
- 10.2.3. Other
- 10.1. Market Analysis, Insights and Forecast - by Application
- 11. Competitive Analysis
- 11.1. Global Market Share Analysis 2024
- 11.2. Company Profiles
- 11.2.1 GE Healthcare
- 11.2.1.1. Overview
- 11.2.1.2. Products
- 11.2.1.3. SWOT Analysis
- 11.2.1.4. Recent Developments
- 11.2.1.5. Financials (Based on Availability)
- 11.2.2 Excelsior Union Limited
- 11.2.2.1. Overview
- 11.2.2.2. Products
- 11.2.2.3. SWOT Analysis
- 11.2.2.4. Recent Developments
- 11.2.2.5. Financials (Based on Availability)
- 11.2.3 Onex
- 11.2.3.1. Overview
- 11.2.3.2. Products
- 11.2.3.3. SWOT Analysis
- 11.2.3.4. Recent Developments
- 11.2.3.5. Financials (Based on Availability)
- 11.2.4 Esaote
- 11.2.4.1. Overview
- 11.2.4.2. Products
- 11.2.4.3. SWOT Analysis
- 11.2.4.4. Recent Developments
- 11.2.4.5. Financials (Based on Availability)
- 11.2.5 Idexx Laboratories
- 11.2.5.1. Overview
- 11.2.5.2. Products
- 11.2.5.3. SWOT Analysis
- 11.2.5.4. Recent Developments
- 11.2.5.5. Financials (Based on Availability)
- 11.2.6 VCA
- 11.2.6.1. Overview
- 11.2.6.2. Products
- 11.2.6.3. SWOT Analysis
- 11.2.6.4. Recent Developments
- 11.2.6.5. Financials (Based on Availability)
- 11.2.7 Hitachi
- 11.2.7.1. Overview
- 11.2.7.2. Products
- 11.2.7.3. SWOT Analysis
- 11.2.7.4. Recent Developments
- 11.2.7.5. Financials (Based on Availability)
- 11.2.8 Siemens
- 11.2.8.1. Overview
- 11.2.8.2. Products
- 11.2.8.3. SWOT Analysis
- 11.2.8.4. Recent Developments
- 11.2.8.5. Financials (Based on Availability)
- 11.2.1 GE Healthcare
List of Figures
- Figure 1: Global Veterinary Imaging Revenue Breakdown (million, %) by Region 2024 & 2032
- Figure 2: Global Veterinary Imaging Volume Breakdown (K, %) by Region 2024 & 2032
- Figure 3: North America Veterinary Imaging Revenue (million), by Application 2024 & 2032
- Figure 4: North America Veterinary Imaging Volume (K), by Application 2024 & 2032
- Figure 5: North America Veterinary Imaging Revenue Share (%), by Application 2024 & 2032
- Figure 6: North America Veterinary Imaging Volume Share (%), by Application 2024 & 2032
- Figure 7: North America Veterinary Imaging Revenue (million), by Types 2024 & 2032
- Figure 8: North America Veterinary Imaging Volume (K), by Types 2024 & 2032
- Figure 9: North America Veterinary Imaging Revenue Share (%), by Types 2024 & 2032
- Figure 10: North America Veterinary Imaging Volume Share (%), by Types 2024 & 2032
- Figure 11: North America Veterinary Imaging Revenue (million), by Country 2024 & 2032
- Figure 12: North America Veterinary Imaging Volume (K), by Country 2024 & 2032
- Figure 13: North America Veterinary Imaging Revenue Share (%), by Country 2024 & 2032
- Figure 14: North America Veterinary Imaging Volume Share (%), by Country 2024 & 2032
- Figure 15: South America Veterinary Imaging Revenue (million), by Application 2024 & 2032
- Figure 16: South America Veterinary Imaging Volume (K), by Application 2024 & 2032
- Figure 17: South America Veterinary Imaging Revenue Share (%), by Application 2024 & 2032
- Figure 18: South America Veterinary Imaging Volume Share (%), by Application 2024 & 2032
- Figure 19: South America Veterinary Imaging Revenue (million), by Types 2024 & 2032
- Figure 20: South America Veterinary Imaging Volume (K), by Types 2024 & 2032
- Figure 21: South America Veterinary Imaging Revenue Share (%), by Types 2024 & 2032
- Figure 22: South America Veterinary Imaging Volume Share (%), by Types 2024 & 2032
- Figure 23: South America Veterinary Imaging Revenue (million), by Country 2024 & 2032
- Figure 24: South America Veterinary Imaging Volume (K), by Country 2024 & 2032
- Figure 25: South America Veterinary Imaging Revenue Share (%), by Country 2024 & 2032
- Figure 26: South America Veterinary Imaging Volume Share (%), by Country 2024 & 2032
- Figure 27: Europe Veterinary Imaging Revenue (million), by Application 2024 & 2032
- Figure 28: Europe Veterinary Imaging Volume (K), by Application 2024 & 2032
- Figure 29: Europe Veterinary Imaging Revenue Share (%), by Application 2024 & 2032
- Figure 30: Europe Veterinary Imaging Volume Share (%), by Application 2024 & 2032
- Figure 31: Europe Veterinary Imaging Revenue (million), by Types 2024 & 2032
- Figure 32: Europe Veterinary Imaging Volume (K), by Types 2024 & 2032
- Figure 33: Europe Veterinary Imaging Revenue Share (%), by Types 2024 & 2032
- Figure 34: Europe Veterinary Imaging Volume Share (%), by Types 2024 & 2032
- Figure 35: Europe Veterinary Imaging Revenue (million), by Country 2024 & 2032
- Figure 36: Europe Veterinary Imaging Volume (K), by Country 2024 & 2032
- Figure 37: Europe Veterinary Imaging Revenue Share (%), by Country 2024 & 2032
- Figure 38: Europe Veterinary Imaging Volume Share (%), by Country 2024 & 2032
- Figure 39: Middle East & Africa Veterinary Imaging Revenue (million), by Application 2024 & 2032
- Figure 40: Middle East & Africa Veterinary Imaging Volume (K), by Application 2024 & 2032
- Figure 41: Middle East & Africa Veterinary Imaging Revenue Share (%), by Application 2024 & 2032
- Figure 42: Middle East & Africa Veterinary Imaging Volume Share (%), by Application 2024 & 2032
- Figure 43: Middle East & Africa Veterinary Imaging Revenue (million), by Types 2024 & 2032
- Figure 44: Middle East & Africa Veterinary Imaging Volume (K), by Types 2024 & 2032
- Figure 45: Middle East & Africa Veterinary Imaging Revenue Share (%), by Types 2024 & 2032
- Figure 46: Middle East & Africa Veterinary Imaging Volume Share (%), by Types 2024 & 2032
- Figure 47: Middle East & Africa Veterinary Imaging Revenue (million), by Country 2024 & 2032
- Figure 48: Middle East & Africa Veterinary Imaging Volume (K), by Country 2024 & 2032
- Figure 49: Middle East & Africa Veterinary Imaging Revenue Share (%), by Country 2024 & 2032
- Figure 50: Middle East & Africa Veterinary Imaging Volume Share (%), by Country 2024 & 2032
- Figure 51: Asia Pacific Veterinary Imaging Revenue (million), by Application 2024 & 2032
- Figure 52: Asia Pacific Veterinary Imaging Volume (K), by Application 2024 & 2032
- Figure 53: Asia Pacific Veterinary Imaging Revenue Share (%), by Application 2024 & 2032
- Figure 54: Asia Pacific Veterinary Imaging Volume Share (%), by Application 2024 & 2032
- Figure 55: Asia Pacific Veterinary Imaging Revenue (million), by Types 2024 & 2032
- Figure 56: Asia Pacific Veterinary Imaging Volume (K), by Types 2024 & 2032
- Figure 57: Asia Pacific Veterinary Imaging Revenue Share (%), by Types 2024 & 2032
- Figure 58: Asia Pacific Veterinary Imaging Volume Share (%), by Types 2024 & 2032
- Figure 59: Asia Pacific Veterinary Imaging Revenue (million), by Country 2024 & 2032
- Figure 60: Asia Pacific Veterinary Imaging Volume (K), by Country 2024 & 2032
- Figure 61: Asia Pacific Veterinary Imaging Revenue Share (%), by Country 2024 & 2032
- Figure 62: Asia Pacific Veterinary Imaging Volume Share (%), by Country 2024 & 2032
List of Tables
- Table 1: Global Veterinary Imaging Revenue million Forecast, by Region 2019 & 2032
- Table 2: Global Veterinary Imaging Volume K Forecast, by Region 2019 & 2032
- Table 3: Global Veterinary Imaging Revenue million Forecast, by Application 2019 & 2032
- Table 4: Global Veterinary Imaging Volume K Forecast, by Application 2019 & 2032
- Table 5: Global Veterinary Imaging Revenue million Forecast, by Types 2019 & 2032
- Table 6: Global Veterinary Imaging Volume K Forecast, by Types 2019 & 2032
- Table 7: Global Veterinary Imaging Revenue million Forecast, by Region 2019 & 2032
- Table 8: Global Veterinary Imaging Volume K Forecast, by Region 2019 & 2032
- Table 9: Global Veterinary Imaging Revenue million Forecast, by Application 2019 & 2032
- Table 10: Global Veterinary Imaging Volume K Forecast, by Application 2019 & 2032
- Table 11: Global Veterinary Imaging Revenue million Forecast, by Types 2019 & 2032
- Table 12: Global Veterinary Imaging Volume K Forecast, by Types 2019 & 2032
- Table 13: Global Veterinary Imaging Revenue million Forecast, by Country 2019 & 2032
- Table 14: Global Veterinary Imaging Volume K Forecast, by Country 2019 & 2032
- Table 15: United States Veterinary Imaging Revenue (million) Forecast, by Application 2019 & 2032
- Table 16: United States Veterinary Imaging Volume (K) Forecast, by Application 2019 & 2032
- Table 17: Canada Veterinary Imaging Revenue (million) Forecast, by Application 2019 & 2032
- Table 18: Canada Veterinary Imaging Volume (K) Forecast, by Application 2019 & 2032
- Table 19: Mexico Veterinary Imaging Revenue (million) Forecast, by Application 2019 & 2032
- Table 20: Mexico Veterinary Imaging Volume (K) Forecast, by Application 2019 & 2032
- Table 21: Global Veterinary Imaging Revenue million Forecast, by Application 2019 & 2032
- Table 22: Global Veterinary Imaging Volume K Forecast, by Application 2019 & 2032
- Table 23: Global Veterinary Imaging Revenue million Forecast, by Types 2019 & 2032
- Table 24: Global Veterinary Imaging Volume K Forecast, by Types 2019 & 2032
- Table 25: Global Veterinary Imaging Revenue million Forecast, by Country 2019 & 2032
- Table 26: Global Veterinary Imaging Volume K Forecast, by Country 2019 & 2032
- Table 27: Brazil Veterinary Imaging Revenue (million) Forecast, by Application 2019 & 2032
- Table 28: Brazil Veterinary Imaging Volume (K) Forecast, by Application 2019 & 2032
- Table 29: Argentina Veterinary Imaging Revenue (million) Forecast, by Application 2019 & 2032
- Table 30: Argentina Veterinary Imaging Volume (K) Forecast, by Application 2019 & 2032
- Table 31: Rest of South America Veterinary Imaging Revenue (million) Forecast, by Application 2019 & 2032
- Table 32: Rest of South America Veterinary Imaging Volume (K) Forecast, by Application 2019 & 2032
- Table 33: Global Veterinary Imaging Revenue million Forecast, by Application 2019 & 2032
- Table 34: Global Veterinary Imaging Volume K Forecast, by Application 2019 & 2032
- Table 35: Global Veterinary Imaging Revenue million Forecast, by Types 2019 & 2032
- Table 36: Global Veterinary Imaging Volume K Forecast, by Types 2019 & 2032
- Table 37: Global Veterinary Imaging Revenue million Forecast, by Country 2019 & 2032
- Table 38: Global Veterinary Imaging Volume K Forecast, by Country 2019 & 2032
- Table 39: United Kingdom Veterinary Imaging Revenue (million) Forecast, by Application 2019 & 2032
- Table 40: United Kingdom Veterinary Imaging Volume (K) Forecast, by Application 2019 & 2032
- Table 41: Germany Veterinary Imaging Revenue (million) Forecast, by Application 2019 & 2032
- Table 42: Germany Veterinary Imaging Volume (K) Forecast, by Application 2019 & 2032
- Table 43: France Veterinary Imaging Revenue (million) Forecast, by Application 2019 & 2032
- Table 44: France Veterinary Imaging Volume (K) Forecast, by Application 2019 & 2032
- Table 45: Italy Veterinary Imaging Revenue (million) Forecast, by Application 2019 & 2032
- Table 46: Italy Veterinary Imaging Volume (K) Forecast, by Application 2019 & 2032
- Table 47: Spain Veterinary Imaging Revenue (million) Forecast, by Application 2019 & 2032
- Table 48: Spain Veterinary Imaging Volume (K) Forecast, by Application 2019 & 2032
- Table 49: Russia Veterinary Imaging Revenue (million) Forecast, by Application 2019 & 2032
- Table 50: Russia Veterinary Imaging Volume (K) Forecast, by Application 2019 & 2032
- Table 51: Benelux Veterinary Imaging Revenue (million) Forecast, by Application 2019 & 2032
- Table 52: Benelux Veterinary Imaging Volume (K) Forecast, by Application 2019 & 2032
- Table 53: Nordics Veterinary Imaging Revenue (million) Forecast, by Application 2019 & 2032
- Table 54: Nordics Veterinary Imaging Volume (K) Forecast, by Application 2019 & 2032
- Table 55: Rest of Europe Veterinary Imaging Revenue (million) Forecast, by Application 2019 & 2032
- Table 56: Rest of Europe Veterinary Imaging Volume (K) Forecast, by Application 2019 & 2032
- Table 57: Global Veterinary Imaging Revenue million Forecast, by Application 2019 & 2032
- Table 58: Global Veterinary Imaging Volume K Forecast, by Application 2019 & 2032
- Table 59: Global Veterinary Imaging Revenue million Forecast, by Types 2019 & 2032
- Table 60: Global Veterinary Imaging Volume K Forecast, by Types 2019 & 2032
- Table 61: Global Veterinary Imaging Revenue million Forecast, by Country 2019 & 2032
- Table 62: Global Veterinary Imaging Volume K Forecast, by Country 2019 & 2032
- Table 63: Turkey Veterinary Imaging Revenue (million) Forecast, by Application 2019 & 2032
- Table 64: Turkey Veterinary Imaging Volume (K) Forecast, by Application 2019 & 2032
- Table 65: Israel Veterinary Imaging Revenue (million) Forecast, by Application 2019 & 2032
- Table 66: Israel Veterinary Imaging Volume (K) Forecast, by Application 2019 & 2032
- Table 67: GCC Veterinary Imaging Revenue (million) Forecast, by Application 2019 & 2032
- Table 68: GCC Veterinary Imaging Volume (K) Forecast, by Application 2019 & 2032
- Table 69: North Africa Veterinary Imaging Revenue (million) Forecast, by Application 2019 & 2032
- Table 70: North Africa Veterinary Imaging Volume (K) Forecast, by Application 2019 & 2032
- Table 71: South Africa Veterinary Imaging Revenue (million) Forecast, by Application 2019 & 2032
- Table 72: South Africa Veterinary Imaging Volume (K) Forecast, by Application 2019 & 2032
- Table 73: Rest of Middle East & Africa Veterinary Imaging Revenue (million) Forecast, by Application 2019 & 2032
- Table 74: Rest of Middle East & Africa Veterinary Imaging Volume (K) Forecast, by Application 2019 & 2032
- Table 75: Global Veterinary Imaging Revenue million Forecast, by Application 2019 & 2032
- Table 76: Global Veterinary Imaging Volume K Forecast, by Application 2019 & 2032
- Table 77: Global Veterinary Imaging Revenue million Forecast, by Types 2019 & 2032
- Table 78: Global Veterinary Imaging Volume K Forecast, by Types 2019 & 2032
- Table 79: Global Veterinary Imaging Revenue million Forecast, by Country 2019 & 2032
- Table 80: Global Veterinary Imaging Volume K Forecast, by Country 2019 & 2032
- Table 81: China Veterinary Imaging Revenue (million) Forecast, by Application 2019 & 2032
- Table 82: China Veterinary Imaging Volume (K) Forecast, by Application 2019 & 2032
- Table 83: India Veterinary Imaging Revenue (million) Forecast, by Application 2019 & 2032
- Table 84: India Veterinary Imaging Volume (K) Forecast, by Application 2019 & 2032
- Table 85: Japan Veterinary Imaging Revenue (million) Forecast, by Application 2019 & 2032
- Table 86: Japan Veterinary Imaging Volume (K) Forecast, by Application 2019 & 2032
- Table 87: South Korea Veterinary Imaging Revenue (million) Forecast, by Application 2019 & 2032
- Table 88: South Korea Veterinary Imaging Volume (K) Forecast, by Application 2019 & 2032
- Table 89: ASEAN Veterinary Imaging Revenue (million) Forecast, by Application 2019 & 2032
- Table 90: ASEAN Veterinary Imaging Volume (K) Forecast, by Application 2019 & 2032
- Table 91: Oceania Veterinary Imaging Revenue (million) Forecast, by Application 2019 & 2032
- Table 92: Oceania Veterinary Imaging Volume (K) Forecast, by Application 2019 & 2032
- Table 93: Rest of Asia Pacific Veterinary Imaging Revenue (million) Forecast, by Application 2019 & 2032
- Table 94: Rest of Asia Pacific Veterinary Imaging Volume (K) Forecast, by Application 2019 & 2032
Frequently Asked Questions
1. What is the projected Compound Annual Growth Rate (CAGR) of the Veterinary Imaging?
The projected CAGR is approximately XX%.
2. Which companies are prominent players in the Veterinary Imaging?
Key companies in the market include GE Healthcare, Excelsior Union Limited, Onex, Esaote, Idexx Laboratories, VCA, Hitachi, Siemens.
3. What are the main segments of the Veterinary Imaging?
The market segments include Application, Types.
4. Can you provide details about the market size?
The market size is estimated to be USD XXX million as of 2022.
5. What are some drivers contributing to market growth?
N/A
6. What are the notable trends driving market growth?
N/A
7. Are there any restraints impacting market growth?
N/A
8. Can you provide examples of recent developments in the market?
N/A
9. What pricing options are available for accessing the report?
Pricing options include single-user, multi-user, and enterprise licenses priced at USD 3350.00, USD 5025.00, and USD 6700.00 respectively.
10. Is the market size provided in terms of value or volume?
The market size is provided in terms of value, measured in million and volume, measured in K.
11. Are there any specific market keywords associated with the report?
Yes, the market keyword associated with the report is "Veterinary Imaging," which aids in identifying and referencing the specific market segment covered.
12. How do I determine which pricing option suits my needs best?
The pricing options vary based on user requirements and access needs. Individual users may opt for single-user licenses, while businesses requiring broader access may choose multi-user or enterprise licenses for cost-effective access to the report.
13. Are there any additional resources or data provided in the Veterinary Imaging report?
While the report offers comprehensive insights, it's advisable to review the specific contents or supplementary materials provided to ascertain if additional resources or data are available.
14. How can I stay updated on further developments or reports in the Veterinary Imaging?
To stay informed about further developments, trends, and reports in the Veterinary Imaging, consider subscribing to industry newsletters, following relevant companies and organizations, or regularly checking reputable industry news sources and publications.
Methodology
Step 1 - Identification of Relevant Samples Size from Population Database


Step 2 - Approaches for Defining Global Market Size (Value, Volume* & Price*)

Note*: In applicable scenarios
Step 3 - Data Sources
Primary Research
- Web Analytics
- Survey Reports
- Research Institute
- Latest Research Reports
- Opinion Leaders
Secondary Research
- Annual Reports
- White Paper
- Latest Press Release
- Industry Association
- Paid Database
- Investor Presentations

Step 4 - Data Triangulation
Involves using different sources of information in order to increase the validity of a study
These sources are likely to be stakeholders in a program - participants, other researchers, program staff, other community members, and so on.
Then we put all data in single framework & apply various statistical tools to find out the dynamic on the market.
During the analysis stage, feedback from the stakeholder groups would be compared to determine areas of agreement as well as areas of divergence
