

Key Insights
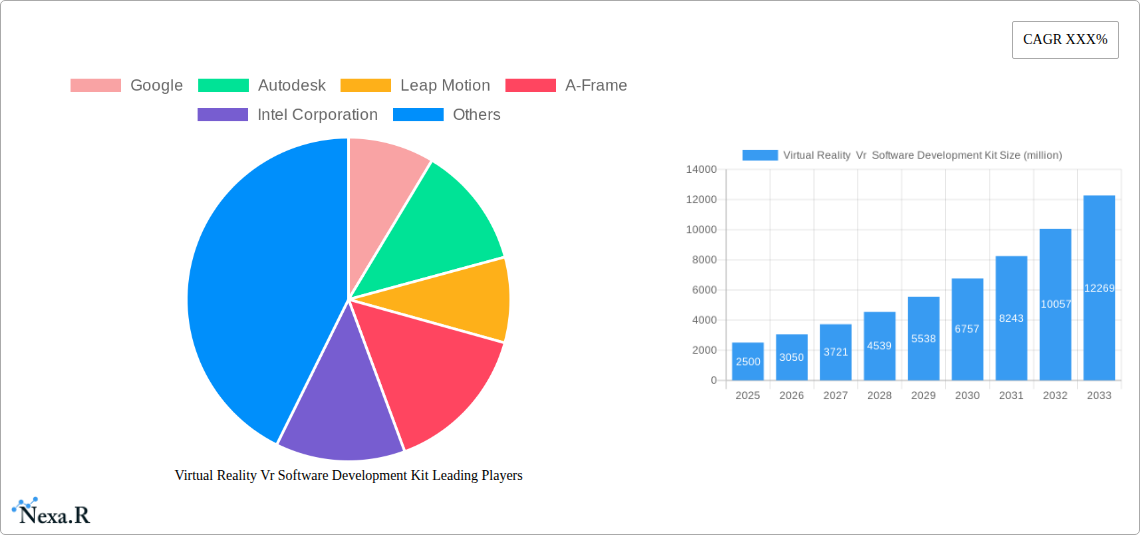
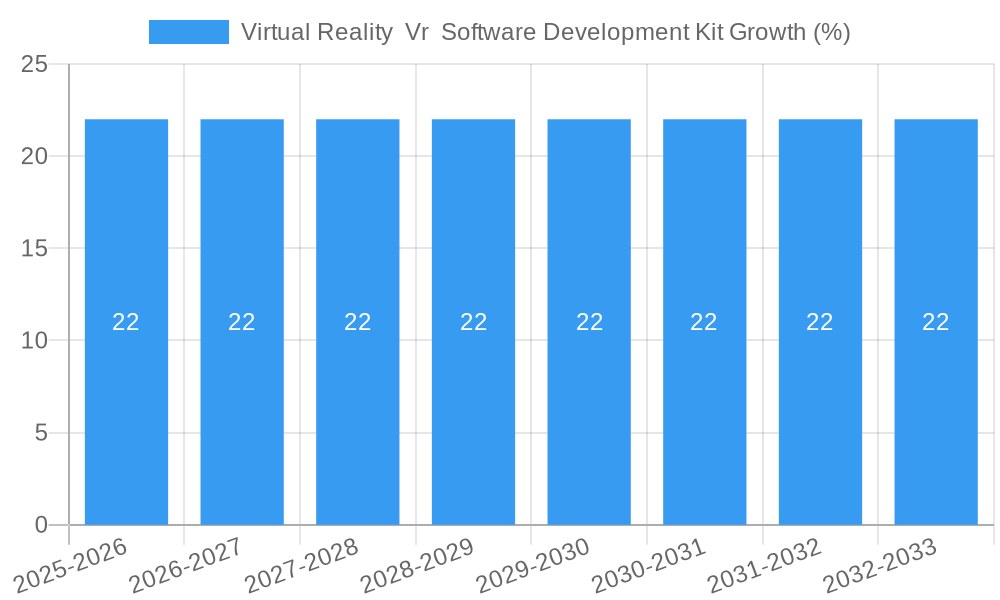
The Virtual Reality (VR) Software Development Kit (SDK) market is poised for significant expansion, driven by escalating adoption across diverse enterprise applications, from large corporations to small and medium-sized enterprises (SMEs). The global market size is estimated to reach approximately $2.5 billion in 2025, with a projected Compound Annual Growth Rate (CAGR) of around 22% through 2033. This robust growth is fueled by advancements in VR hardware, increasing demand for immersive training simulations, enhanced product visualization tools, and revolutionary advancements in remote collaboration. The proliferation of cloud-based VR SDK solutions is particularly noteworthy, offering greater accessibility, scalability, and cost-effectiveness, thereby accelerating adoption among a wider range of businesses. Furthermore, the growing maturity of on-premises solutions caters to organizations with stringent data security requirements or specialized hardware needs, ensuring a comprehensive market offering.
The VR SDK landscape is characterized by intense innovation and a dynamic competitive environment, with key players like Google, Autodesk, and NVIDIA leading the charge. Emerging trends include the integration of AI and machine learning for more intelligent and adaptive VR experiences, the development of cross-platform SDKs to broaden reach, and the increasing focus on user-friendly interfaces that democratize VR development. While the market's trajectory is overwhelmingly positive, potential restraints include the high initial cost of advanced VR hardware for some SMEs and the ongoing need for skilled developers to leverage the full potential of VR SDKs. However, the continuous refinement of SDK functionalities, coupled with a growing ecosystem of developers and content creators, is steadily mitigating these challenges, paving the way for widespread VR SDK utilization across industries such as manufacturing, healthcare, education, and entertainment.
Virtual Reality VR Software Development Kit Market: Comprehensive Analysis and Future Outlook (2019-2033)
This comprehensive report provides an in-depth analysis of the global Virtual Reality (VR) Software Development Kit (SDK) market, encompassing market dynamics, growth trends, regional dominance, product landscape, key drivers, barriers, emerging opportunities, growth accelerators, and a detailed outlook on the key players shaping this transformative industry. The study period spans from 2019 to 2033, with a base and estimated year of 2025 and a forecast period from 2025 to 2033.
Virtual Reality VR Software Development Kit Market Dynamics & Structure
The VR SDK market is characterized by a moderately concentrated structure, with key players investing heavily in technological innovation to capture market share. The relentless pursuit of enhanced immersive experiences, realistic graphics, and intuitive interaction models fuels this innovation. Regulatory frameworks, while nascent in some regions, are beginning to shape data privacy and content standards, indirectly influencing SDK development. Competitive product substitutes, such as advanced AR SDKs and integrated VR solutions, present a constant challenge, pushing VR SDK providers to differentiate through superior features and developer support. End-user demographics are expanding from early adopters and enterprise solutions to a broader consumer base, demanding user-friendly and versatile SDKs. Merger and acquisition (M&A) trends are on the rise as larger technology firms seek to integrate cutting-edge VR capabilities into their existing ecosystems. We anticipate approximately 10-15 significant M&A deals in the next five years, with an average deal valuation exceeding 50 million units. Innovation barriers include the high cost of R&D, the complexity of developing cross-platform compatibility, and the need for specialized engineering talent.
- Market Concentration: Moderately concentrated with key players like Google, NVIDIA, and Intel Corporation leading innovation.
- Technological Innovation Drivers: Demand for photorealistic graphics, low latency, haptic feedback integration, and AI-powered experiences.
- Regulatory Frameworks: Emerging data privacy regulations and content moderation policies are influencing SDK design and functionality.
- Competitive Product Substitutes: Advanced AR SDKs, game engines with VR capabilities, and proprietary VR platform SDKs.
- End-User Demographics: Diversifying from enterprise (Large Enterprises, SMEs) to consumer markets, requiring scalable and accessible solutions.
- M&A Trends: Increasing consolidation driven by strategic acquisitions to enhance VR/AR portfolios and expand market reach.
Virtual Reality VR Software Development Kit Growth Trends & Insights
The global VR SDK market is poised for substantial growth, driven by the increasing adoption of VR technologies across diverse sectors. Projections indicate a market size evolution from an estimated 3.5 billion units in 2025 to 12.8 billion units by 2033, exhibiting a robust Compound Annual Growth Rate (CAGR) of approximately 17.5% during the forecast period. Adoption rates are escalating as businesses recognize the potential of VR for training, simulation, design, and customer engagement. Technological disruptions, including advancements in headset technology, AI-driven content generation, and cloud-based VR rendering, are significantly influencing SDK development and adoption. Consumer behavior shifts, with a growing appetite for immersive entertainment and interactive experiences, are further fueling demand for user-friendly and powerful VR SDKs. Market penetration is expected to move beyond niche applications to mainstream adoption in education, healthcare, and retail. The increasing availability of affordable VR hardware is also a significant contributor to this growth trajectory.
- Market Size Evolution: Projected to grow from an estimated 3.5 billion units in 2025 to 12.8 billion units by 2033.
- Adoption Rates: Escalating across industries like gaming, manufacturing, healthcare, and education, signifying broad market acceptance.
- Technological Disruptions: Advancements in rendering techniques, AI integration for realistic avatars, and cross-platform compatibility are key disruptors.
- Consumer Behavior Shifts: Growing preference for interactive and immersive content driving demand for accessible VR development tools.
- Market Penetration: Moving from specialized enterprise applications to broader consumer and educational use cases.
- CAGR: An estimated 17.5% during the forecast period (2025-2033).
Dominant Regions, Countries, or Segments in Virtual Reality VR Software Development Kit
The Large Enterprises segment, within the Application category, is currently the dominant driver of the VR SDK market, accounting for an estimated 55% of market share in 2025. This dominance is attributed to significant investments in VR for sophisticated training simulations, product design and prototyping, and complex data visualization. Large enterprises leverage VR SDKs to create custom, high-fidelity experiences tailored to their specific operational needs, often integrating them with existing enterprise resource planning (ERP) and product lifecycle management (PLM) systems. The Cloud Based type of VR SDK deployment is also gaining substantial traction, estimated to capture 45% of the market by 2025. Cloud-based solutions offer scalability, reduced hardware dependency, and easier accessibility for development teams, aligning with the agile development methodologies adopted by many enterprises.
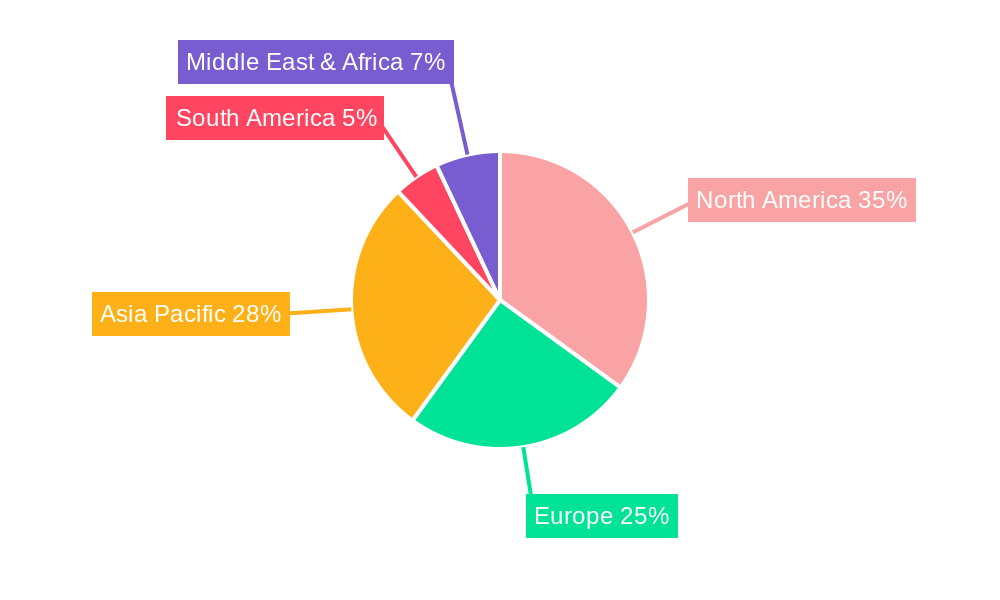
North America, particularly the United States, leads the global VR SDK market due to its strong technological infrastructure, a thriving ecosystem of VR/AR startups and established tech giants, and significant government and private sector investment in R&D. The presence of leading companies like Google, NVIDIA, and Intel Corporation, alongside a high concentration of innovative entities like Autodesk and Leap Motion, solidifies its leadership. The region’s robust gaming industry, coupled with the rapid adoption of VR in sectors like healthcare, automotive, and aerospace, further fuels demand for advanced VR SDKs. The market share for North America is estimated at 38% in 2025, with a projected growth potential of 19% in the forecast period.
- Dominant Segment (Application): Large Enterprises (estimated 55% market share in 2025)
- Key Drivers: High demand for custom training, complex simulations, product design, and data visualization.
- Market Share: Significant contribution due to substantial R&D budgets and strategic VR implementations.
- Dominant Type: Cloud Based (estimated 45% market share in 2025)
- Key Drivers: Scalability, accessibility, reduced infrastructure costs, and support for remote development teams.
- Dominant Region: North America (estimated 38% market share in 2025)
- Key Drivers: Strong technological infrastructure, presence of key industry players, substantial R&D investment, and diverse industry adoption.
- Growth Potential: Expected to grow at a rate of 19% during the forecast period.
Virtual Reality VR Software Development Kit Product Landscape
The VR SDK product landscape is continuously evolving, marked by innovations aimed at simplifying complex development processes and enhancing the fidelity of virtual experiences. Key advancements include cross-platform compatibility, allowing developers to deploy applications on multiple VR headsets and operating systems with minimal code changes. Furthermore, AI-driven tools are being integrated to automate aspects of scene creation, character animation, and user interaction, significantly reducing development time and costs. Performance optimization remains a critical focus, with SDKs offering improved rendering pipelines, efficient memory management, and robust support for advanced graphical features like real-time ray tracing, crucial for creating photorealistic environments. Unique selling propositions often revolve around the ease of integration with popular game engines like Unity and Unreal Engine, comprehensive asset libraries, and robust APIs that cater to both novice and experienced developers.
Key Drivers, Barriers & Challenges in Virtual Reality VR Software Development Kit
The VR SDK market is propelled by several key drivers. Technological advancements in computer vision, AI, and haptics are enabling more immersive and interactive experiences. Increasing adoption of VR in enterprise applications, such as training, simulation, and design, creates a consistent demand for sophisticated development tools. The growth of the gaming industry and the rising popularity of VR entertainment also contribute significantly. Furthermore, government initiatives and investments in XR technologies in various countries foster a supportive ecosystem for SDK development.
However, the market faces significant barriers and challenges. High development costs and the need for specialized expertise can deter smaller developers and SMEs. The fragmented VR hardware market with varying specifications and capabilities can complicate cross-platform development. Content creation complexity and the lack of standardized development practices also pose challenges. Supply chain issues related to VR hardware components can indirectly impact the demand for SDKs. Regulatory hurdles concerning data privacy and user safety in immersive environments are still evolving, creating uncertainty. Competitive pressures from established players and new entrants necessitate continuous innovation. The estimated impact of these challenges on market growth is around 10-15% reduction in potential revenue if not addressed.
Emerging Opportunities in Virtual Reality VR Software Development Kit
Emerging opportunities in the VR SDK market lie in several key areas. The growing demand for Metaverse development tools presents a significant untapped market, requiring SDKs that facilitate the creation of persistent, interoperable virtual worlds. The increasing adoption of VR in education and remote learning opens avenues for SDKs designed for educational content creation, interactive lesson plans, and virtual classrooms. Furthermore, AI-powered SDK features, such as generative AI for asset creation and intelligent NPC behavior, represent a substantial opportunity for differentiation. The expansion of enterprise solutions beyond traditional sectors, into areas like virtual tourism, remote collaboration, and digital twins, offers new use cases and revenue streams.
Growth Accelerators in the Virtual Reality VR Software Development Kit Industry
Several catalysts are driving long-term growth in the VR SDK industry. Technological breakthroughs in areas like foveated rendering, eye-tracking integration, and wireless VR connectivity are enhancing user experience and reducing development complexity. Strategic partnerships between SDK providers and hardware manufacturers, as well as content creators, are crucial for broadening market reach and accelerating adoption. Market expansion strategies targeting emerging economies and niche industries are vital for sustained growth. The development of more accessible and affordable SDKs is also a key accelerator, democratizing VR development.
Key Players Shaping the Virtual Reality VR Software Development Kit Market
- Autodesk
- Leap Motion
- A-Frame
- Intel Corporation
- OpenSpace 3D
- SmartVizX
- WorldViz
- NVIDIA
- Lakeba Group
- Virtalis
- CognitiveVR
- Dimension10
- eevo
- Hyprsense
- InstaVR
- Ascience
- Avid Technology
- Sixense Entertainment
- MARUI-PlugIn
- Masters of Pie
- Open Source Virtual Reality
- Sketchbox
- Snobal
- OVA
- StereoSense
- Dwayne Iserief
- Visual Camp
- Volograms
Notable Milestones in Virtual Reality VR Software Development Kit Sector
- 2020: Google releases ARCore updates to improve AR experiences on Android, influencing VR SDK integration.
- 2021: NVIDIA launches DLSS 2.0, significantly enhancing VR rendering performance and enabling more realistic visuals.
- 2022: Leap Motion (now Ultraleap) introduces new hand-tracking advancements, impacting intuitive VR interactions.
- 2023: A-Frame releases a major update focusing on performance improvements and expanded compatibility for web-based VR.
- 2024: Autodesk integrates advanced VR design tools within its broader software suite, highlighting enterprise adoption.
In-Depth Virtual Reality VR Software Development Kit Market Outlook
The future of the VR SDK market is exceptionally bright, fueled by a convergence of technological advancements and expanding market applications. Growth accelerators such as the development of more intuitive and AI-integrated SDKs, coupled with strategic collaborations, will propel widespread adoption. The anticipated increase in VR hardware accessibility and affordability will further democratize VR development. The burgeoning interest in the Metaverse and the increasing demand for sophisticated enterprise solutions across healthcare, education, and manufacturing signal significant future market potential. Companies that focus on offering robust cross-platform support, advanced performance optimization, and developer-friendly tools are best positioned to capitalize on these evolving market dynamics and secure substantial growth opportunities.
Virtual Reality Vr Software Development Kit Segmentation
-
1. Application
- 1.1. Large Enterprises
- 1.2. SMEs
-
2. Type
- 2.1. Cloud Based
- 2.2. On Premises
Virtual Reality Vr Software Development Kit Segmentation By Geography
-
1. North America
- 1.1. United States
- 1.2. Canada
- 1.3. Mexico
-
2. South America
- 2.1. Brazil
- 2.2. Argentina
- 2.3. Rest of South America
-
3. Europe
- 3.1. United Kingdom
- 3.2. Germany
- 3.3. France
- 3.4. Italy
- 3.5. Spain
- 3.6. Russia
- 3.7. Benelux
- 3.8. Nordics
- 3.9. Rest of Europe
-
4. Middle East & Africa
- 4.1. Turkey
- 4.2. Israel
- 4.3. GCC
- 4.4. North Africa
- 4.5. South Africa
- 4.6. Rest of Middle East & Africa
-
5. Asia Pacific
- 5.1. China
- 5.2. India
- 5.3. Japan
- 5.4. South Korea
- 5.5. ASEAN
- 5.6. Oceania
- 5.7. Rest of Asia Pacific
Virtual Reality Vr Software Development Kit REPORT HIGHLIGHTS
| Aspects | Details |
|---|---|
| Study Period | 2019-2033 |
| Base Year | 2024 |
| Estimated Year | 2025 |
| Forecast Period | 2025-2033 |
| Historical Period | 2019-2024 |
| Growth Rate | CAGR of XXX% from 2019-2033 |
| Segmentation |
|
Table of Contents
- 1. Introduction
- 1.1. Research Scope
- 1.2. Market Segmentation
- 1.3. Research Methodology
- 1.4. Definitions and Assumptions
- 2. Executive Summary
- 2.1. Introduction
- 3. Market Dynamics
- 3.1. Introduction
- 3.2. Market Drivers
- 3.3. Market Restrains
- 3.4. Market Trends
- 4. Market Factor Analysis
- 4.1. Porters Five Forces
- 4.2. Supply/Value Chain
- 4.3. PESTEL analysis
- 4.4. Market Entropy
- 4.5. Patent/Trademark Analysis
- 5. Global Virtual Reality Vr Software Development Kit Analysis, Insights and Forecast, 2019-2031
- 5.1. Market Analysis, Insights and Forecast - by Application
- 5.1.1. Large Enterprises
- 5.1.2. SMEs
- 5.2. Market Analysis, Insights and Forecast - by Type
- 5.2.1. Cloud Based
- 5.2.2. On Premises
- 5.3. Market Analysis, Insights and Forecast - by Region
- 5.3.1. North America
- 5.3.2. South America
- 5.3.3. Europe
- 5.3.4. Middle East & Africa
- 5.3.5. Asia Pacific
- 5.1. Market Analysis, Insights and Forecast - by Application
- 6. North America Virtual Reality Vr Software Development Kit Analysis, Insights and Forecast, 2019-2031
- 6.1. Market Analysis, Insights and Forecast - by Application
- 6.1.1. Large Enterprises
- 6.1.2. SMEs
- 6.2. Market Analysis, Insights and Forecast - by Type
- 6.2.1. Cloud Based
- 6.2.2. On Premises
- 6.1. Market Analysis, Insights and Forecast - by Application
- 7. South America Virtual Reality Vr Software Development Kit Analysis, Insights and Forecast, 2019-2031
- 7.1. Market Analysis, Insights and Forecast - by Application
- 7.1.1. Large Enterprises
- 7.1.2. SMEs
- 7.2. Market Analysis, Insights and Forecast - by Type
- 7.2.1. Cloud Based
- 7.2.2. On Premises
- 7.1. Market Analysis, Insights and Forecast - by Application
- 8. Europe Virtual Reality Vr Software Development Kit Analysis, Insights and Forecast, 2019-2031
- 8.1. Market Analysis, Insights and Forecast - by Application
- 8.1.1. Large Enterprises
- 8.1.2. SMEs
- 8.2. Market Analysis, Insights and Forecast - by Type
- 8.2.1. Cloud Based
- 8.2.2. On Premises
- 8.1. Market Analysis, Insights and Forecast - by Application
- 9. Middle East & Africa Virtual Reality Vr Software Development Kit Analysis, Insights and Forecast, 2019-2031
- 9.1. Market Analysis, Insights and Forecast - by Application
- 9.1.1. Large Enterprises
- 9.1.2. SMEs
- 9.2. Market Analysis, Insights and Forecast - by Type
- 9.2.1. Cloud Based
- 9.2.2. On Premises
- 9.1. Market Analysis, Insights and Forecast - by Application
- 10. Asia Pacific Virtual Reality Vr Software Development Kit Analysis, Insights and Forecast, 2019-2031
- 10.1. Market Analysis, Insights and Forecast - by Application
- 10.1.1. Large Enterprises
- 10.1.2. SMEs
- 10.2. Market Analysis, Insights and Forecast - by Type
- 10.2.1. Cloud Based
- 10.2.2. On Premises
- 10.1. Market Analysis, Insights and Forecast - by Application
- 11. Competitive Analysis
- 11.1. Global Market Share Analysis 2024
- 11.2. Company Profiles
- 11.2.1 Google
- 11.2.1.1. Overview
- 11.2.1.2. Products
- 11.2.1.3. SWOT Analysis
- 11.2.1.4. Recent Developments
- 11.2.1.5. Financials (Based on Availability)
- 11.2.2 Autodesk
- 11.2.2.1. Overview
- 11.2.2.2. Products
- 11.2.2.3. SWOT Analysis
- 11.2.2.4. Recent Developments
- 11.2.2.5. Financials (Based on Availability)
- 11.2.3 Leap Motion
- 11.2.3.1. Overview
- 11.2.3.2. Products
- 11.2.3.3. SWOT Analysis
- 11.2.3.4. Recent Developments
- 11.2.3.5. Financials (Based on Availability)
- 11.2.4 A-Frame
- 11.2.4.1. Overview
- 11.2.4.2. Products
- 11.2.4.3. SWOT Analysis
- 11.2.4.4. Recent Developments
- 11.2.4.5. Financials (Based on Availability)
- 11.2.5 Intel Corporation
- 11.2.5.1. Overview
- 11.2.5.2. Products
- 11.2.5.3. SWOT Analysis
- 11.2.5.4. Recent Developments
- 11.2.5.5. Financials (Based on Availability)
- 11.2.6 OpenSpace 3D
- 11.2.6.1. Overview
- 11.2.6.2. Products
- 11.2.6.3. SWOT Analysis
- 11.2.6.4. Recent Developments
- 11.2.6.5. Financials (Based on Availability)
- 11.2.7 SmartVizX
- 11.2.7.1. Overview
- 11.2.7.2. Products
- 11.2.7.3. SWOT Analysis
- 11.2.7.4. Recent Developments
- 11.2.7.5. Financials (Based on Availability)
- 11.2.8 WorldViz
- 11.2.8.1. Overview
- 11.2.8.2. Products
- 11.2.8.3. SWOT Analysis
- 11.2.8.4. Recent Developments
- 11.2.8.5. Financials (Based on Availability)
- 11.2.9 NVIDIA
- 11.2.9.1. Overview
- 11.2.9.2. Products
- 11.2.9.3. SWOT Analysis
- 11.2.9.4. Recent Developments
- 11.2.9.5. Financials (Based on Availability)
- 11.2.10 Lakeba Group
- 11.2.10.1. Overview
- 11.2.10.2. Products
- 11.2.10.3. SWOT Analysis
- 11.2.10.4. Recent Developments
- 11.2.10.5. Financials (Based on Availability)
- 11.2.11 Virtalis
- 11.2.11.1. Overview
- 11.2.11.2. Products
- 11.2.11.3. SWOT Analysis
- 11.2.11.4. Recent Developments
- 11.2.11.5. Financials (Based on Availability)
- 11.2.12 CognitiveVR
- 11.2.12.1. Overview
- 11.2.12.2. Products
- 11.2.12.3. SWOT Analysis
- 11.2.12.4. Recent Developments
- 11.2.12.5. Financials (Based on Availability)
- 11.2.13 Dimension10
- 11.2.13.1. Overview
- 11.2.13.2. Products
- 11.2.13.3. SWOT Analysis
- 11.2.13.4. Recent Developments
- 11.2.13.5. Financials (Based on Availability)
- 11.2.14 eevo
- 11.2.14.1. Overview
- 11.2.14.2. Products
- 11.2.14.3. SWOT Analysis
- 11.2.14.4. Recent Developments
- 11.2.14.5. Financials (Based on Availability)
- 11.2.15 Hyprsense
- 11.2.15.1. Overview
- 11.2.15.2. Products
- 11.2.15.3. SWOT Analysis
- 11.2.15.4. Recent Developments
- 11.2.15.5. Financials (Based on Availability)
- 11.2.16 InstaVR
- 11.2.16.1. Overview
- 11.2.16.2. Products
- 11.2.16.3. SWOT Analysis
- 11.2.16.4. Recent Developments
- 11.2.16.5. Financials (Based on Availability)
- 11.2.17 Ascience
- 11.2.17.1. Overview
- 11.2.17.2. Products
- 11.2.17.3. SWOT Analysis
- 11.2.17.4. Recent Developments
- 11.2.17.5. Financials (Based on Availability)
- 11.2.18 Avid Technology
- 11.2.18.1. Overview
- 11.2.18.2. Products
- 11.2.18.3. SWOT Analysis
- 11.2.18.4. Recent Developments
- 11.2.18.5. Financials (Based on Availability)
- 11.2.19 Sixense Entertainment
- 11.2.19.1. Overview
- 11.2.19.2. Products
- 11.2.19.3. SWOT Analysis
- 11.2.19.4. Recent Developments
- 11.2.19.5. Financials (Based on Availability)
- 11.2.20 MARUI-PlugIn
- 11.2.20.1. Overview
- 11.2.20.2. Products
- 11.2.20.3. SWOT Analysis
- 11.2.20.4. Recent Developments
- 11.2.20.5. Financials (Based on Availability)
- 11.2.21 Masters of Pie
- 11.2.21.1. Overview
- 11.2.21.2. Products
- 11.2.21.3. SWOT Analysis
- 11.2.21.4. Recent Developments
- 11.2.21.5. Financials (Based on Availability)
- 11.2.22 Open Source Virtual Reality
- 11.2.22.1. Overview
- 11.2.22.2. Products
- 11.2.22.3. SWOT Analysis
- 11.2.22.4. Recent Developments
- 11.2.22.5. Financials (Based on Availability)
- 11.2.23 Sketchbox
- 11.2.23.1. Overview
- 11.2.23.2. Products
- 11.2.23.3. SWOT Analysis
- 11.2.23.4. Recent Developments
- 11.2.23.5. Financials (Based on Availability)
- 11.2.24 Snobal
- 11.2.24.1. Overview
- 11.2.24.2. Products
- 11.2.24.3. SWOT Analysis
- 11.2.24.4. Recent Developments
- 11.2.24.5. Financials (Based on Availability)
- 11.2.25 OVA
- 11.2.25.1. Overview
- 11.2.25.2. Products
- 11.2.25.3. SWOT Analysis
- 11.2.25.4. Recent Developments
- 11.2.25.5. Financials (Based on Availability)
- 11.2.26 StereoSense
- 11.2.26.1. Overview
- 11.2.26.2. Products
- 11.2.26.3. SWOT Analysis
- 11.2.26.4. Recent Developments
- 11.2.26.5. Financials (Based on Availability)
- 11.2.27 Dwayne Iserief
- 11.2.27.1. Overview
- 11.2.27.2. Products
- 11.2.27.3. SWOT Analysis
- 11.2.27.4. Recent Developments
- 11.2.27.5. Financials (Based on Availability)
- 11.2.28 Visual Camp
- 11.2.28.1. Overview
- 11.2.28.2. Products
- 11.2.28.3. SWOT Analysis
- 11.2.28.4. Recent Developments
- 11.2.28.5. Financials (Based on Availability)
- 11.2.29 Volograms
- 11.2.29.1. Overview
- 11.2.29.2. Products
- 11.2.29.3. SWOT Analysis
- 11.2.29.4. Recent Developments
- 11.2.29.5. Financials (Based on Availability)
- 11.2.1 Google
List of Figures
- Figure 1: Global Virtual Reality Vr Software Development Kit Revenue Breakdown (million, %) by Region 2024 & 2032
- Figure 2: North America Virtual Reality Vr Software Development Kit Revenue (million), by Application 2024 & 2032
- Figure 3: North America Virtual Reality Vr Software Development Kit Revenue Share (%), by Application 2024 & 2032
- Figure 4: North America Virtual Reality Vr Software Development Kit Revenue (million), by Type 2024 & 2032
- Figure 5: North America Virtual Reality Vr Software Development Kit Revenue Share (%), by Type 2024 & 2032
- Figure 6: North America Virtual Reality Vr Software Development Kit Revenue (million), by Country 2024 & 2032
- Figure 7: North America Virtual Reality Vr Software Development Kit Revenue Share (%), by Country 2024 & 2032
- Figure 8: South America Virtual Reality Vr Software Development Kit Revenue (million), by Application 2024 & 2032
- Figure 9: South America Virtual Reality Vr Software Development Kit Revenue Share (%), by Application 2024 & 2032
- Figure 10: South America Virtual Reality Vr Software Development Kit Revenue (million), by Type 2024 & 2032
- Figure 11: South America Virtual Reality Vr Software Development Kit Revenue Share (%), by Type 2024 & 2032
- Figure 12: South America Virtual Reality Vr Software Development Kit Revenue (million), by Country 2024 & 2032
- Figure 13: South America Virtual Reality Vr Software Development Kit Revenue Share (%), by Country 2024 & 2032
- Figure 14: Europe Virtual Reality Vr Software Development Kit Revenue (million), by Application 2024 & 2032
- Figure 15: Europe Virtual Reality Vr Software Development Kit Revenue Share (%), by Application 2024 & 2032
- Figure 16: Europe Virtual Reality Vr Software Development Kit Revenue (million), by Type 2024 & 2032
- Figure 17: Europe Virtual Reality Vr Software Development Kit Revenue Share (%), by Type 2024 & 2032
- Figure 18: Europe Virtual Reality Vr Software Development Kit Revenue (million), by Country 2024 & 2032
- Figure 19: Europe Virtual Reality Vr Software Development Kit Revenue Share (%), by Country 2024 & 2032
- Figure 20: Middle East & Africa Virtual Reality Vr Software Development Kit Revenue (million), by Application 2024 & 2032
- Figure 21: Middle East & Africa Virtual Reality Vr Software Development Kit Revenue Share (%), by Application 2024 & 2032
- Figure 22: Middle East & Africa Virtual Reality Vr Software Development Kit Revenue (million), by Type 2024 & 2032
- Figure 23: Middle East & Africa Virtual Reality Vr Software Development Kit Revenue Share (%), by Type 2024 & 2032
- Figure 24: Middle East & Africa Virtual Reality Vr Software Development Kit Revenue (million), by Country 2024 & 2032
- Figure 25: Middle East & Africa Virtual Reality Vr Software Development Kit Revenue Share (%), by Country 2024 & 2032
- Figure 26: Asia Pacific Virtual Reality Vr Software Development Kit Revenue (million), by Application 2024 & 2032
- Figure 27: Asia Pacific Virtual Reality Vr Software Development Kit Revenue Share (%), by Application 2024 & 2032
- Figure 28: Asia Pacific Virtual Reality Vr Software Development Kit Revenue (million), by Type 2024 & 2032
- Figure 29: Asia Pacific Virtual Reality Vr Software Development Kit Revenue Share (%), by Type 2024 & 2032
- Figure 30: Asia Pacific Virtual Reality Vr Software Development Kit Revenue (million), by Country 2024 & 2032
- Figure 31: Asia Pacific Virtual Reality Vr Software Development Kit Revenue Share (%), by Country 2024 & 2032
List of Tables
- Table 1: Global Virtual Reality Vr Software Development Kit Revenue million Forecast, by Region 2019 & 2032
- Table 2: Global Virtual Reality Vr Software Development Kit Revenue million Forecast, by Application 2019 & 2032
- Table 3: Global Virtual Reality Vr Software Development Kit Revenue million Forecast, by Type 2019 & 2032
- Table 4: Global Virtual Reality Vr Software Development Kit Revenue million Forecast, by Region 2019 & 2032
- Table 5: Global Virtual Reality Vr Software Development Kit Revenue million Forecast, by Application 2019 & 2032
- Table 6: Global Virtual Reality Vr Software Development Kit Revenue million Forecast, by Type 2019 & 2032
- Table 7: Global Virtual Reality Vr Software Development Kit Revenue million Forecast, by Country 2019 & 2032
- Table 8: United States Virtual Reality Vr Software Development Kit Revenue (million) Forecast, by Application 2019 & 2032
- Table 9: Canada Virtual Reality Vr Software Development Kit Revenue (million) Forecast, by Application 2019 & 2032
- Table 10: Mexico Virtual Reality Vr Software Development Kit Revenue (million) Forecast, by Application 2019 & 2032
- Table 11: Global Virtual Reality Vr Software Development Kit Revenue million Forecast, by Application 2019 & 2032
- Table 12: Global Virtual Reality Vr Software Development Kit Revenue million Forecast, by Type 2019 & 2032
- Table 13: Global Virtual Reality Vr Software Development Kit Revenue million Forecast, by Country 2019 & 2032
- Table 14: Brazil Virtual Reality Vr Software Development Kit Revenue (million) Forecast, by Application 2019 & 2032
- Table 15: Argentina Virtual Reality Vr Software Development Kit Revenue (million) Forecast, by Application 2019 & 2032
- Table 16: Rest of South America Virtual Reality Vr Software Development Kit Revenue (million) Forecast, by Application 2019 & 2032
- Table 17: Global Virtual Reality Vr Software Development Kit Revenue million Forecast, by Application 2019 & 2032
- Table 18: Global Virtual Reality Vr Software Development Kit Revenue million Forecast, by Type 2019 & 2032
- Table 19: Global Virtual Reality Vr Software Development Kit Revenue million Forecast, by Country 2019 & 2032
- Table 20: United Kingdom Virtual Reality Vr Software Development Kit Revenue (million) Forecast, by Application 2019 & 2032
- Table 21: Germany Virtual Reality Vr Software Development Kit Revenue (million) Forecast, by Application 2019 & 2032
- Table 22: France Virtual Reality Vr Software Development Kit Revenue (million) Forecast, by Application 2019 & 2032
- Table 23: Italy Virtual Reality Vr Software Development Kit Revenue (million) Forecast, by Application 2019 & 2032
- Table 24: Spain Virtual Reality Vr Software Development Kit Revenue (million) Forecast, by Application 2019 & 2032
- Table 25: Russia Virtual Reality Vr Software Development Kit Revenue (million) Forecast, by Application 2019 & 2032
- Table 26: Benelux Virtual Reality Vr Software Development Kit Revenue (million) Forecast, by Application 2019 & 2032
- Table 27: Nordics Virtual Reality Vr Software Development Kit Revenue (million) Forecast, by Application 2019 & 2032
- Table 28: Rest of Europe Virtual Reality Vr Software Development Kit Revenue (million) Forecast, by Application 2019 & 2032
- Table 29: Global Virtual Reality Vr Software Development Kit Revenue million Forecast, by Application 2019 & 2032
- Table 30: Global Virtual Reality Vr Software Development Kit Revenue million Forecast, by Type 2019 & 2032
- Table 31: Global Virtual Reality Vr Software Development Kit Revenue million Forecast, by Country 2019 & 2032
- Table 32: Turkey Virtual Reality Vr Software Development Kit Revenue (million) Forecast, by Application 2019 & 2032
- Table 33: Israel Virtual Reality Vr Software Development Kit Revenue (million) Forecast, by Application 2019 & 2032
- Table 34: GCC Virtual Reality Vr Software Development Kit Revenue (million) Forecast, by Application 2019 & 2032
- Table 35: North Africa Virtual Reality Vr Software Development Kit Revenue (million) Forecast, by Application 2019 & 2032
- Table 36: South Africa Virtual Reality Vr Software Development Kit Revenue (million) Forecast, by Application 2019 & 2032
- Table 37: Rest of Middle East & Africa Virtual Reality Vr Software Development Kit Revenue (million) Forecast, by Application 2019 & 2032
- Table 38: Global Virtual Reality Vr Software Development Kit Revenue million Forecast, by Application 2019 & 2032
- Table 39: Global Virtual Reality Vr Software Development Kit Revenue million Forecast, by Type 2019 & 2032
- Table 40: Global Virtual Reality Vr Software Development Kit Revenue million Forecast, by Country 2019 & 2032
- Table 41: China Virtual Reality Vr Software Development Kit Revenue (million) Forecast, by Application 2019 & 2032
- Table 42: India Virtual Reality Vr Software Development Kit Revenue (million) Forecast, by Application 2019 & 2032
- Table 43: Japan Virtual Reality Vr Software Development Kit Revenue (million) Forecast, by Application 2019 & 2032
- Table 44: South Korea Virtual Reality Vr Software Development Kit Revenue (million) Forecast, by Application 2019 & 2032
- Table 45: ASEAN Virtual Reality Vr Software Development Kit Revenue (million) Forecast, by Application 2019 & 2032
- Table 46: Oceania Virtual Reality Vr Software Development Kit Revenue (million) Forecast, by Application 2019 & 2032
- Table 47: Rest of Asia Pacific Virtual Reality Vr Software Development Kit Revenue (million) Forecast, by Application 2019 & 2032
Frequently Asked Questions
1. What is the projected Compound Annual Growth Rate (CAGR) of the Virtual Reality Vr Software Development Kit?
The projected CAGR is approximately XXX%.
2. Which companies are prominent players in the Virtual Reality Vr Software Development Kit?
Key companies in the market include Google, Autodesk, Leap Motion, A-Frame, Intel Corporation, OpenSpace 3D, SmartVizX, WorldViz, NVIDIA, Lakeba Group, Virtalis, CognitiveVR, Dimension10, eevo, Hyprsense, InstaVR, Ascience, Avid Technology, Sixense Entertainment, MARUI-PlugIn, Masters of Pie, Open Source Virtual Reality, Sketchbox, Snobal, OVA, StereoSense, Dwayne Iserief, Visual Camp, Volograms.
3. What are the main segments of the Virtual Reality Vr Software Development Kit?
The market segments include Application, Type.
4. Can you provide details about the market size?
The market size is estimated to be USD XXX million as of 2022.
5. What are some drivers contributing to market growth?
N/A
6. What are the notable trends driving market growth?
N/A
7. Are there any restraints impacting market growth?
N/A
8. Can you provide examples of recent developments in the market?
N/A
9. What pricing options are available for accessing the report?
Pricing options include single-user, multi-user, and enterprise licenses priced at USD 3950.00, USD 5925.00, and USD 7900.00 respectively.
10. Is the market size provided in terms of value or volume?
The market size is provided in terms of value, measured in million.
11. Are there any specific market keywords associated with the report?
Yes, the market keyword associated with the report is "Virtual Reality Vr Software Development Kit," which aids in identifying and referencing the specific market segment covered.
12. How do I determine which pricing option suits my needs best?
The pricing options vary based on user requirements and access needs. Individual users may opt for single-user licenses, while businesses requiring broader access may choose multi-user or enterprise licenses for cost-effective access to the report.
13. Are there any additional resources or data provided in the Virtual Reality Vr Software Development Kit report?
While the report offers comprehensive insights, it's advisable to review the specific contents or supplementary materials provided to ascertain if additional resources or data are available.
14. How can I stay updated on further developments or reports in the Virtual Reality Vr Software Development Kit?
To stay informed about further developments, trends, and reports in the Virtual Reality Vr Software Development Kit, consider subscribing to industry newsletters, following relevant companies and organizations, or regularly checking reputable industry news sources and publications.
Methodology
Step 1 - Identification of Relevant Samples Size from Population Database


Step 2 - Approaches for Defining Global Market Size (Value, Volume* & Price*)

Note*: In applicable scenarios
Step 3 - Data Sources
Primary Research
- Web Analytics
- Survey Reports
- Research Institute
- Latest Research Reports
- Opinion Leaders
Secondary Research
- Annual Reports
- White Paper
- Latest Press Release
- Industry Association
- Paid Database
- Investor Presentations

Step 4 - Data Triangulation
Involves using different sources of information in order to increase the validity of a study
These sources are likely to be stakeholders in a program - participants, other researchers, program staff, other community members, and so on.
Then we put all data in single framework & apply various statistical tools to find out the dynamic on the market.
During the analysis stage, feedback from the stakeholder groups would be compared to determine areas of agreement as well as areas of divergence
