

Key Insights
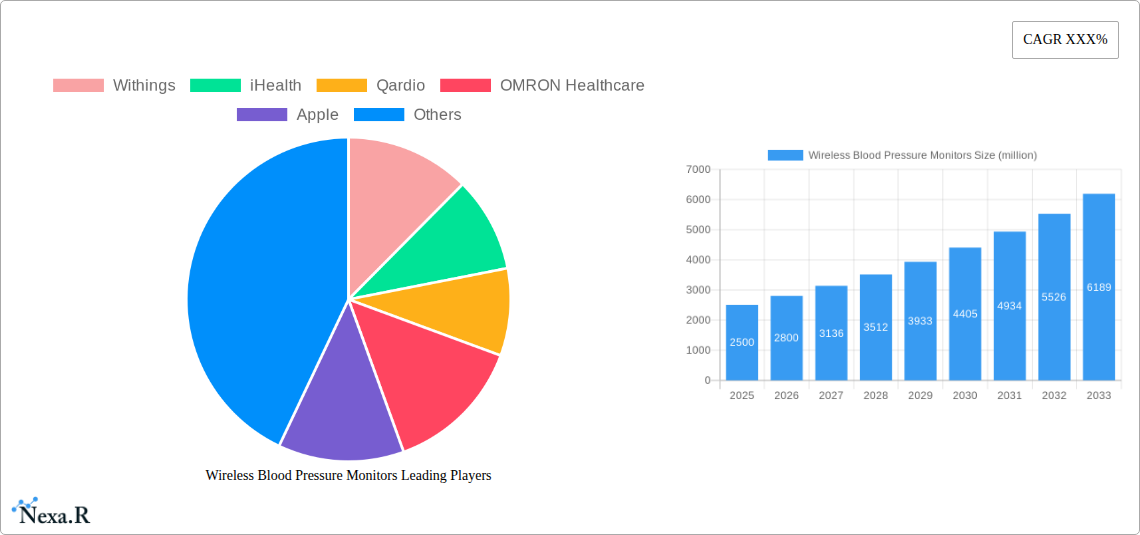
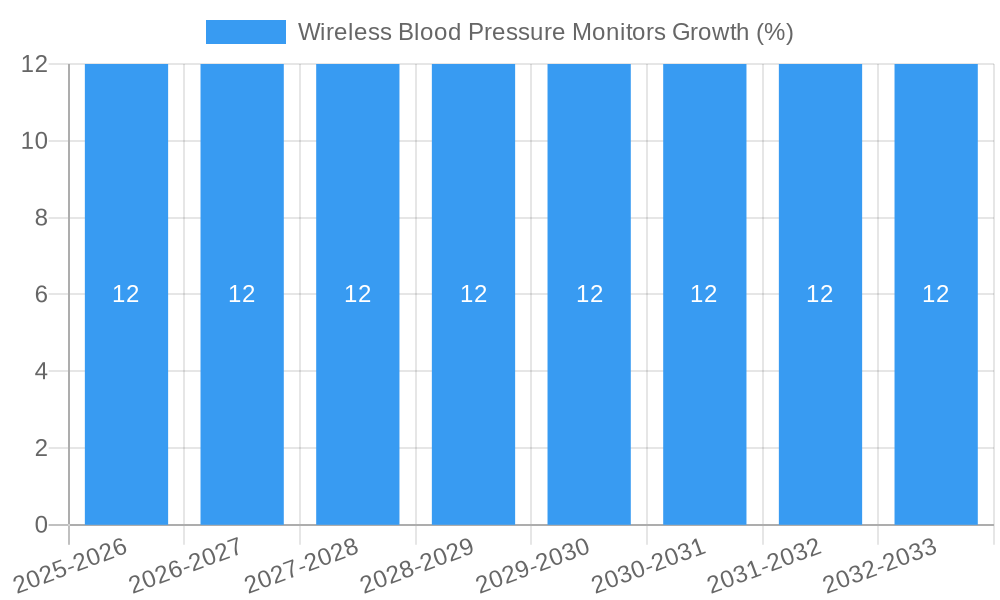
The global Wireless Blood Pressure Monitor market is poised for substantial growth, estimated at approximately $2,500 million in 2025, and is projected to expand at a Compound Annual Growth Rate (CAGR) of around 12% throughout the forecast period of 2025-2033. This robust expansion is fueled by several key drivers, including the escalating global prevalence of hypertension and cardiovascular diseases, a growing awareness among individuals regarding proactive health management, and the increasing adoption of remote patient monitoring solutions by healthcare providers. Furthermore, advancements in wireless connectivity technologies, such as Wi-Fi and Bluetooth, coupled with the development of user-friendly and accurate digital blood pressure devices, are significantly contributing to market penetration. The convenience and portability offered by these devices empower individuals to monitor their health conveniently from home, reducing the need for frequent clinic visits and fostering a more continuous approach to cardiovascular health management.
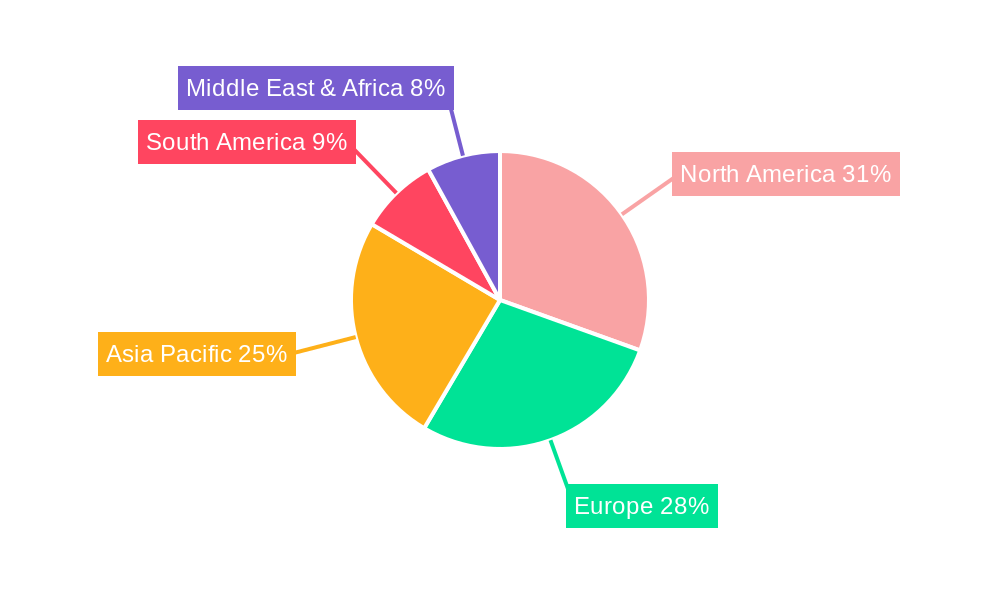
The market is segmented into two primary application areas: Hospitals and Clinics, and Home use. The Home segment is anticipated to witness the most dynamic growth due to the rising trend of telehealth and the increasing demand for self-monitoring devices. Within the Type segment, both Wi-Fi and Bluetooth Blood Pressure Monitors are gaining traction, with Bluetooth devices currently holding a significant market share due to their widespread compatibility with smartphones and other personal devices. Key players like Withings, iHealth, Qardio, OMRON Healthcare, and Apple are at the forefront of innovation, introducing sophisticated devices with advanced features such as data synchronization, personalized health insights, and integration with broader health ecosystems. While the market enjoys strong growth, potential restraints include the initial cost of advanced devices and the need for greater consumer education on the benefits and proper usage of wireless blood pressure monitoring technology. The Asia Pacific region, driven by a large population base and increasing healthcare expenditure, alongside North America and Europe, are expected to be major revenue contributors.
Wireless Blood Pressure Monitors Market Dynamics & Structure
The global wireless blood pressure monitors market exhibits a moderate to high concentration, driven by the increasing prevalence of cardiovascular diseases and the growing adoption of remote patient monitoring. Technological innovation, particularly in miniaturization and connectivity, acts as a significant driver, enabling seamless data transmission and integration with healthcare platforms. Regulatory frameworks, such as FDA approvals and CE marking, are crucial for market entry and consumer trust, influencing product development and market access. Competitive product substitutes include traditional, wired blood pressure monitors, though their market share is steadily declining. End-user demographics are shifting towards a tech-savvy population seeking convenient, at-home health management solutions. Mergers and acquisitions (M&A) are active, with larger players acquiring innovative startups to expand their product portfolios and market reach.
- Market Concentration: Moderate to High
- Key Technology Drivers: Miniaturization, Bluetooth LE, Wi-Fi, AI-powered analytics
- Regulatory Influence: FDA, CE Mark, HIPAA compliance
- Competitive Substitutes: Wired BP monitors, manual measurement
- End-User Shift: From clinical to home-based monitoring
- M&A Activity: Driven by product diversification and market expansion
Wireless Blood Pressure Monitors Growth Trends & Insights
The global wireless blood pressure monitors market is poised for substantial growth, projected to expand from approximately 750 million units in 2024 to over 1800 million units by 2033, demonstrating a compound annual growth rate (CAGR) of roughly 10.5%. This robust expansion is fueled by a confluence of factors, including the escalating global burden of hypertension and other cardiovascular ailments, coupled with a paradigm shift in healthcare delivery towards proactive, preventative, and personalized medicine. The increasing penetration of smartphones and wearable technology further complements the adoption of these devices, offering users an integrated approach to health tracking.
Technological advancements are at the forefront of this growth trajectory. The evolution from basic Bluetooth connectivity to more sophisticated Wi-Fi enabled devices facilitates real-time data synchronization with cloud-based platforms, enabling healthcare providers to remotely monitor patient vitals and intervene proactively. The integration of AI and machine learning algorithms within these devices promises enhanced diagnostic capabilities and personalized health insights, moving beyond simple measurement to actionable health recommendations. This technological sophistication is crucial for driving adoption rates, which are projected to witness a significant upward trend, particularly in developed economies.
Consumer behavior is also undergoing a transformative shift. A growing awareness among individuals about the importance of regular health monitoring, driven by public health campaigns and increased access to health information online, is empowering consumers to take a more active role in managing their well-being. The convenience of at-home monitoring, eliminating the need for frequent clinic visits, particularly appeals to aging populations and individuals with chronic conditions. Furthermore, the younger demographic, being digitally native, readily embraces connected health devices that seamlessly integrate into their lifestyle. This evolving consumer preference for convenience, data-driven insights, and proactive health management is a critical determinant of market growth.
The parent market for blood pressure monitors, encompassing both wired and wireless variants, is estimated at 2500 million units in 2025, with wireless devices accounting for approximately 60% of this figure. The child market, focusing on advanced features like AI integration and multi-parameter monitoring, is in its nascent stages but expected to witness exponential growth, reaching an estimated 300 million units by 2033. The increasing affordability and accessibility of wireless blood pressure monitors, coupled with favorable reimbursement policies for remote patient monitoring, will continue to drive market penetration across diverse socio-economic segments.
Dominant Regions, Countries, or Segments in Wireless Blood Pressure Monitors
The global wireless blood pressure monitors market is experiencing significant growth across various regions, with North America currently leading in terms of market share and adoption, driven by a combination of high disposable income, advanced healthcare infrastructure, and a strong emphasis on preventative healthcare. The United States, in particular, is a dominant country within this region, fueled by a high prevalence of hypertension and early adoption of connected health devices. Favorable reimbursement policies for remote patient monitoring services further bolster the market’s expansion in this nation.
In terms of application, the Home segment is the most dominant, accounting for approximately 70% of the global market. This dominance is attributed to the increasing preference for convenient, self-managed healthcare solutions, the growing aging population, and the rising awareness of cardiovascular health among individuals. The ease of use and the ability to track vital signs consistently without frequent doctor visits make home monitoring highly attractive. The Hospital and Clinic segments, while significant, are gradually integrating wireless devices to enhance patient care and streamline data management, but the sheer volume of individual users in the home setting propels this segment to the forefront.
Analyzing the technology types, Bluetooth Blood Pressure Monitors currently hold the largest market share, estimated at around 65% of the wireless segment. This is due to their established presence, wider compatibility with a vast array of smartphones and tablets, and generally lower price point compared to Wi-Fi enabled devices. However, Wi-Fi Blood Pressure Monitors are rapidly gaining traction, projected to witness a higher CAGR of approximately 12% over the forecast period, driven by their ability to offer continuous, uninterrupted data synchronization without the need for a smartphone to be in proximity, facilitating more seamless remote patient monitoring. The market penetration for Wi-Fi models is expected to grow from 35% in 2025 to over 50% by 2033.
Key drivers for dominance in these segments include strong economic policies that support healthcare innovation and digital health adoption, robust internet infrastructure enabling seamless connectivity, and proactive government initiatives promoting public health awareness and disease management. The presence of leading market players and a competitive landscape also fosters innovation and drives market growth. For instance, the increasing number of chronic disease management programs in countries like Canada and Mexico is also contributing to the growth of the home monitoring segment. The projected market size for home-use wireless blood pressure monitors is expected to reach over 1200 million units by 2033.
Wireless Blood Pressure Monitors Product Landscape
The wireless blood pressure monitor product landscape is characterized by continuous innovation focused on user convenience, data accuracy, and enhanced connectivity. Devices are increasingly incorporating advanced features such as irregular heartbeat detection, multiple user profiles, and integration with cloud-based health management platforms. Unique selling propositions include sleek, portable designs, long battery life, and intuitive mobile applications that provide detailed historical data, trend analysis, and personalized health insights. Technological advancements range from improved cuff designs for accurate readings across diverse arm sizes to the integration of AI for predictive health analytics, distinguishing premium offerings from standard devices.
Key Drivers, Barriers & Challenges in Wireless Blood Pressure Monitors
Key Drivers:
- Rising Cardiovascular Disease Prevalence: Growing global incidence of hypertension and heart disease necessitates continuous monitoring.
- Technological Advancements: Enhanced connectivity (Bluetooth, Wi-Fi), miniaturization, and AI integration drive adoption.
- Growing Health Consciousness: Increased public awareness and desire for proactive health management.
- Remote Patient Monitoring (RPM) Initiatives: Government and private sector focus on telehealth and RPM solutions.
- Aging Population: Elderly individuals benefit from convenient at-home monitoring solutions.
Key Barriers & Challenges:
- Data Security and Privacy Concerns: Ensuring the confidentiality of sensitive health data transmitted wirelessly.
- Interoperability Issues: Lack of standardized data formats can hinder seamless integration with diverse EMR/EHR systems.
- Regulatory Hurdles: Obtaining approvals from various health authorities can be time-consuming and costly.
- Affordability and Accessibility: While decreasing, the cost of advanced devices can still be a barrier in some markets.
- Accuracy and Calibration: Ensuring consistent accuracy and user education on proper usage to avoid misinterpretation of readings.
- Supply Chain Disruptions: Global events can impact the availability of components and finished products.
Emerging Opportunities in Wireless Blood Pressure Monitors
Emerging opportunities in the wireless blood pressure monitors sector lie in the development of multi-parameter health tracking devices that integrate blood pressure monitoring with other vital signs such as SpO2, temperature, and ECG. Untapped markets in developing economies present significant growth potential as awareness and affordability increase. Innovative applications in corporate wellness programs and personalized health coaching platforms are also gaining traction. Evolving consumer preferences for holistic health management solutions will drive demand for integrated and user-friendly devices that offer actionable insights beyond raw data. The increasing demand for predictive health analytics will also fuel opportunities for devices capable of early disease detection and risk assessment.
Growth Accelerators in the Wireless Blood Pressure Monitors Industry
Long-term growth in the wireless blood pressure monitors industry will be significantly accelerated by breakthroughs in miniaturized sensor technology, enabling even more discreet and wearable devices. Strategic partnerships between medical device manufacturers, technology companies, and healthcare providers will foster innovation and expand market reach. Market expansion strategies focusing on emerging economies, coupled with efforts to improve affordability and digital literacy, will unlock vast new customer bases. The continued development of robust, secure cloud infrastructure for data management and AI-powered analytics will further enhance the value proposition of these devices, driving sustained adoption and market penetration.
Key Players Shaping the Wireless Blood Pressure Monitors Market
- Withings
- iHealth
- Qardio
- OMRON Healthcare
- Apple
- Pyle Audio
- Xiaomi
- Panasonic
- GE Healthcare
- Philips
- Biggs Healthcare
- Veridian Healthcare
- Smart Health
- Littmann
- Telcomed
Notable Milestones in Wireless Blood Pressure Monitors Sector
- 2019: Increased adoption of AI for anomaly detection in BP readings.
- 2020: Significant surge in home monitoring devices due to the global pandemic.
- 2021: Enhanced Bluetooth 5.0 integration for improved connectivity and data transfer speed.
- 2022: Emergence of Wi-Fi enabled monitors with direct cloud connectivity.
- 2023: Advancements in cuffless BP monitoring technology research.
- 2024: Growing integration with telehealth platforms and EHR systems.
In-Depth Wireless Blood Pressure Monitors Market Outlook
The in-depth outlook for the wireless blood pressure monitors market is exceptionally promising, driven by continuous technological innovation and evolving consumer behavior. Growth accelerators will focus on smart integration, where devices offer more than just readings, providing personalized health coaching and predictive analytics, thus elevating their role in chronic disease management. Strategic partnerships will be key to expanding access in underserved markets and developing comprehensive remote patient monitoring ecosystems. The market's future trajectory is characterized by an increasing shift towards preventative healthcare, where wireless blood pressure monitors will serve as indispensable tools for empowering individuals to take control of their cardiovascular health and enabling healthcare providers to deliver more proactive and personalized care, leading to substantial expansion in both unit sales and market value.
Wireless Blood Pressure Monitors Segmentation
-
1. Application
- 1.1. Hospital
- 1.2. Clinic
- 1.3. Home
-
2. Type
- 2.1. Wi-Fi Blood Pressure Monitors
- 2.2. Bluetooth Blood Pressure Monitors
Wireless Blood Pressure Monitors Segmentation By Geography
-
1. North America
- 1.1. United States
- 1.2. Canada
- 1.3. Mexico
-
2. South America
- 2.1. Brazil
- 2.2. Argentina
- 2.3. Rest of South America
-
3. Europe
- 3.1. United Kingdom
- 3.2. Germany
- 3.3. France
- 3.4. Italy
- 3.5. Spain
- 3.6. Russia
- 3.7. Benelux
- 3.8. Nordics
- 3.9. Rest of Europe
-
4. Middle East & Africa
- 4.1. Turkey
- 4.2. Israel
- 4.3. GCC
- 4.4. North Africa
- 4.5. South Africa
- 4.6. Rest of Middle East & Africa
-
5. Asia Pacific
- 5.1. China
- 5.2. India
- 5.3. Japan
- 5.4. South Korea
- 5.5. ASEAN
- 5.6. Oceania
- 5.7. Rest of Asia Pacific
Wireless Blood Pressure Monitors REPORT HIGHLIGHTS
| Aspects | Details |
|---|---|
| Study Period | 2019-2033 |
| Base Year | 2024 |
| Estimated Year | 2025 |
| Forecast Period | 2025-2033 |
| Historical Period | 2019-2024 |
| Growth Rate | CAGR of XXX% from 2019-2033 |
| Segmentation |
|
Table of Contents
- 1. Introduction
- 1.1. Research Scope
- 1.2. Market Segmentation
- 1.3. Research Methodology
- 1.4. Definitions and Assumptions
- 2. Executive Summary
- 2.1. Introduction
- 3. Market Dynamics
- 3.1. Introduction
- 3.2. Market Drivers
- 3.3. Market Restrains
- 3.4. Market Trends
- 4. Market Factor Analysis
- 4.1. Porters Five Forces
- 4.2. Supply/Value Chain
- 4.3. PESTEL analysis
- 4.4. Market Entropy
- 4.5. Patent/Trademark Analysis
- 5. Global Wireless Blood Pressure Monitors Analysis, Insights and Forecast, 2019-2031
- 5.1. Market Analysis, Insights and Forecast - by Application
- 5.1.1. Hospital
- 5.1.2. Clinic
- 5.1.3. Home
- 5.2. Market Analysis, Insights and Forecast - by Type
- 5.2.1. Wi-Fi Blood Pressure Monitors
- 5.2.2. Bluetooth Blood Pressure Monitors
- 5.3. Market Analysis, Insights and Forecast - by Region
- 5.3.1. North America
- 5.3.2. South America
- 5.3.3. Europe
- 5.3.4. Middle East & Africa
- 5.3.5. Asia Pacific
- 5.1. Market Analysis, Insights and Forecast - by Application
- 6. North America Wireless Blood Pressure Monitors Analysis, Insights and Forecast, 2019-2031
- 6.1. Market Analysis, Insights and Forecast - by Application
- 6.1.1. Hospital
- 6.1.2. Clinic
- 6.1.3. Home
- 6.2. Market Analysis, Insights and Forecast - by Type
- 6.2.1. Wi-Fi Blood Pressure Monitors
- 6.2.2. Bluetooth Blood Pressure Monitors
- 6.1. Market Analysis, Insights and Forecast - by Application
- 7. South America Wireless Blood Pressure Monitors Analysis, Insights and Forecast, 2019-2031
- 7.1. Market Analysis, Insights and Forecast - by Application
- 7.1.1. Hospital
- 7.1.2. Clinic
- 7.1.3. Home
- 7.2. Market Analysis, Insights and Forecast - by Type
- 7.2.1. Wi-Fi Blood Pressure Monitors
- 7.2.2. Bluetooth Blood Pressure Monitors
- 7.1. Market Analysis, Insights and Forecast - by Application
- 8. Europe Wireless Blood Pressure Monitors Analysis, Insights and Forecast, 2019-2031
- 8.1. Market Analysis, Insights and Forecast - by Application
- 8.1.1. Hospital
- 8.1.2. Clinic
- 8.1.3. Home
- 8.2. Market Analysis, Insights and Forecast - by Type
- 8.2.1. Wi-Fi Blood Pressure Monitors
- 8.2.2. Bluetooth Blood Pressure Monitors
- 8.1. Market Analysis, Insights and Forecast - by Application
- 9. Middle East & Africa Wireless Blood Pressure Monitors Analysis, Insights and Forecast, 2019-2031
- 9.1. Market Analysis, Insights and Forecast - by Application
- 9.1.1. Hospital
- 9.1.2. Clinic
- 9.1.3. Home
- 9.2. Market Analysis, Insights and Forecast - by Type
- 9.2.1. Wi-Fi Blood Pressure Monitors
- 9.2.2. Bluetooth Blood Pressure Monitors
- 9.1. Market Analysis, Insights and Forecast - by Application
- 10. Asia Pacific Wireless Blood Pressure Monitors Analysis, Insights and Forecast, 2019-2031
- 10.1. Market Analysis, Insights and Forecast - by Application
- 10.1.1. Hospital
- 10.1.2. Clinic
- 10.1.3. Home
- 10.2. Market Analysis, Insights and Forecast - by Type
- 10.2.1. Wi-Fi Blood Pressure Monitors
- 10.2.2. Bluetooth Blood Pressure Monitors
- 10.1. Market Analysis, Insights and Forecast - by Application
- 11. Competitive Analysis
- 11.1. Global Market Share Analysis 2024
- 11.2. Company Profiles
- 11.2.1 Withings
- 11.2.1.1. Overview
- 11.2.1.2. Products
- 11.2.1.3. SWOT Analysis
- 11.2.1.4. Recent Developments
- 11.2.1.5. Financials (Based on Availability)
- 11.2.2 iHealth
- 11.2.2.1. Overview
- 11.2.2.2. Products
- 11.2.2.3. SWOT Analysis
- 11.2.2.4. Recent Developments
- 11.2.2.5. Financials (Based on Availability)
- 11.2.3 Qardio
- 11.2.3.1. Overview
- 11.2.3.2. Products
- 11.2.3.3. SWOT Analysis
- 11.2.3.4. Recent Developments
- 11.2.3.5. Financials (Based on Availability)
- 11.2.4 OMRON Healthcare
- 11.2.4.1. Overview
- 11.2.4.2. Products
- 11.2.4.3. SWOT Analysis
- 11.2.4.4. Recent Developments
- 11.2.4.5. Financials (Based on Availability)
- 11.2.5 Apple
- 11.2.5.1. Overview
- 11.2.5.2. Products
- 11.2.5.3. SWOT Analysis
- 11.2.5.4. Recent Developments
- 11.2.5.5. Financials (Based on Availability)
- 11.2.6 Pyle Audio
- 11.2.6.1. Overview
- 11.2.6.2. Products
- 11.2.6.3. SWOT Analysis
- 11.2.6.4. Recent Developments
- 11.2.6.5. Financials (Based on Availability)
- 11.2.7 Xiaomi
- 11.2.7.1. Overview
- 11.2.7.2. Products
- 11.2.7.3. SWOT Analysis
- 11.2.7.4. Recent Developments
- 11.2.7.5. Financials (Based on Availability)
- 11.2.8 Panasonic
- 11.2.8.1. Overview
- 11.2.8.2. Products
- 11.2.8.3. SWOT Analysis
- 11.2.8.4. Recent Developments
- 11.2.8.5. Financials (Based on Availability)
- 11.2.9 GE Healthcare
- 11.2.9.1. Overview
- 11.2.9.2. Products
- 11.2.9.3. SWOT Analysis
- 11.2.9.4. Recent Developments
- 11.2.9.5. Financials (Based on Availability)
- 11.2.10 Philips
- 11.2.10.1. Overview
- 11.2.10.2. Products
- 11.2.10.3. SWOT Analysis
- 11.2.10.4. Recent Developments
- 11.2.10.5. Financials (Based on Availability)
- 11.2.11 Biggs Healthcare
- 11.2.11.1. Overview
- 11.2.11.2. Products
- 11.2.11.3. SWOT Analysis
- 11.2.11.4. Recent Developments
- 11.2.11.5. Financials (Based on Availability)
- 11.2.12 Veridian Healthcare
- 11.2.12.1. Overview
- 11.2.12.2. Products
- 11.2.12.3. SWOT Analysis
- 11.2.12.4. Recent Developments
- 11.2.12.5. Financials (Based on Availability)
- 11.2.13 Smart Health
- 11.2.13.1. Overview
- 11.2.13.2. Products
- 11.2.13.3. SWOT Analysis
- 11.2.13.4. Recent Developments
- 11.2.13.5. Financials (Based on Availability)
- 11.2.14 Littmann
- 11.2.14.1. Overview
- 11.2.14.2. Products
- 11.2.14.3. SWOT Analysis
- 11.2.14.4. Recent Developments
- 11.2.14.5. Financials (Based on Availability)
- 11.2.15 Telcomed
- 11.2.15.1. Overview
- 11.2.15.2. Products
- 11.2.15.3. SWOT Analysis
- 11.2.15.4. Recent Developments
- 11.2.15.5. Financials (Based on Availability)
- 11.2.1 Withings
List of Figures
- Figure 1: Global Wireless Blood Pressure Monitors Revenue Breakdown (million, %) by Region 2024 & 2032
- Figure 2: Global Wireless Blood Pressure Monitors Volume Breakdown (K, %) by Region 2024 & 2032
- Figure 3: North America Wireless Blood Pressure Monitors Revenue (million), by Application 2024 & 2032
- Figure 4: North America Wireless Blood Pressure Monitors Volume (K), by Application 2024 & 2032
- Figure 5: North America Wireless Blood Pressure Monitors Revenue Share (%), by Application 2024 & 2032
- Figure 6: North America Wireless Blood Pressure Monitors Volume Share (%), by Application 2024 & 2032
- Figure 7: North America Wireless Blood Pressure Monitors Revenue (million), by Type 2024 & 2032
- Figure 8: North America Wireless Blood Pressure Monitors Volume (K), by Type 2024 & 2032
- Figure 9: North America Wireless Blood Pressure Monitors Revenue Share (%), by Type 2024 & 2032
- Figure 10: North America Wireless Blood Pressure Monitors Volume Share (%), by Type 2024 & 2032
- Figure 11: North America Wireless Blood Pressure Monitors Revenue (million), by Country 2024 & 2032
- Figure 12: North America Wireless Blood Pressure Monitors Volume (K), by Country 2024 & 2032
- Figure 13: North America Wireless Blood Pressure Monitors Revenue Share (%), by Country 2024 & 2032
- Figure 14: North America Wireless Blood Pressure Monitors Volume Share (%), by Country 2024 & 2032
- Figure 15: South America Wireless Blood Pressure Monitors Revenue (million), by Application 2024 & 2032
- Figure 16: South America Wireless Blood Pressure Monitors Volume (K), by Application 2024 & 2032
- Figure 17: South America Wireless Blood Pressure Monitors Revenue Share (%), by Application 2024 & 2032
- Figure 18: South America Wireless Blood Pressure Monitors Volume Share (%), by Application 2024 & 2032
- Figure 19: South America Wireless Blood Pressure Monitors Revenue (million), by Type 2024 & 2032
- Figure 20: South America Wireless Blood Pressure Monitors Volume (K), by Type 2024 & 2032
- Figure 21: South America Wireless Blood Pressure Monitors Revenue Share (%), by Type 2024 & 2032
- Figure 22: South America Wireless Blood Pressure Monitors Volume Share (%), by Type 2024 & 2032
- Figure 23: South America Wireless Blood Pressure Monitors Revenue (million), by Country 2024 & 2032
- Figure 24: South America Wireless Blood Pressure Monitors Volume (K), by Country 2024 & 2032
- Figure 25: South America Wireless Blood Pressure Monitors Revenue Share (%), by Country 2024 & 2032
- Figure 26: South America Wireless Blood Pressure Monitors Volume Share (%), by Country 2024 & 2032
- Figure 27: Europe Wireless Blood Pressure Monitors Revenue (million), by Application 2024 & 2032
- Figure 28: Europe Wireless Blood Pressure Monitors Volume (K), by Application 2024 & 2032
- Figure 29: Europe Wireless Blood Pressure Monitors Revenue Share (%), by Application 2024 & 2032
- Figure 30: Europe Wireless Blood Pressure Monitors Volume Share (%), by Application 2024 & 2032
- Figure 31: Europe Wireless Blood Pressure Monitors Revenue (million), by Type 2024 & 2032
- Figure 32: Europe Wireless Blood Pressure Monitors Volume (K), by Type 2024 & 2032
- Figure 33: Europe Wireless Blood Pressure Monitors Revenue Share (%), by Type 2024 & 2032
- Figure 34: Europe Wireless Blood Pressure Monitors Volume Share (%), by Type 2024 & 2032
- Figure 35: Europe Wireless Blood Pressure Monitors Revenue (million), by Country 2024 & 2032
- Figure 36: Europe Wireless Blood Pressure Monitors Volume (K), by Country 2024 & 2032
- Figure 37: Europe Wireless Blood Pressure Monitors Revenue Share (%), by Country 2024 & 2032
- Figure 38: Europe Wireless Blood Pressure Monitors Volume Share (%), by Country 2024 & 2032
- Figure 39: Middle East & Africa Wireless Blood Pressure Monitors Revenue (million), by Application 2024 & 2032
- Figure 40: Middle East & Africa Wireless Blood Pressure Monitors Volume (K), by Application 2024 & 2032
- Figure 41: Middle East & Africa Wireless Blood Pressure Monitors Revenue Share (%), by Application 2024 & 2032
- Figure 42: Middle East & Africa Wireless Blood Pressure Monitors Volume Share (%), by Application 2024 & 2032
- Figure 43: Middle East & Africa Wireless Blood Pressure Monitors Revenue (million), by Type 2024 & 2032
- Figure 44: Middle East & Africa Wireless Blood Pressure Monitors Volume (K), by Type 2024 & 2032
- Figure 45: Middle East & Africa Wireless Blood Pressure Monitors Revenue Share (%), by Type 2024 & 2032
- Figure 46: Middle East & Africa Wireless Blood Pressure Monitors Volume Share (%), by Type 2024 & 2032
- Figure 47: Middle East & Africa Wireless Blood Pressure Monitors Revenue (million), by Country 2024 & 2032
- Figure 48: Middle East & Africa Wireless Blood Pressure Monitors Volume (K), by Country 2024 & 2032
- Figure 49: Middle East & Africa Wireless Blood Pressure Monitors Revenue Share (%), by Country 2024 & 2032
- Figure 50: Middle East & Africa Wireless Blood Pressure Monitors Volume Share (%), by Country 2024 & 2032
- Figure 51: Asia Pacific Wireless Blood Pressure Monitors Revenue (million), by Application 2024 & 2032
- Figure 52: Asia Pacific Wireless Blood Pressure Monitors Volume (K), by Application 2024 & 2032
- Figure 53: Asia Pacific Wireless Blood Pressure Monitors Revenue Share (%), by Application 2024 & 2032
- Figure 54: Asia Pacific Wireless Blood Pressure Monitors Volume Share (%), by Application 2024 & 2032
- Figure 55: Asia Pacific Wireless Blood Pressure Monitors Revenue (million), by Type 2024 & 2032
- Figure 56: Asia Pacific Wireless Blood Pressure Monitors Volume (K), by Type 2024 & 2032
- Figure 57: Asia Pacific Wireless Blood Pressure Monitors Revenue Share (%), by Type 2024 & 2032
- Figure 58: Asia Pacific Wireless Blood Pressure Monitors Volume Share (%), by Type 2024 & 2032
- Figure 59: Asia Pacific Wireless Blood Pressure Monitors Revenue (million), by Country 2024 & 2032
- Figure 60: Asia Pacific Wireless Blood Pressure Monitors Volume (K), by Country 2024 & 2032
- Figure 61: Asia Pacific Wireless Blood Pressure Monitors Revenue Share (%), by Country 2024 & 2032
- Figure 62: Asia Pacific Wireless Blood Pressure Monitors Volume Share (%), by Country 2024 & 2032
List of Tables
- Table 1: Global Wireless Blood Pressure Monitors Revenue million Forecast, by Region 2019 & 2032
- Table 2: Global Wireless Blood Pressure Monitors Volume K Forecast, by Region 2019 & 2032
- Table 3: Global Wireless Blood Pressure Monitors Revenue million Forecast, by Application 2019 & 2032
- Table 4: Global Wireless Blood Pressure Monitors Volume K Forecast, by Application 2019 & 2032
- Table 5: Global Wireless Blood Pressure Monitors Revenue million Forecast, by Type 2019 & 2032
- Table 6: Global Wireless Blood Pressure Monitors Volume K Forecast, by Type 2019 & 2032
- Table 7: Global Wireless Blood Pressure Monitors Revenue million Forecast, by Region 2019 & 2032
- Table 8: Global Wireless Blood Pressure Monitors Volume K Forecast, by Region 2019 & 2032
- Table 9: Global Wireless Blood Pressure Monitors Revenue million Forecast, by Application 2019 & 2032
- Table 10: Global Wireless Blood Pressure Monitors Volume K Forecast, by Application 2019 & 2032
- Table 11: Global Wireless Blood Pressure Monitors Revenue million Forecast, by Type 2019 & 2032
- Table 12: Global Wireless Blood Pressure Monitors Volume K Forecast, by Type 2019 & 2032
- Table 13: Global Wireless Blood Pressure Monitors Revenue million Forecast, by Country 2019 & 2032
- Table 14: Global Wireless Blood Pressure Monitors Volume K Forecast, by Country 2019 & 2032
- Table 15: United States Wireless Blood Pressure Monitors Revenue (million) Forecast, by Application 2019 & 2032
- Table 16: United States Wireless Blood Pressure Monitors Volume (K) Forecast, by Application 2019 & 2032
- Table 17: Canada Wireless Blood Pressure Monitors Revenue (million) Forecast, by Application 2019 & 2032
- Table 18: Canada Wireless Blood Pressure Monitors Volume (K) Forecast, by Application 2019 & 2032
- Table 19: Mexico Wireless Blood Pressure Monitors Revenue (million) Forecast, by Application 2019 & 2032
- Table 20: Mexico Wireless Blood Pressure Monitors Volume (K) Forecast, by Application 2019 & 2032
- Table 21: Global Wireless Blood Pressure Monitors Revenue million Forecast, by Application 2019 & 2032
- Table 22: Global Wireless Blood Pressure Monitors Volume K Forecast, by Application 2019 & 2032
- Table 23: Global Wireless Blood Pressure Monitors Revenue million Forecast, by Type 2019 & 2032
- Table 24: Global Wireless Blood Pressure Monitors Volume K Forecast, by Type 2019 & 2032
- Table 25: Global Wireless Blood Pressure Monitors Revenue million Forecast, by Country 2019 & 2032
- Table 26: Global Wireless Blood Pressure Monitors Volume K Forecast, by Country 2019 & 2032
- Table 27: Brazil Wireless Blood Pressure Monitors Revenue (million) Forecast, by Application 2019 & 2032
- Table 28: Brazil Wireless Blood Pressure Monitors Volume (K) Forecast, by Application 2019 & 2032
- Table 29: Argentina Wireless Blood Pressure Monitors Revenue (million) Forecast, by Application 2019 & 2032
- Table 30: Argentina Wireless Blood Pressure Monitors Volume (K) Forecast, by Application 2019 & 2032
- Table 31: Rest of South America Wireless Blood Pressure Monitors Revenue (million) Forecast, by Application 2019 & 2032
- Table 32: Rest of South America Wireless Blood Pressure Monitors Volume (K) Forecast, by Application 2019 & 2032
- Table 33: Global Wireless Blood Pressure Monitors Revenue million Forecast, by Application 2019 & 2032
- Table 34: Global Wireless Blood Pressure Monitors Volume K Forecast, by Application 2019 & 2032
- Table 35: Global Wireless Blood Pressure Monitors Revenue million Forecast, by Type 2019 & 2032
- Table 36: Global Wireless Blood Pressure Monitors Volume K Forecast, by Type 2019 & 2032
- Table 37: Global Wireless Blood Pressure Monitors Revenue million Forecast, by Country 2019 & 2032
- Table 38: Global Wireless Blood Pressure Monitors Volume K Forecast, by Country 2019 & 2032
- Table 39: United Kingdom Wireless Blood Pressure Monitors Revenue (million) Forecast, by Application 2019 & 2032
- Table 40: United Kingdom Wireless Blood Pressure Monitors Volume (K) Forecast, by Application 2019 & 2032
- Table 41: Germany Wireless Blood Pressure Monitors Revenue (million) Forecast, by Application 2019 & 2032
- Table 42: Germany Wireless Blood Pressure Monitors Volume (K) Forecast, by Application 2019 & 2032
- Table 43: France Wireless Blood Pressure Monitors Revenue (million) Forecast, by Application 2019 & 2032
- Table 44: France Wireless Blood Pressure Monitors Volume (K) Forecast, by Application 2019 & 2032
- Table 45: Italy Wireless Blood Pressure Monitors Revenue (million) Forecast, by Application 2019 & 2032
- Table 46: Italy Wireless Blood Pressure Monitors Volume (K) Forecast, by Application 2019 & 2032
- Table 47: Spain Wireless Blood Pressure Monitors Revenue (million) Forecast, by Application 2019 & 2032
- Table 48: Spain Wireless Blood Pressure Monitors Volume (K) Forecast, by Application 2019 & 2032
- Table 49: Russia Wireless Blood Pressure Monitors Revenue (million) Forecast, by Application 2019 & 2032
- Table 50: Russia Wireless Blood Pressure Monitors Volume (K) Forecast, by Application 2019 & 2032
- Table 51: Benelux Wireless Blood Pressure Monitors Revenue (million) Forecast, by Application 2019 & 2032
- Table 52: Benelux Wireless Blood Pressure Monitors Volume (K) Forecast, by Application 2019 & 2032
- Table 53: Nordics Wireless Blood Pressure Monitors Revenue (million) Forecast, by Application 2019 & 2032
- Table 54: Nordics Wireless Blood Pressure Monitors Volume (K) Forecast, by Application 2019 & 2032
- Table 55: Rest of Europe Wireless Blood Pressure Monitors Revenue (million) Forecast, by Application 2019 & 2032
- Table 56: Rest of Europe Wireless Blood Pressure Monitors Volume (K) Forecast, by Application 2019 & 2032
- Table 57: Global Wireless Blood Pressure Monitors Revenue million Forecast, by Application 2019 & 2032
- Table 58: Global Wireless Blood Pressure Monitors Volume K Forecast, by Application 2019 & 2032
- Table 59: Global Wireless Blood Pressure Monitors Revenue million Forecast, by Type 2019 & 2032
- Table 60: Global Wireless Blood Pressure Monitors Volume K Forecast, by Type 2019 & 2032
- Table 61: Global Wireless Blood Pressure Monitors Revenue million Forecast, by Country 2019 & 2032
- Table 62: Global Wireless Blood Pressure Monitors Volume K Forecast, by Country 2019 & 2032
- Table 63: Turkey Wireless Blood Pressure Monitors Revenue (million) Forecast, by Application 2019 & 2032
- Table 64: Turkey Wireless Blood Pressure Monitors Volume (K) Forecast, by Application 2019 & 2032
- Table 65: Israel Wireless Blood Pressure Monitors Revenue (million) Forecast, by Application 2019 & 2032
- Table 66: Israel Wireless Blood Pressure Monitors Volume (K) Forecast, by Application 2019 & 2032
- Table 67: GCC Wireless Blood Pressure Monitors Revenue (million) Forecast, by Application 2019 & 2032
- Table 68: GCC Wireless Blood Pressure Monitors Volume (K) Forecast, by Application 2019 & 2032
- Table 69: North Africa Wireless Blood Pressure Monitors Revenue (million) Forecast, by Application 2019 & 2032
- Table 70: North Africa Wireless Blood Pressure Monitors Volume (K) Forecast, by Application 2019 & 2032
- Table 71: South Africa Wireless Blood Pressure Monitors Revenue (million) Forecast, by Application 2019 & 2032
- Table 72: South Africa Wireless Blood Pressure Monitors Volume (K) Forecast, by Application 2019 & 2032
- Table 73: Rest of Middle East & Africa Wireless Blood Pressure Monitors Revenue (million) Forecast, by Application 2019 & 2032
- Table 74: Rest of Middle East & Africa Wireless Blood Pressure Monitors Volume (K) Forecast, by Application 2019 & 2032
- Table 75: Global Wireless Blood Pressure Monitors Revenue million Forecast, by Application 2019 & 2032
- Table 76: Global Wireless Blood Pressure Monitors Volume K Forecast, by Application 2019 & 2032
- Table 77: Global Wireless Blood Pressure Monitors Revenue million Forecast, by Type 2019 & 2032
- Table 78: Global Wireless Blood Pressure Monitors Volume K Forecast, by Type 2019 & 2032
- Table 79: Global Wireless Blood Pressure Monitors Revenue million Forecast, by Country 2019 & 2032
- Table 80: Global Wireless Blood Pressure Monitors Volume K Forecast, by Country 2019 & 2032
- Table 81: China Wireless Blood Pressure Monitors Revenue (million) Forecast, by Application 2019 & 2032
- Table 82: China Wireless Blood Pressure Monitors Volume (K) Forecast, by Application 2019 & 2032
- Table 83: India Wireless Blood Pressure Monitors Revenue (million) Forecast, by Application 2019 & 2032
- Table 84: India Wireless Blood Pressure Monitors Volume (K) Forecast, by Application 2019 & 2032
- Table 85: Japan Wireless Blood Pressure Monitors Revenue (million) Forecast, by Application 2019 & 2032
- Table 86: Japan Wireless Blood Pressure Monitors Volume (K) Forecast, by Application 2019 & 2032
- Table 87: South Korea Wireless Blood Pressure Monitors Revenue (million) Forecast, by Application 2019 & 2032
- Table 88: South Korea Wireless Blood Pressure Monitors Volume (K) Forecast, by Application 2019 & 2032
- Table 89: ASEAN Wireless Blood Pressure Monitors Revenue (million) Forecast, by Application 2019 & 2032
- Table 90: ASEAN Wireless Blood Pressure Monitors Volume (K) Forecast, by Application 2019 & 2032
- Table 91: Oceania Wireless Blood Pressure Monitors Revenue (million) Forecast, by Application 2019 & 2032
- Table 92: Oceania Wireless Blood Pressure Monitors Volume (K) Forecast, by Application 2019 & 2032
- Table 93: Rest of Asia Pacific Wireless Blood Pressure Monitors Revenue (million) Forecast, by Application 2019 & 2032
- Table 94: Rest of Asia Pacific Wireless Blood Pressure Monitors Volume (K) Forecast, by Application 2019 & 2032
Frequently Asked Questions
1. What is the projected Compound Annual Growth Rate (CAGR) of the Wireless Blood Pressure Monitors?
The projected CAGR is approximately XXX%.
2. Which companies are prominent players in the Wireless Blood Pressure Monitors?
Key companies in the market include Withings, iHealth, Qardio, OMRON Healthcare, Apple, Pyle Audio, Xiaomi, Panasonic, GE Healthcare, Philips, Biggs Healthcare, Veridian Healthcare, Smart Health, Littmann, Telcomed.
3. What are the main segments of the Wireless Blood Pressure Monitors?
The market segments include Application, Type.
4. Can you provide details about the market size?
The market size is estimated to be USD XXX million as of 2022.
5. What are some drivers contributing to market growth?
N/A
6. What are the notable trends driving market growth?
N/A
7. Are there any restraints impacting market growth?
N/A
8. Can you provide examples of recent developments in the market?
N/A
9. What pricing options are available for accessing the report?
Pricing options include single-user, multi-user, and enterprise licenses priced at USD 3950.00, USD 5925.00, and USD 7900.00 respectively.
10. Is the market size provided in terms of value or volume?
The market size is provided in terms of value, measured in million and volume, measured in K.
11. Are there any specific market keywords associated with the report?
Yes, the market keyword associated with the report is "Wireless Blood Pressure Monitors," which aids in identifying and referencing the specific market segment covered.
12. How do I determine which pricing option suits my needs best?
The pricing options vary based on user requirements and access needs. Individual users may opt for single-user licenses, while businesses requiring broader access may choose multi-user or enterprise licenses for cost-effective access to the report.
13. Are there any additional resources or data provided in the Wireless Blood Pressure Monitors report?
While the report offers comprehensive insights, it's advisable to review the specific contents or supplementary materials provided to ascertain if additional resources or data are available.
14. How can I stay updated on further developments or reports in the Wireless Blood Pressure Monitors?
To stay informed about further developments, trends, and reports in the Wireless Blood Pressure Monitors, consider subscribing to industry newsletters, following relevant companies and organizations, or regularly checking reputable industry news sources and publications.
Methodology
Step 1 - Identification of Relevant Samples Size from Population Database


Step 2 - Approaches for Defining Global Market Size (Value, Volume* & Price*)

Note*: In applicable scenarios
Step 3 - Data Sources
Primary Research
- Web Analytics
- Survey Reports
- Research Institute
- Latest Research Reports
- Opinion Leaders
Secondary Research
- Annual Reports
- White Paper
- Latest Press Release
- Industry Association
- Paid Database
- Investor Presentations

Step 4 - Data Triangulation
Involves using different sources of information in order to increase the validity of a study
These sources are likely to be stakeholders in a program - participants, other researchers, program staff, other community members, and so on.
Then we put all data in single framework & apply various statistical tools to find out the dynamic on the market.
During the analysis stage, feedback from the stakeholder groups would be compared to determine areas of agreement as well as areas of divergence
