

Key Insights
Cameroon's agricultural sector offers substantial growth prospects, driven by rising domestic and global demand for key commodities. The market, valued at approximately 491577 million in 2025, is projected to expand at a Compound Annual Growth Rate (CAGR) of 6% through 2033. Key growth drivers include increasing demand for food staples such as cocoa and coffee, alongside a strong global appetite for exports like oil palm, cotton, and rubber. The sector is diversified by crop type (cocoa, coffee, oil palm, cotton, rubber) and end-use (food, export). Major contributors include multinational corporations and local entities, reflecting a blend of global expertise and indigenous agricultural knowledge. While established export markets exist, enhancing domestic processing and value addition presents a significant opportunity for amplified sector growth. Challenges such as infrastructure limitations, climate variability, and price fluctuations require strategic investment in infrastructure, technology, and market diversification to ensure sustainable expansion.
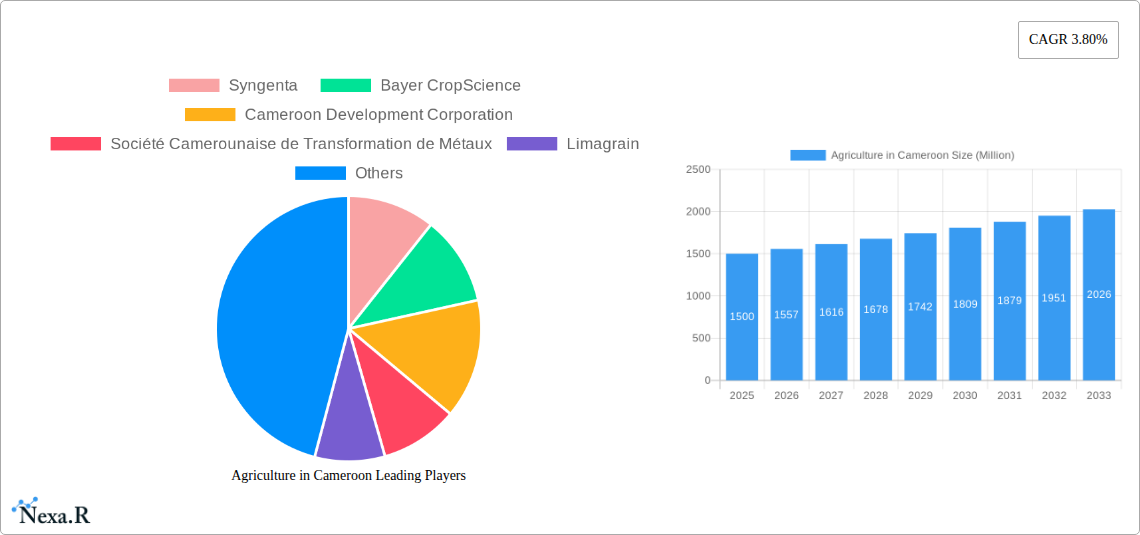
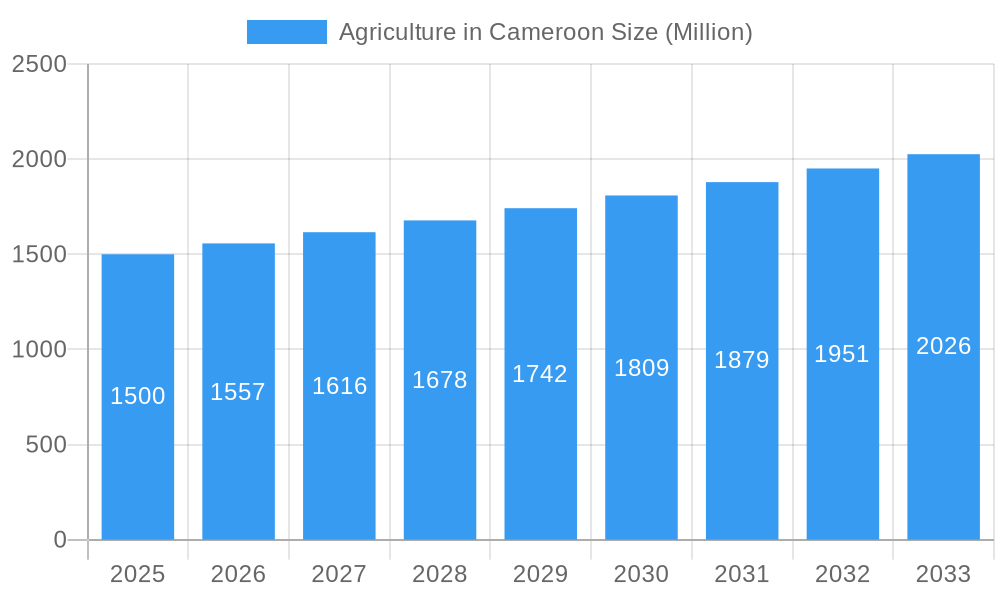
Agriculture in Cameroon Market Size (In Billion)
The forecast period (2025-2033) anticipates sustained growth fueled by government development initiatives and increased private sector investment. The emphasis on high-value, export-oriented crops will likely propel expansion. However, addressing challenges in land tenure, credit access, and value chain development is crucial for equitable benefit distribution and overall economic advancement. The involvement of companies like Limagrain highlights a growing emphasis on seed technology and crop variety improvement, vital for boosting productivity. In-depth analysis of crop-specific challenges and regional variations will provide a more granular long-term outlook.
Agriculture in Cameroon Company Market Share
Agriculture in Cameroon: A Comprehensive Market Report (2019-2033)
This in-depth report provides a comprehensive analysis of the agriculture sector in Cameroon, covering market dynamics, growth trends, key players, and future outlook. With a focus on key crops like cocoa, coffee, oil palm, cotton, and rubber, and end-uses spanning food, export, and industrial applications, this report is an essential resource for industry professionals, investors, and policymakers. The study period spans 2019-2033, with a base year of 2025 and a forecast period of 2025-2033. Market values are presented in millions of units.
Agriculture in Cameroon Market Dynamics & Structure
The Cameroonian agricultural landscape is characterized by a mix of smallholder farmers and larger commercial operations. Market concentration is moderate, with several significant players alongside numerous smaller farms. Technological innovation is driven by the need to increase productivity and efficiency, facing challenges like limited access to technology and infrastructure in rural areas. The regulatory framework is evolving, aiming to support the sector's development and improve competitiveness. Key competitive product substitutes exist for certain crops. End-user demographics are diverse, ranging from local consumers to international exporters. M&A activity is relatively low but growing, driven by efforts to consolidate operations and improve efficiency.
- Market Concentration: Moderate, with a few dominant players and numerous smaller farms.
- Technological Innovation: Driven by the need for increased productivity, but hindered by access to technology and infrastructure.
- Regulatory Framework: Evolving to support sector development and competitiveness.
- Competitive Substitutes: Present for certain crops.
- End-User Demographics: Diverse, encompassing local consumers and international exporters.
- M&A Activity: Relatively low, but increasing. Estimated xx M&A deals in 2024.
Agriculture in Cameroon Growth Trends & Insights
The Cameroonian agricultural market exhibits a steady growth trajectory, driven by increasing demand, both domestically and internationally, for key agricultural products. While precise figures are challenging to obtain, the compound annual growth rate (CAGR) is estimated at xx% during the historical period (2019-2024), with a projected CAGR of xx% for the forecast period (2025-2033). This growth is being influenced by increasing adoption rates of improved farming techniques and technological advancements in specific segments, leading to changes in consumer behavior and greater demand for higher quality products. Market penetration for modern farming techniques remains relatively low, indicating significant untapped potential.
Dominant Regions, Countries, or Segments in Agriculture in Cameroon
The Littoral and South-West regions are dominant in cocoa and rubber production, while the Adamawa and West regions contribute significantly to cotton and coffee production. Oil palm cultivation is spread across several regions. The export segment significantly drives growth due to the high international demand for Cameroonian agricultural products, particularly cocoa and coffee. This is further fueled by government initiatives aimed at increasing agricultural exports.
- Key Drivers (Export Segment): High international demand, government export promotion policies, favorable trade agreements.
- Key Drivers (Cocoa): Fertile land, favorable climate, established export infrastructure.
- Market Share: Cocoa accounts for an estimated xx% of total agricultural exports; coffee for xx%.
- Growth Potential: The market shows potential for expansion through improved processing techniques and value addition.
Agriculture in Cameroon Product Landscape
Product innovation focuses on improving crop yields, disease resistance, and quality. This includes the introduction of high-yielding crop varieties, improved fertilizers, and efficient irrigation systems. These innovations are aimed at enhancing efficiency and improving the overall quality of agricultural produce. Further advancement is driven by partnerships with companies such as Syngenta and Bayer CropScience.
Key Drivers, Barriers & Challenges in Agriculture in Cameroon
Key Drivers: Increasing domestic demand; growing export opportunities; government initiatives promoting agricultural development; and favorable climate for certain crops.
Key Challenges: Limited access to credit and finance; inadequate infrastructure (especially roads and storage); climate change impacts (droughts and floods); low use of improved farming technologies; and pest and disease outbreaks. These challenges lead to reduced yields and productivity, impacting overall market growth, estimated at xx million units lost annually due to infrastructure limitations.
Emerging Opportunities in Agriculture in Cameroon
Opportunities exist in value addition, processing, and diversification of agricultural products. Expanding access to improved agricultural technologies and credit can significantly enhance production. Developing export markets for niche products and promoting sustainable farming practices represent substantial opportunities for growth.
Growth Accelerators in the Agriculture in Cameroon Industry
Long-term growth will be fueled by investments in infrastructure, access to improved technology and finance, and strengthening farmer cooperatives. Government policies supporting sustainable agriculture and value chain development are crucial. Strategic partnerships between public and private sectors can facilitate technological transfer and market access.
Key Players Shaping the Agriculture in Cameroon Market
- Syngenta
- Bayer CropScience
- Cameroon Development Corporation
- Société Camerounaise de Transformation de Métaux
- Limagrain
Notable Milestones in Agriculture in Cameroon Sector
- November 2022: USD 200 million World Bank loan for irrigation infrastructure development.
- September 2022: Establishment of an Agricultural Sector Development Fund.
In-Depth Agriculture in Cameroon Market Outlook
The Cameroonian agricultural sector holds significant promise for growth, driven by increasing domestic demand, export opportunities, and supportive government policies. Strategic investments in infrastructure, technology, and farmer training will be vital for unlocking this potential. Continued improvements in efficiency, value addition, and sustainable practices are essential for long-term success. The market is projected to reach xx million units by 2033.
Agriculture in Cameroon Segmentation
- 1. Cereals
- 2. Fruits
- 3. Vegetables
- 4. Cash Crops
- 5. Cereals
- 6. Fruits
- 7. Vegetables
- 8. Cash Crops
Agriculture in Cameroon Segmentation By Geography
-
1. North America
- 1.1. United States
- 1.2. Canada
- 1.3. Mexico
-
2. South America
- 2.1. Brazil
- 2.2. Argentina
- 2.3. Rest of South America
-
3. Europe
- 3.1. United Kingdom
- 3.2. Germany
- 3.3. France
- 3.4. Italy
- 3.5. Spain
- 3.6. Russia
- 3.7. Benelux
- 3.8. Nordics
- 3.9. Rest of Europe
-
4. Middle East & Africa
- 4.1. Turkey
- 4.2. Israel
- 4.3. GCC
- 4.4. North Africa
- 4.5. South Africa
- 4.6. Rest of Middle East & Africa
-
5. Asia Pacific
- 5.1. China
- 5.2. India
- 5.3. Japan
- 5.4. South Korea
- 5.5. ASEAN
- 5.6. Oceania
- 5.7. Rest of Asia Pacific
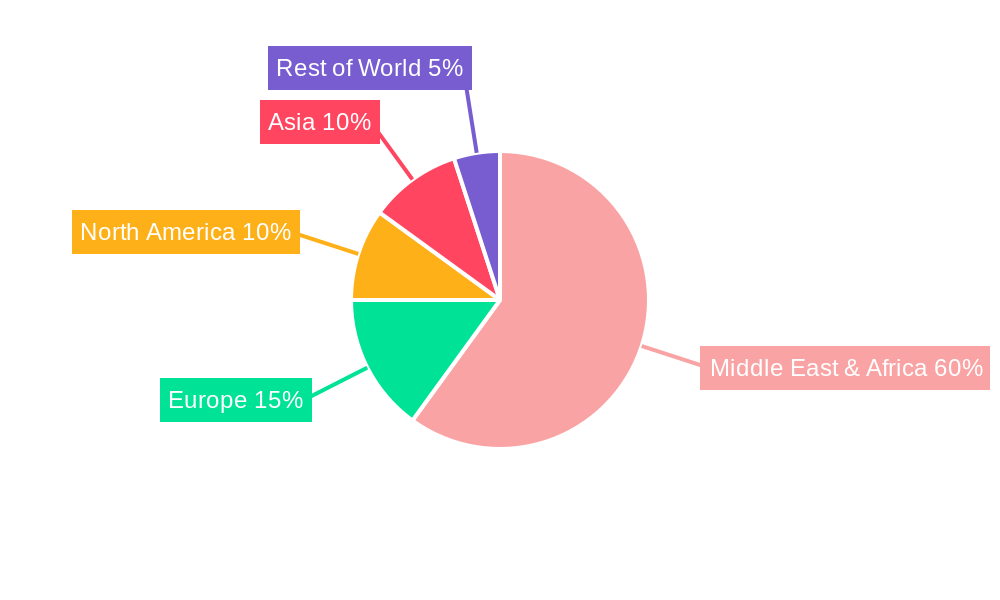
Agriculture in Cameroon Regional Market Share
Geographic Coverage of Agriculture in Cameroon
Agriculture in Cameroon REPORT HIGHLIGHTS
| Aspects | Details |
|---|---|
| Study Period | 2020-2034 |
| Base Year | 2025 |
| Estimated Year | 2026 |
| Forecast Period | 2026-2034 |
| Historical Period | 2020-2025 |
| Growth Rate | CAGR of 6% from 2020-2034 |
| Segmentation |
|
Table of Contents
- 1. Introduction
- 1.1. Research Scope
- 1.2. Market Segmentation
- 1.3. Research Objective
- 1.4. Definitions and Assumptions
- 2. Executive Summary
- 2.1. Market Snapshot
- 3. Market Dynamics
- 3.1. Market Drivers
- 3.2. Market Restrains
- 3.3. Market Trends
- 3.4. Market Opportunities
- 4. Market Factor Analysis
- 4.1. Porters Five Forces
- 4.1.1. Bargaining Power of Suppliers
- 4.1.2. Bargaining Power of Buyers
- 4.1.3. Threat of New Entrants
- 4.1.4. Threat of Substitutes
- 4.1.5. Competitive Rivalry
- 4.2. PESTEL analysis
- 4.3. BCG Analysis
- 4.3.1. Stars (High Growth, High Market Share)
- 4.3.2. Cash Cows (Low Growth, High Market Share)
- 4.3.3. Question Mark (High Growth, Low Market Share)
- 4.3.4. Dogs (Low Growth, Low Market Share)
- 4.4. Ansoff Matrix Analysis
- 4.5. Supply Chain Analysis
- 4.6. Regulatory Landscape
- 4.7. Current Market Potential and Opportunity Assessment (TAM–SAM–SOM Framework)
- 4.8. NRP Analyst Note
- 4.1. Porters Five Forces
- 5. Market Analysis, Insights and Forecast 2021-2033
- 5.1. Market Analysis, Insights and Forecast - by Cereals
- 5.2. Market Analysis, Insights and Forecast - by Fruits
- 5.3. Market Analysis, Insights and Forecast - by Vegetables
- 5.4. Market Analysis, Insights and Forecast - by Cash Crops
- 5.5. Market Analysis, Insights and Forecast - by Cereals
- 5.6. Market Analysis, Insights and Forecast - by Fruits
- 5.7. Market Analysis, Insights and Forecast - by Vegetables
- 5.8. Market Analysis, Insights and Forecast - by Cash Crops
- 5.9. Market Analysis, Insights and Forecast - by Region
- 5.9.1. North America
- 5.9.2. South America
- 5.9.3. Europe
- 5.9.4. Middle East & Africa
- 5.9.5. Asia Pacific
- 6. Global Agriculture in Cameroon Analysis, Insights and Forecast, 2021-2033
- 6.1. Market Analysis, Insights and Forecast - by Cereals
- 6.2. Market Analysis, Insights and Forecast - by Fruits
- 6.3. Market Analysis, Insights and Forecast - by Vegetables
- 6.4. Market Analysis, Insights and Forecast - by Cash Crops
- 6.5. Market Analysis, Insights and Forecast - by Cereals
- 6.6. Market Analysis, Insights and Forecast - by Fruits
- 6.7. Market Analysis, Insights and Forecast - by Vegetables
- 6.8. Market Analysis, Insights and Forecast - by Cash Crops
- 7. North America Agriculture in Cameroon Analysis, Insights and Forecast, 2020-2032
- 7.1. Market Analysis, Insights and Forecast - by Cereals
- 7.2. Market Analysis, Insights and Forecast - by Fruits
- 7.3. Market Analysis, Insights and Forecast - by Vegetables
- 7.4. Market Analysis, Insights and Forecast - by Cash Crops
- 7.5. Market Analysis, Insights and Forecast - by Cereals
- 7.6. Market Analysis, Insights and Forecast - by Fruits
- 7.7. Market Analysis, Insights and Forecast - by Vegetables
- 7.8. Market Analysis, Insights and Forecast - by Cash Crops
- 8. South America Agriculture in Cameroon Analysis, Insights and Forecast, 2020-2032
- 8.1. Market Analysis, Insights and Forecast - by Cereals
- 8.2. Market Analysis, Insights and Forecast - by Fruits
- 8.3. Market Analysis, Insights and Forecast - by Vegetables
- 8.4. Market Analysis, Insights and Forecast - by Cash Crops
- 8.5. Market Analysis, Insights and Forecast - by Cereals
- 8.6. Market Analysis, Insights and Forecast - by Fruits
- 8.7. Market Analysis, Insights and Forecast - by Vegetables
- 8.8. Market Analysis, Insights and Forecast - by Cash Crops
- 9. Europe Agriculture in Cameroon Analysis, Insights and Forecast, 2020-2032
- 9.1. Market Analysis, Insights and Forecast - by Cereals
- 9.2. Market Analysis, Insights and Forecast - by Fruits
- 9.3. Market Analysis, Insights and Forecast - by Vegetables
- 9.4. Market Analysis, Insights and Forecast - by Cash Crops
- 9.5. Market Analysis, Insights and Forecast - by Cereals
- 9.6. Market Analysis, Insights and Forecast - by Fruits
- 9.7. Market Analysis, Insights and Forecast - by Vegetables
- 9.8. Market Analysis, Insights and Forecast - by Cash Crops
- 10. Middle East & Africa Agriculture in Cameroon Analysis, Insights and Forecast, 2020-2032
- 10.1. Market Analysis, Insights and Forecast - by Cereals
- 10.2. Market Analysis, Insights and Forecast - by Fruits
- 10.3. Market Analysis, Insights and Forecast - by Vegetables
- 10.4. Market Analysis, Insights and Forecast - by Cash Crops
- 10.5. Market Analysis, Insights and Forecast - by Cereals
- 10.6. Market Analysis, Insights and Forecast - by Fruits
- 10.7. Market Analysis, Insights and Forecast - by Vegetables
- 10.8. Market Analysis, Insights and Forecast - by Cash Crops
- 11. Asia Pacific Agriculture in Cameroon Analysis, Insights and Forecast, 2020-2032
- 11.1. Market Analysis, Insights and Forecast - by Cereals
- 11.2. Market Analysis, Insights and Forecast - by Fruits
- 11.3. Market Analysis, Insights and Forecast - by Vegetables
- 11.4. Market Analysis, Insights and Forecast - by Cash Crops
- 11.5. Market Analysis, Insights and Forecast - by Cereals
- 11.6. Market Analysis, Insights and Forecast - by Fruits
- 11.7. Market Analysis, Insights and Forecast - by Vegetables
- 11.8. Market Analysis, Insights and Forecast - by Cash Crops
- 12. Competitive Analysis
- 12.1. Company Profiles
- 12.1.1 Syngenta
- 12.1.1.1. Company Overview
- 12.1.1.2. Products
- 12.1.1.3. Company Financials
- 12.1.1.4. SWOT Analysis
- 12.1.2 Bayer CropScience
- 12.1.2.1. Company Overview
- 12.1.2.2. Products
- 12.1.2.3. Company Financials
- 12.1.2.4. SWOT Analysis
- 12.1.3 Cameroon Development Corporation
- 12.1.3.1. Company Overview
- 12.1.3.2. Products
- 12.1.3.3. Company Financials
- 12.1.3.4. SWOT Analysis
- 12.1.4 Société Camerounaise de Transformation de Métaux
- 12.1.4.1. Company Overview
- 12.1.4.2. Products
- 12.1.4.3. Company Financials
- 12.1.4.4. SWOT Analysis
- 12.1.5 Limagrain
- 12.1.5.1. Company Overview
- 12.1.5.2. Products
- 12.1.5.3. Company Financials
- 12.1.5.4. SWOT Analysis
- 12.1.1 Syngenta
- 12.2. Market Entropy
- 12.2.1 Company's Key Areas Served
- 12.2.2 Recent Developments
- 12.3. Company Market Share Analysis 2025
- 12.3.1 Top 5 Companies Market Share Analysis
- 12.3.2 Top 3 Companies Market Share Analysis
- 12.4. List of Potential Customers
- 13. Research Methodology
List of Figures
- Figure 1: Global Agriculture in Cameroon Revenue Breakdown (million, %) by Region 2025 & 2033
- Figure 2: North America Agriculture in Cameroon Revenue (million), by Cereals 2025 & 2033
- Figure 3: North America Agriculture in Cameroon Revenue Share (%), by Cereals 2025 & 2033
- Figure 4: North America Agriculture in Cameroon Revenue (million), by Fruits 2025 & 2033
- Figure 5: North America Agriculture in Cameroon Revenue Share (%), by Fruits 2025 & 2033
- Figure 6: North America Agriculture in Cameroon Revenue (million), by Vegetables 2025 & 2033
- Figure 7: North America Agriculture in Cameroon Revenue Share (%), by Vegetables 2025 & 2033
- Figure 8: North America Agriculture in Cameroon Revenue (million), by Cash Crops 2025 & 2033
- Figure 9: North America Agriculture in Cameroon Revenue Share (%), by Cash Crops 2025 & 2033
- Figure 10: North America Agriculture in Cameroon Revenue (million), by Cereals 2025 & 2033
- Figure 11: North America Agriculture in Cameroon Revenue Share (%), by Cereals 2025 & 2033
- Figure 12: North America Agriculture in Cameroon Revenue (million), by Fruits 2025 & 2033
- Figure 13: North America Agriculture in Cameroon Revenue Share (%), by Fruits 2025 & 2033
- Figure 14: North America Agriculture in Cameroon Revenue (million), by Vegetables 2025 & 2033
- Figure 15: North America Agriculture in Cameroon Revenue Share (%), by Vegetables 2025 & 2033
- Figure 16: North America Agriculture in Cameroon Revenue (million), by Cash Crops 2025 & 2033
- Figure 17: North America Agriculture in Cameroon Revenue Share (%), by Cash Crops 2025 & 2033
- Figure 18: North America Agriculture in Cameroon Revenue (million), by Country 2025 & 2033
- Figure 19: North America Agriculture in Cameroon Revenue Share (%), by Country 2025 & 2033
- Figure 20: South America Agriculture in Cameroon Revenue (million), by Cereals 2025 & 2033
- Figure 21: South America Agriculture in Cameroon Revenue Share (%), by Cereals 2025 & 2033
- Figure 22: South America Agriculture in Cameroon Revenue (million), by Fruits 2025 & 2033
- Figure 23: South America Agriculture in Cameroon Revenue Share (%), by Fruits 2025 & 2033
- Figure 24: South America Agriculture in Cameroon Revenue (million), by Vegetables 2025 & 2033
- Figure 25: South America Agriculture in Cameroon Revenue Share (%), by Vegetables 2025 & 2033
- Figure 26: South America Agriculture in Cameroon Revenue (million), by Cash Crops 2025 & 2033
- Figure 27: South America Agriculture in Cameroon Revenue Share (%), by Cash Crops 2025 & 2033
- Figure 28: South America Agriculture in Cameroon Revenue (million), by Cereals 2025 & 2033
- Figure 29: South America Agriculture in Cameroon Revenue Share (%), by Cereals 2025 & 2033
- Figure 30: South America Agriculture in Cameroon Revenue (million), by Fruits 2025 & 2033
- Figure 31: South America Agriculture in Cameroon Revenue Share (%), by Fruits 2025 & 2033
- Figure 32: South America Agriculture in Cameroon Revenue (million), by Vegetables 2025 & 2033
- Figure 33: South America Agriculture in Cameroon Revenue Share (%), by Vegetables 2025 & 2033
- Figure 34: South America Agriculture in Cameroon Revenue (million), by Cash Crops 2025 & 2033
- Figure 35: South America Agriculture in Cameroon Revenue Share (%), by Cash Crops 2025 & 2033
- Figure 36: South America Agriculture in Cameroon Revenue (million), by Country 2025 & 2033
- Figure 37: South America Agriculture in Cameroon Revenue Share (%), by Country 2025 & 2033
- Figure 38: Europe Agriculture in Cameroon Revenue (million), by Cereals 2025 & 2033
- Figure 39: Europe Agriculture in Cameroon Revenue Share (%), by Cereals 2025 & 2033
- Figure 40: Europe Agriculture in Cameroon Revenue (million), by Fruits 2025 & 2033
- Figure 41: Europe Agriculture in Cameroon Revenue Share (%), by Fruits 2025 & 2033
- Figure 42: Europe Agriculture in Cameroon Revenue (million), by Vegetables 2025 & 2033
- Figure 43: Europe Agriculture in Cameroon Revenue Share (%), by Vegetables 2025 & 2033
- Figure 44: Europe Agriculture in Cameroon Revenue (million), by Cash Crops 2025 & 2033
- Figure 45: Europe Agriculture in Cameroon Revenue Share (%), by Cash Crops 2025 & 2033
- Figure 46: Europe Agriculture in Cameroon Revenue (million), by Cereals 2025 & 2033
- Figure 47: Europe Agriculture in Cameroon Revenue Share (%), by Cereals 2025 & 2033
- Figure 48: Europe Agriculture in Cameroon Revenue (million), by Fruits 2025 & 2033
- Figure 49: Europe Agriculture in Cameroon Revenue Share (%), by Fruits 2025 & 2033
- Figure 50: Europe Agriculture in Cameroon Revenue (million), by Vegetables 2025 & 2033
- Figure 51: Europe Agriculture in Cameroon Revenue Share (%), by Vegetables 2025 & 2033
- Figure 52: Europe Agriculture in Cameroon Revenue (million), by Cash Crops 2025 & 2033
- Figure 53: Europe Agriculture in Cameroon Revenue Share (%), by Cash Crops 2025 & 2033
- Figure 54: Europe Agriculture in Cameroon Revenue (million), by Country 2025 & 2033
- Figure 55: Europe Agriculture in Cameroon Revenue Share (%), by Country 2025 & 2033
- Figure 56: Middle East & Africa Agriculture in Cameroon Revenue (million), by Cereals 2025 & 2033
- Figure 57: Middle East & Africa Agriculture in Cameroon Revenue Share (%), by Cereals 2025 & 2033
- Figure 58: Middle East & Africa Agriculture in Cameroon Revenue (million), by Fruits 2025 & 2033
- Figure 59: Middle East & Africa Agriculture in Cameroon Revenue Share (%), by Fruits 2025 & 2033
- Figure 60: Middle East & Africa Agriculture in Cameroon Revenue (million), by Vegetables 2025 & 2033
- Figure 61: Middle East & Africa Agriculture in Cameroon Revenue Share (%), by Vegetables 2025 & 2033
- Figure 62: Middle East & Africa Agriculture in Cameroon Revenue (million), by Cash Crops 2025 & 2033
- Figure 63: Middle East & Africa Agriculture in Cameroon Revenue Share (%), by Cash Crops 2025 & 2033
- Figure 64: Middle East & Africa Agriculture in Cameroon Revenue (million), by Cereals 2025 & 2033
- Figure 65: Middle East & Africa Agriculture in Cameroon Revenue Share (%), by Cereals 2025 & 2033
- Figure 66: Middle East & Africa Agriculture in Cameroon Revenue (million), by Fruits 2025 & 2033
- Figure 67: Middle East & Africa Agriculture in Cameroon Revenue Share (%), by Fruits 2025 & 2033
- Figure 68: Middle East & Africa Agriculture in Cameroon Revenue (million), by Vegetables 2025 & 2033
- Figure 69: Middle East & Africa Agriculture in Cameroon Revenue Share (%), by Vegetables 2025 & 2033
- Figure 70: Middle East & Africa Agriculture in Cameroon Revenue (million), by Cash Crops 2025 & 2033
- Figure 71: Middle East & Africa Agriculture in Cameroon Revenue Share (%), by Cash Crops 2025 & 2033
- Figure 72: Middle East & Africa Agriculture in Cameroon Revenue (million), by Country 2025 & 2033
- Figure 73: Middle East & Africa Agriculture in Cameroon Revenue Share (%), by Country 2025 & 2033
- Figure 74: Asia Pacific Agriculture in Cameroon Revenue (million), by Cereals 2025 & 2033
- Figure 75: Asia Pacific Agriculture in Cameroon Revenue Share (%), by Cereals 2025 & 2033
- Figure 76: Asia Pacific Agriculture in Cameroon Revenue (million), by Fruits 2025 & 2033
- Figure 77: Asia Pacific Agriculture in Cameroon Revenue Share (%), by Fruits 2025 & 2033
- Figure 78: Asia Pacific Agriculture in Cameroon Revenue (million), by Vegetables 2025 & 2033
- Figure 79: Asia Pacific Agriculture in Cameroon Revenue Share (%), by Vegetables 2025 & 2033
- Figure 80: Asia Pacific Agriculture in Cameroon Revenue (million), by Cash Crops 2025 & 2033
- Figure 81: Asia Pacific Agriculture in Cameroon Revenue Share (%), by Cash Crops 2025 & 2033
- Figure 82: Asia Pacific Agriculture in Cameroon Revenue (million), by Cereals 2025 & 2033
- Figure 83: Asia Pacific Agriculture in Cameroon Revenue Share (%), by Cereals 2025 & 2033
- Figure 84: Asia Pacific Agriculture in Cameroon Revenue (million), by Fruits 2025 & 2033
- Figure 85: Asia Pacific Agriculture in Cameroon Revenue Share (%), by Fruits 2025 & 2033
- Figure 86: Asia Pacific Agriculture in Cameroon Revenue (million), by Vegetables 2025 & 2033
- Figure 87: Asia Pacific Agriculture in Cameroon Revenue Share (%), by Vegetables 2025 & 2033
- Figure 88: Asia Pacific Agriculture in Cameroon Revenue (million), by Cash Crops 2025 & 2033
- Figure 89: Asia Pacific Agriculture in Cameroon Revenue Share (%), by Cash Crops 2025 & 2033
- Figure 90: Asia Pacific Agriculture in Cameroon Revenue (million), by Country 2025 & 2033
- Figure 91: Asia Pacific Agriculture in Cameroon Revenue Share (%), by Country 2025 & 2033
List of Tables
- Table 1: Global Agriculture in Cameroon Revenue million Forecast, by Cereals 2020 & 2033
- Table 2: Global Agriculture in Cameroon Revenue million Forecast, by Fruits 2020 & 2033
- Table 3: Global Agriculture in Cameroon Revenue million Forecast, by Vegetables 2020 & 2033
- Table 4: Global Agriculture in Cameroon Revenue million Forecast, by Cash Crops 2020 & 2033
- Table 5: Global Agriculture in Cameroon Revenue million Forecast, by Cereals 2020 & 2033
- Table 6: Global Agriculture in Cameroon Revenue million Forecast, by Fruits 2020 & 2033
- Table 7: Global Agriculture in Cameroon Revenue million Forecast, by Vegetables 2020 & 2033
- Table 8: Global Agriculture in Cameroon Revenue million Forecast, by Cash Crops 2020 & 2033
- Table 9: Global Agriculture in Cameroon Revenue million Forecast, by Region 2020 & 2033
- Table 10: Global Agriculture in Cameroon Revenue million Forecast, by Cereals 2020 & 2033
- Table 11: Global Agriculture in Cameroon Revenue million Forecast, by Fruits 2020 & 2033
- Table 12: Global Agriculture in Cameroon Revenue million Forecast, by Vegetables 2020 & 2033
- Table 13: Global Agriculture in Cameroon Revenue million Forecast, by Cash Crops 2020 & 2033
- Table 14: Global Agriculture in Cameroon Revenue million Forecast, by Cereals 2020 & 2033
- Table 15: Global Agriculture in Cameroon Revenue million Forecast, by Fruits 2020 & 2033
- Table 16: Global Agriculture in Cameroon Revenue million Forecast, by Vegetables 2020 & 2033
- Table 17: Global Agriculture in Cameroon Revenue million Forecast, by Cash Crops 2020 & 2033
- Table 18: Global Agriculture in Cameroon Revenue million Forecast, by Country 2020 & 2033
- Table 19: United States Agriculture in Cameroon Revenue (million) Forecast, by Application 2020 & 2033
- Table 20: Canada Agriculture in Cameroon Revenue (million) Forecast, by Application 2020 & 2033
- Table 21: Mexico Agriculture in Cameroon Revenue (million) Forecast, by Application 2020 & 2033
- Table 22: Global Agriculture in Cameroon Revenue million Forecast, by Cereals 2020 & 2033
- Table 23: Global Agriculture in Cameroon Revenue million Forecast, by Fruits 2020 & 2033
- Table 24: Global Agriculture in Cameroon Revenue million Forecast, by Vegetables 2020 & 2033
- Table 25: Global Agriculture in Cameroon Revenue million Forecast, by Cash Crops 2020 & 2033
- Table 26: Global Agriculture in Cameroon Revenue million Forecast, by Cereals 2020 & 2033
- Table 27: Global Agriculture in Cameroon Revenue million Forecast, by Fruits 2020 & 2033
- Table 28: Global Agriculture in Cameroon Revenue million Forecast, by Vegetables 2020 & 2033
- Table 29: Global Agriculture in Cameroon Revenue million Forecast, by Cash Crops 2020 & 2033
- Table 30: Global Agriculture in Cameroon Revenue million Forecast, by Country 2020 & 2033
- Table 31: Brazil Agriculture in Cameroon Revenue (million) Forecast, by Application 2020 & 2033
- Table 32: Argentina Agriculture in Cameroon Revenue (million) Forecast, by Application 2020 & 2033
- Table 33: Rest of South America Agriculture in Cameroon Revenue (million) Forecast, by Application 2020 & 2033
- Table 34: Global Agriculture in Cameroon Revenue million Forecast, by Cereals 2020 & 2033
- Table 35: Global Agriculture in Cameroon Revenue million Forecast, by Fruits 2020 & 2033
- Table 36: Global Agriculture in Cameroon Revenue million Forecast, by Vegetables 2020 & 2033
- Table 37: Global Agriculture in Cameroon Revenue million Forecast, by Cash Crops 2020 & 2033
- Table 38: Global Agriculture in Cameroon Revenue million Forecast, by Cereals 2020 & 2033
- Table 39: Global Agriculture in Cameroon Revenue million Forecast, by Fruits 2020 & 2033
- Table 40: Global Agriculture in Cameroon Revenue million Forecast, by Vegetables 2020 & 2033
- Table 41: Global Agriculture in Cameroon Revenue million Forecast, by Cash Crops 2020 & 2033
- Table 42: Global Agriculture in Cameroon Revenue million Forecast, by Country 2020 & 2033
- Table 43: United Kingdom Agriculture in Cameroon Revenue (million) Forecast, by Application 2020 & 2033
- Table 44: Germany Agriculture in Cameroon Revenue (million) Forecast, by Application 2020 & 2033
- Table 45: France Agriculture in Cameroon Revenue (million) Forecast, by Application 2020 & 2033
- Table 46: Italy Agriculture in Cameroon Revenue (million) Forecast, by Application 2020 & 2033
- Table 47: Spain Agriculture in Cameroon Revenue (million) Forecast, by Application 2020 & 2033
- Table 48: Russia Agriculture in Cameroon Revenue (million) Forecast, by Application 2020 & 2033
- Table 49: Benelux Agriculture in Cameroon Revenue (million) Forecast, by Application 2020 & 2033
- Table 50: Nordics Agriculture in Cameroon Revenue (million) Forecast, by Application 2020 & 2033
- Table 51: Rest of Europe Agriculture in Cameroon Revenue (million) Forecast, by Application 2020 & 2033
- Table 52: Global Agriculture in Cameroon Revenue million Forecast, by Cereals 2020 & 2033
- Table 53: Global Agriculture in Cameroon Revenue million Forecast, by Fruits 2020 & 2033
- Table 54: Global Agriculture in Cameroon Revenue million Forecast, by Vegetables 2020 & 2033
- Table 55: Global Agriculture in Cameroon Revenue million Forecast, by Cash Crops 2020 & 2033
- Table 56: Global Agriculture in Cameroon Revenue million Forecast, by Cereals 2020 & 2033
- Table 57: Global Agriculture in Cameroon Revenue million Forecast, by Fruits 2020 & 2033
- Table 58: Global Agriculture in Cameroon Revenue million Forecast, by Vegetables 2020 & 2033
- Table 59: Global Agriculture in Cameroon Revenue million Forecast, by Cash Crops 2020 & 2033
- Table 60: Global Agriculture in Cameroon Revenue million Forecast, by Country 2020 & 2033
- Table 61: Turkey Agriculture in Cameroon Revenue (million) Forecast, by Application 2020 & 2033
- Table 62: Israel Agriculture in Cameroon Revenue (million) Forecast, by Application 2020 & 2033
- Table 63: GCC Agriculture in Cameroon Revenue (million) Forecast, by Application 2020 & 2033
- Table 64: North Africa Agriculture in Cameroon Revenue (million) Forecast, by Application 2020 & 2033
- Table 65: South Africa Agriculture in Cameroon Revenue (million) Forecast, by Application 2020 & 2033
- Table 66: Rest of Middle East & Africa Agriculture in Cameroon Revenue (million) Forecast, by Application 2020 & 2033
- Table 67: Global Agriculture in Cameroon Revenue million Forecast, by Cereals 2020 & 2033
- Table 68: Global Agriculture in Cameroon Revenue million Forecast, by Fruits 2020 & 2033
- Table 69: Global Agriculture in Cameroon Revenue million Forecast, by Vegetables 2020 & 2033
- Table 70: Global Agriculture in Cameroon Revenue million Forecast, by Cash Crops 2020 & 2033
- Table 71: Global Agriculture in Cameroon Revenue million Forecast, by Cereals 2020 & 2033
- Table 72: Global Agriculture in Cameroon Revenue million Forecast, by Fruits 2020 & 2033
- Table 73: Global Agriculture in Cameroon Revenue million Forecast, by Vegetables 2020 & 2033
- Table 74: Global Agriculture in Cameroon Revenue million Forecast, by Cash Crops 2020 & 2033
- Table 75: Global Agriculture in Cameroon Revenue million Forecast, by Country 2020 & 2033
- Table 76: China Agriculture in Cameroon Revenue (million) Forecast, by Application 2020 & 2033
- Table 77: India Agriculture in Cameroon Revenue (million) Forecast, by Application 2020 & 2033
- Table 78: Japan Agriculture in Cameroon Revenue (million) Forecast, by Application 2020 & 2033
- Table 79: South Korea Agriculture in Cameroon Revenue (million) Forecast, by Application 2020 & 2033
- Table 80: ASEAN Agriculture in Cameroon Revenue (million) Forecast, by Application 2020 & 2033
- Table 81: Oceania Agriculture in Cameroon Revenue (million) Forecast, by Application 2020 & 2033
- Table 82: Rest of Asia Pacific Agriculture in Cameroon Revenue (million) Forecast, by Application 2020 & 2033
Frequently Asked Questions
1. What is the projected Compound Annual Growth Rate (CAGR) of the Agriculture in Cameroon?
The projected CAGR is approximately 6%.
2. Which companies are prominent players in the Agriculture in Cameroon?
Key companies in the market include Syngenta , Bayer CropScience , Cameroon Development Corporation, Société Camerounaise de Transformation de Métaux, Limagrain .
3. What are the main segments of the Agriculture in Cameroon?
The market segments include Cereals, Fruits, Vegetables, Cash Crops, Cereals, Fruits, Vegetables, Cash Crops.
4. Can you provide details about the market size?
The market size is estimated to be USD 491577 million as of 2022.
5. What are some drivers contributing to market growth?
; Increasing Food Security Concerns; Inclination Toward a Healthy Lifestyle.
6. What are the notable trends driving market growth?
Growing Consumer Preference for Locally Produced Fruits and Vegetables.
7. Are there any restraints impacting market growth?
; Unfavorable Climatic Conditions; Higher Market Entry Cost.
8. Can you provide examples of recent developments in the market?
November 2022: The International Development Association of the World Bank agreed on a USD 200 million loan to support the development of irrigation infrastructure which aims to support regional water security and governance of water resources, also promote agriculture and agribusiness production, and support the implementation of a new rice cultivation plan.
9. What pricing options are available for accessing the report?
Pricing options include single-user, multi-user, and enterprise licenses priced at USD 3800, USD 4500, and USD 5800 respectively.
10. Is the market size provided in terms of value or volume?
The market size is provided in terms of value, measured in million.
11. Are there any specific market keywords associated with the report?
Yes, the market keyword associated with the report is "Agriculture in Cameroon," which aids in identifying and referencing the specific market segment covered.
12. How do I determine which pricing option suits my needs best?
The pricing options vary based on user requirements and access needs. Individual users may opt for single-user licenses, while businesses requiring broader access may choose multi-user or enterprise licenses for cost-effective access to the report.
13. Are there any additional resources or data provided in the Agriculture in Cameroon report?
While the report offers comprehensive insights, it's advisable to review the specific contents or supplementary materials provided to ascertain if additional resources or data are available.
14. How can I stay updated on further developments or reports in the Agriculture in Cameroon?
To stay informed about further developments, trends, and reports in the Agriculture in Cameroon, consider subscribing to industry newsletters, following relevant companies and organizations, or regularly checking reputable industry news sources and publications.
Methodology
Step 1 - Identification of Relevant Samples Size from Population Database


Step 2 - Approaches for Defining Global Market Size (Value, Volume* & Price*)

Note*: In applicable scenarios
Step 3 - Data Sources
Primary Research
- Web Analytics
- Survey Reports
- Research Institute
- Latest Research Reports
- Opinion Leaders
Secondary Research
- Annual Reports
- White Paper
- Latest Press Release
- Industry Association
- Paid Database
- Investor Presentations

Step 4 - Data Triangulation
Involves using different sources of information in order to increase the validity of a study
These sources are likely to be stakeholders in a program - participants, other researchers, program staff, other community members, and so on.
Then we put all data in single framework & apply various statistical tools to find out the dynamic on the market.
During the analysis stage, feedback from the stakeholder groups would be compared to determine areas of agreement as well as areas of divergence