

Key Insights
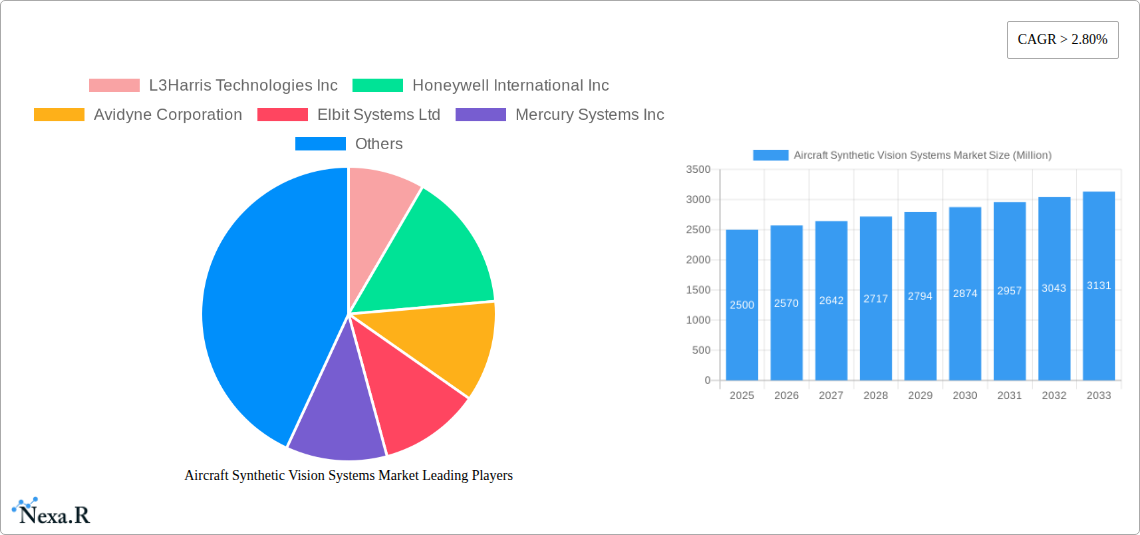
The Aircraft Synthetic Vision Systems (SVS) market is experiencing robust growth, driven by increasing demand for enhanced situational awareness and safety features in both commercial and military aviation. The market, currently valued at an estimated $2.5 billion in 2025, is projected to grow at a compound annual growth rate (CAGR) of over 2.80% from 2025 to 2033. This expansion is fueled by several key factors. Firstly, stringent safety regulations and the growing adoption of advanced cockpit technologies are pushing airlines and aircraft manufacturers to integrate SVS into their fleets. Secondly, the increasing complexity of airspace and the need to improve pilot performance in challenging weather conditions further bolster the demand for SVS. Furthermore, advancements in display technology, such as improved resolution and enhanced graphical capabilities, are making SVS more accessible and user-friendly. The integration of SVS with other advanced pilot assistance systems, such as traffic collision avoidance systems (TCAS) and weather radar, is also contributing to market growth. The market is segmented by type (Primary Flight Display, Navigation Display, Heads-up and Helmet-mounted Display, Other Types) and end-user (Military, Commercial, General Aviation), with the commercial aviation segment currently holding a significant market share due to the large number of commercial aircraft in operation globally. North America and Europe are expected to remain dominant regions, driven by robust regulatory frameworks and substantial investments in aerospace technology. However, the Asia-Pacific region is poised for significant growth due to rising air travel and increasing government support for modernization of aviation infrastructure.
Competition in the Aircraft Synthetic Vision Systems market is intense, with key players like L3Harris Technologies, Honeywell International, Avidyne, Elbit Systems, and Garmin vying for market share through continuous product innovation and strategic partnerships. The market landscape is characterized by a mix of large, established players with extensive experience in avionics and smaller, specialized companies offering niche solutions. Future growth opportunities are likely to arise from the development of more advanced SVS functionalities, including enhanced terrain awareness, obstacle detection, and improved integration with other aircraft systems. Moreover, the ongoing research and development in areas like augmented reality (AR) and artificial intelligence (AI) offer significant potential to further enhance the capabilities of SVS, thus contributing to ongoing market expansion. However, high initial investment costs associated with SVS integration and potential challenges related to regulatory approvals may act as constraints on market growth.
Aircraft Synthetic Vision Systems Market: A Comprehensive Market Report (2019-2033)
This comprehensive report provides an in-depth analysis of the Aircraft Synthetic Vision Systems market, encompassing market dynamics, growth trends, regional analysis, product landscape, and key players. The study period spans from 2019 to 2033, with 2025 serving as the base and estimated year. The report offers valuable insights for industry professionals, investors, and stakeholders seeking to understand and capitalize on the opportunities within this rapidly evolving sector. The parent market is the Avionics Systems Market and the child market is the Flight Display Systems Market.
Aircraft Synthetic Vision Systems Market Dynamics & Structure
The Aircraft Synthetic Vision Systems market is characterized by a moderately consolidated structure with key players like L3Harris Technologies Inc, Honeywell International Inc, and Collins Aerospace holding significant market share. Technological innovation, driven by advancements in sensor technology, processing power, and display capabilities, is a major growth driver. Stringent regulatory frameworks, particularly concerning safety and certification, influence market dynamics. Competitive substitutes include traditional flight instruments, but synthetic vision systems offer superior situational awareness, enhancing their adoption. End-user demographics are primarily driven by the needs of commercial, military, and general aviation sectors. The market has witnessed a moderate level of M&A activity in recent years, with companies strategically acquiring smaller firms to expand their product portfolio and market reach.
- Market Concentration: Moderately Consolidated (Top 5 players hold approximately xx% market share in 2025)
- Technological Innovation Drivers: Advancements in sensor fusion, improved image processing, and high-resolution displays.
- Regulatory Frameworks: Stringent safety certifications (e.g., FAA, EASA) are essential for market entry.
- Competitive Product Substitutes: Traditional flight instruments, but with limited situational awareness capabilities.
- End-User Demographics: Commercial aviation accounts for the largest share, followed by military and general aviation.
- M&A Trends: Moderate activity with strategic acquisitions to enhance product offerings and market penetration. (xx M&A deals in the past 5 years).
Aircraft Synthetic Vision Systems Market Growth Trends & Insights
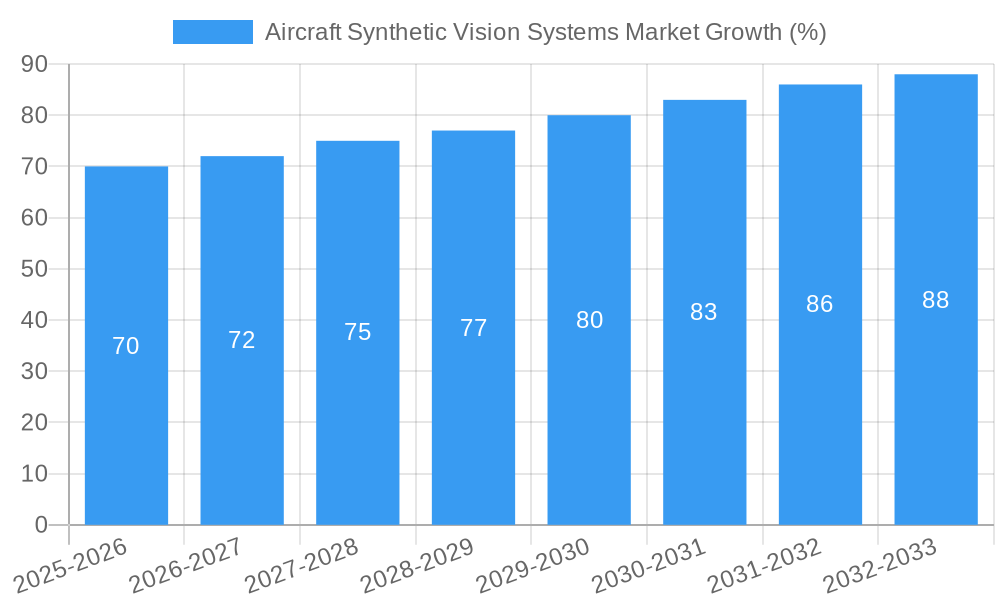
The Aircraft Synthetic Vision Systems market is experiencing robust growth, driven by the increasing demand for enhanced safety and situational awareness in aviation. The market size is projected to reach xx million units by 2033, exhibiting a CAGR of xx% during the forecast period (2025-2033). Adoption rates are rising steadily, particularly in commercial aviation, due to regulatory mandates and the proven benefits of synthetic vision systems in improving flight safety, especially during low-visibility conditions. Technological advancements, such as the integration of advanced sensor technologies and artificial intelligence, are further fueling market growth. Consumer behavior is shifting towards greater adoption of advanced cockpit technologies offering improved operational efficiency and safety.
- Market Size Evolution: From xx million units in 2019 to an estimated xx million units in 2025, projected to reach xx million units by 2033.
- Adoption Rates: Steady increase, particularly in commercial aviation, driven by safety regulations and improved operational efficiency.
- Technological Disruptions: Integration of AI and machine learning for enhanced situational awareness and automated flight assistance.
- Consumer Behavior Shifts: Growing preference for advanced cockpit technologies that improve safety, efficiency, and pilot workload.
Dominant Regions, Countries, or Segments in Aircraft Synthetic Vision Systems Market
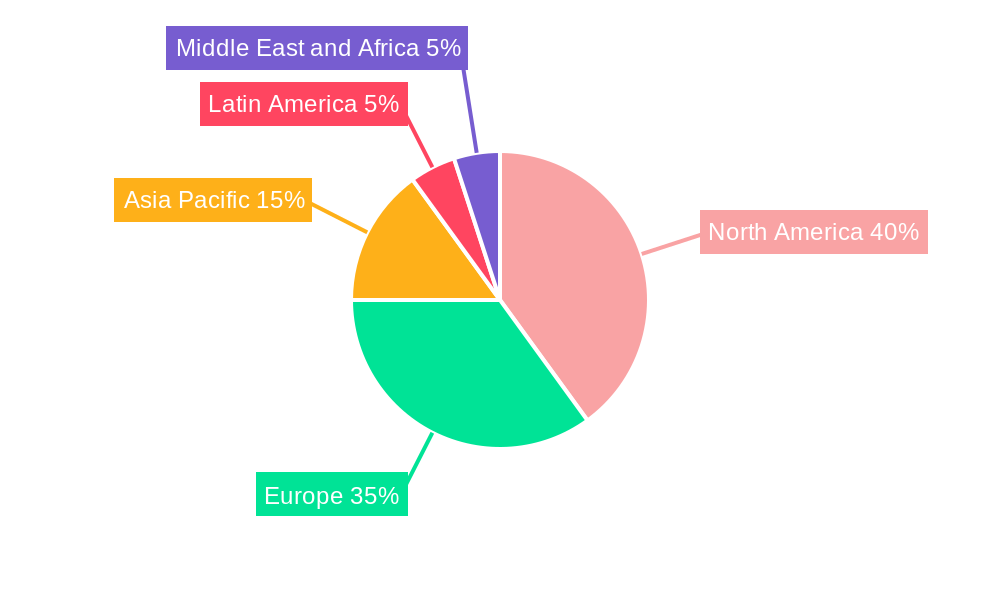
North America currently dominates the Aircraft Synthetic Vision Systems market, driven by strong technological advancements, a large commercial aviation fleet, and stringent safety regulations. Within the segments, the Primary Flight Display segment holds the largest market share due to its widespread adoption across various aircraft types. The Commercial aviation end-user segment is the leading driver of market growth due to the high volume of commercial flights and increasing demand for advanced safety features.
- Leading Region: North America (holds xx% market share in 2025)
- Key Drivers (North America): Stringent safety regulations, large commercial aviation fleet, and significant technological advancements.
- Leading Segment (By Type): Primary Flight Display (holds xx% market share in 2025) due to its essential role in flight operations.
- Leading End-User Segment: Commercial Aviation (holds xx% market share in 2025) due to its volume and demand for enhanced safety.
Aircraft Synthetic Vision Systems Market Product Landscape
Synthetic vision systems are evolving rapidly, integrating advanced features such as enhanced terrain awareness, obstacle detection, and weather depiction. These systems offer superior situational awareness, improved pilot workload management, and enhanced safety, especially during low visibility conditions. Key product innovations include the integration of high-resolution displays, advanced sensor fusion techniques, and AI-powered algorithms for improved performance. The unique selling propositions of these systems include enhanced safety, reduced pilot workload, and improved operational efficiency.
Key Drivers, Barriers & Challenges in Aircraft Synthetic Vision Systems Market
Key Drivers:
- Increasing demand for enhanced safety and situational awareness in aviation.
- Stringent safety regulations mandating advanced cockpit technologies.
- Growing adoption of advanced flight management systems.
- Technological advancements leading to improved performance and functionality.
Key Challenges and Restraints:
- High initial investment costs associated with system integration and maintenance.
- Complexity of system integration across different aircraft platforms.
- Potential certification challenges and regulatory hurdles.
- Competitive pressure from established players and emerging technologies.
Emerging Opportunities in Aircraft Synthetic Vision Systems Market
- Growing demand for synthetic vision systems in emerging economies with expanding aviation sectors.
- Integration of synthetic vision systems with unmanned aerial vehicles (UAVs).
- Development of cost-effective and lightweight synthetic vision systems for smaller aircraft.
- Exploration of new applications, such as augmented reality overlays for enhanced situational awareness.
Growth Accelerators in the Aircraft Synthetic Vision Systems Market Industry
Long-term growth in the Aircraft Synthetic Vision Systems market is driven by several factors, including ongoing technological advancements that enhance system performance and capabilities, the formation of strategic partnerships between leading technology providers and aircraft manufacturers, and the expansion of the market into new geographic regions with growing aviation sectors.
Key Players Shaping the Aircraft Synthetic Vision Systems Market Market
- L3Harris Technologies Inc
- Honeywell International Inc
- Avidyne Corporation
- Elbit Systems Ltd
- Mercury Systems Inc
- Garmin Ltd
- Cobham Limited
- Safran SA
- Thales Group
- ENSCO Inc
- Aspen Avionics Inc
- Collins Aerospace (Raytheon Technologies Corporation)
Notable Milestones in Aircraft Synthetic Vision Systems Market Sector
- October 2022: Collins Aerospace achieved a Technical Standard Order (TSO) for its Combined Vision System (CVS) for business aviation aircraft.
- October 2022: Garmin International Inc. announced Supplemental Type Certification (STC) for the GI 275 electronic flight instrument in the Dassault Falcon 7X business jet.
- October 2021: Honeywell unveiled the Anthem flight deck, a new aircraft cockpit system with cloud connectivity.
In-Depth Aircraft Synthetic Vision Systems Market Market Outlook
The Aircraft Synthetic Vision Systems market is poised for continued growth, driven by technological advancements, increasing safety regulations, and expanding global air travel. Strategic partnerships and investments in research and development will further fuel market expansion. The integration of AI and machine learning will revolutionize the capabilities of synthetic vision systems, opening new opportunities in areas like autonomous flight and enhanced situational awareness. The market's future potential is significant, offering attractive opportunities for companies to innovate and capitalize on the growing demand for advanced aviation technologies.
Aircraft Synthetic Vision Systems Market Segmentation
-
1. Type
- 1.1. Primary Flight Display
- 1.2. Navigation Display
- 1.3. Heads-up and Helmet-mounted Display
- 1.4. Other Types
-
2. End User
- 2.1. Military
- 2.2. Commercial
- 2.3. General Aviation
Aircraft Synthetic Vision Systems Market Segmentation By Geography
-
1. North America
- 1.1. United States
- 1.2. Canada
-
2. Europe
- 2.1. Germany
- 2.2. United Kingdom
- 2.3. France
- 2.4. Russia
- 2.5. Rest of Europe
-
3. Asia Pacific
- 3.1. China
- 3.2. Japan
- 3.3. India
- 3.4. South Korea
- 3.5. Rest of Asia Pacific
-
4. Latin America
- 4.1. Brazil
- 4.2. Mexico
- 4.3. Rest of Latin America
-
5. Middle East and Africa
- 5.1. United Arab Emirates
- 5.2. Saudi Arabia
- 5.3. Egypt
- 5.4. Rest of Middle East and Africa
Aircraft Synthetic Vision Systems Market REPORT HIGHLIGHTS
| Aspects | Details |
|---|---|
| Study Period | 2019-2033 |
| Base Year | 2024 |
| Estimated Year | 2025 |
| Forecast Period | 2025-2033 |
| Historical Period | 2019-2024 |
| Growth Rate | CAGR of > 2.80% from 2019-2033 |
| Segmentation |
|
Table of Contents
- 1. Introduction
- 1.1. Research Scope
- 1.2. Market Segmentation
- 1.3. Research Methodology
- 1.4. Definitions and Assumptions
- 2. Executive Summary
- 2.1. Introduction
- 3. Market Dynamics
- 3.1. Introduction
- 3.2. Market Drivers
- 3.3. Market Restrains
- 3.4. Market Trends
- 3.4.1. Military End-user to Witness Higher Growth During the Forecast Period
- 4. Market Factor Analysis
- 4.1. Porters Five Forces
- 4.2. Supply/Value Chain
- 4.3. PESTEL analysis
- 4.4. Market Entropy
- 4.5. Patent/Trademark Analysis
- 5. Global Aircraft Synthetic Vision Systems Market Analysis, Insights and Forecast, 2019-2031
- 5.1. Market Analysis, Insights and Forecast - by Type
- 5.1.1. Primary Flight Display
- 5.1.2. Navigation Display
- 5.1.3. Heads-up and Helmet-mounted Display
- 5.1.4. Other Types
- 5.2. Market Analysis, Insights and Forecast - by End User
- 5.2.1. Military
- 5.2.2. Commercial
- 5.2.3. General Aviation
- 5.3. Market Analysis, Insights and Forecast - by Region
- 5.3.1. North America
- 5.3.2. Europe
- 5.3.3. Asia Pacific
- 5.3.4. Latin America
- 5.3.5. Middle East and Africa
- 5.1. Market Analysis, Insights and Forecast - by Type
- 6. North America Aircraft Synthetic Vision Systems Market Analysis, Insights and Forecast, 2019-2031
- 6.1. Market Analysis, Insights and Forecast - by Type
- 6.1.1. Primary Flight Display
- 6.1.2. Navigation Display
- 6.1.3. Heads-up and Helmet-mounted Display
- 6.1.4. Other Types
- 6.2. Market Analysis, Insights and Forecast - by End User
- 6.2.1. Military
- 6.2.2. Commercial
- 6.2.3. General Aviation
- 6.1. Market Analysis, Insights and Forecast - by Type
- 7. Europe Aircraft Synthetic Vision Systems Market Analysis, Insights and Forecast, 2019-2031
- 7.1. Market Analysis, Insights and Forecast - by Type
- 7.1.1. Primary Flight Display
- 7.1.2. Navigation Display
- 7.1.3. Heads-up and Helmet-mounted Display
- 7.1.4. Other Types
- 7.2. Market Analysis, Insights and Forecast - by End User
- 7.2.1. Military
- 7.2.2. Commercial
- 7.2.3. General Aviation
- 7.1. Market Analysis, Insights and Forecast - by Type
- 8. Asia Pacific Aircraft Synthetic Vision Systems Market Analysis, Insights and Forecast, 2019-2031
- 8.1. Market Analysis, Insights and Forecast - by Type
- 8.1.1. Primary Flight Display
- 8.1.2. Navigation Display
- 8.1.3. Heads-up and Helmet-mounted Display
- 8.1.4. Other Types
- 8.2. Market Analysis, Insights and Forecast - by End User
- 8.2.1. Military
- 8.2.2. Commercial
- 8.2.3. General Aviation
- 8.1. Market Analysis, Insights and Forecast - by Type
- 9. Latin America Aircraft Synthetic Vision Systems Market Analysis, Insights and Forecast, 2019-2031
- 9.1. Market Analysis, Insights and Forecast - by Type
- 9.1.1. Primary Flight Display
- 9.1.2. Navigation Display
- 9.1.3. Heads-up and Helmet-mounted Display
- 9.1.4. Other Types
- 9.2. Market Analysis, Insights and Forecast - by End User
- 9.2.1. Military
- 9.2.2. Commercial
- 9.2.3. General Aviation
- 9.1. Market Analysis, Insights and Forecast - by Type
- 10. Middle East and Africa Aircraft Synthetic Vision Systems Market Analysis, Insights and Forecast, 2019-2031
- 10.1. Market Analysis, Insights and Forecast - by Type
- 10.1.1. Primary Flight Display
- 10.1.2. Navigation Display
- 10.1.3. Heads-up and Helmet-mounted Display
- 10.1.4. Other Types
- 10.2. Market Analysis, Insights and Forecast - by End User
- 10.2.1. Military
- 10.2.2. Commercial
- 10.2.3. General Aviation
- 10.1. Market Analysis, Insights and Forecast - by Type
- 11. North America Aircraft Synthetic Vision Systems Market Analysis, Insights and Forecast, 2019-2031
- 11.1. Market Analysis, Insights and Forecast - By Country/Sub-region
- 11.1.1 United States
- 11.1.2 Canada
- 12. Europe Aircraft Synthetic Vision Systems Market Analysis, Insights and Forecast, 2019-2031
- 12.1. Market Analysis, Insights and Forecast - By Country/Sub-region
- 12.1.1 Germany
- 12.1.2 United Kingdom
- 12.1.3 France
- 12.1.4 Russia
- 12.1.5 Rest of Europe
- 13. Asia Pacific Aircraft Synthetic Vision Systems Market Analysis, Insights and Forecast, 2019-2031
- 13.1. Market Analysis, Insights and Forecast - By Country/Sub-region
- 13.1.1 China
- 13.1.2 Japan
- 13.1.3 India
- 13.1.4 South Korea
- 13.1.5 Rest of Asia Pacific
- 14. Latin America Aircraft Synthetic Vision Systems Market Analysis, Insights and Forecast, 2019-2031
- 14.1. Market Analysis, Insights and Forecast - By Country/Sub-region
- 14.1.1 Brazil
- 14.1.2 Mexico
- 14.1.3 Rest of Latin America
- 15. Middle East and Africa Aircraft Synthetic Vision Systems Market Analysis, Insights and Forecast, 2019-2031
- 15.1. Market Analysis, Insights and Forecast - By Country/Sub-region
- 15.1.1 United Arab Emirates
- 15.1.2 Saudi Arabia
- 15.1.3 Egypt
- 15.1.4 Rest of Middle East and Africa
- 16. Competitive Analysis
- 16.1. Global Market Share Analysis 2024
- 16.2. Company Profiles
- 16.2.1 L3Harris Technologies Inc
- 16.2.1.1. Overview
- 16.2.1.2. Products
- 16.2.1.3. SWOT Analysis
- 16.2.1.4. Recent Developments
- 16.2.1.5. Financials (Based on Availability)
- 16.2.2 Honeywell International Inc
- 16.2.2.1. Overview
- 16.2.2.2. Products
- 16.2.2.3. SWOT Analysis
- 16.2.2.4. Recent Developments
- 16.2.2.5. Financials (Based on Availability)
- 16.2.3 Avidyne Corporation
- 16.2.3.1. Overview
- 16.2.3.2. Products
- 16.2.3.3. SWOT Analysis
- 16.2.3.4. Recent Developments
- 16.2.3.5. Financials (Based on Availability)
- 16.2.4 Elbit Systems Ltd
- 16.2.4.1. Overview
- 16.2.4.2. Products
- 16.2.4.3. SWOT Analysis
- 16.2.4.4. Recent Developments
- 16.2.4.5. Financials (Based on Availability)
- 16.2.5 Mercury Systems Inc
- 16.2.5.1. Overview
- 16.2.5.2. Products
- 16.2.5.3. SWOT Analysis
- 16.2.5.4. Recent Developments
- 16.2.5.5. Financials (Based on Availability)
- 16.2.6 Garmin Ltd
- 16.2.6.1. Overview
- 16.2.6.2. Products
- 16.2.6.3. SWOT Analysis
- 16.2.6.4. Recent Developments
- 16.2.6.5. Financials (Based on Availability)
- 16.2.7 Cobham Limited
- 16.2.7.1. Overview
- 16.2.7.2. Products
- 16.2.7.3. SWOT Analysis
- 16.2.7.4. Recent Developments
- 16.2.7.5. Financials (Based on Availability)
- 16.2.8 Safran SA
- 16.2.8.1. Overview
- 16.2.8.2. Products
- 16.2.8.3. SWOT Analysis
- 16.2.8.4. Recent Developments
- 16.2.8.5. Financials (Based on Availability)
- 16.2.9 Thales Group
- 16.2.9.1. Overview
- 16.2.9.2. Products
- 16.2.9.3. SWOT Analysis
- 16.2.9.4. Recent Developments
- 16.2.9.5. Financials (Based on Availability)
- 16.2.10 ENSCO Inc
- 16.2.10.1. Overview
- 16.2.10.2. Products
- 16.2.10.3. SWOT Analysis
- 16.2.10.4. Recent Developments
- 16.2.10.5. Financials (Based on Availability)
- 16.2.11 Aspen Avionics Inc
- 16.2.11.1. Overview
- 16.2.11.2. Products
- 16.2.11.3. SWOT Analysis
- 16.2.11.4. Recent Developments
- 16.2.11.5. Financials (Based on Availability)
- 16.2.12 Collins Aerospace (Raytheon Technologies Corporation)
- 16.2.12.1. Overview
- 16.2.12.2. Products
- 16.2.12.3. SWOT Analysis
- 16.2.12.4. Recent Developments
- 16.2.12.5. Financials (Based on Availability)
- 16.2.1 L3Harris Technologies Inc
List of Figures
- Figure 1: Global Aircraft Synthetic Vision Systems Market Revenue Breakdown (Million, %) by Region 2024 & 2032
- Figure 2: North America Aircraft Synthetic Vision Systems Market Revenue (Million), by Country 2024 & 2032
- Figure 3: North America Aircraft Synthetic Vision Systems Market Revenue Share (%), by Country 2024 & 2032
- Figure 4: Europe Aircraft Synthetic Vision Systems Market Revenue (Million), by Country 2024 & 2032
- Figure 5: Europe Aircraft Synthetic Vision Systems Market Revenue Share (%), by Country 2024 & 2032
- Figure 6: Asia Pacific Aircraft Synthetic Vision Systems Market Revenue (Million), by Country 2024 & 2032
- Figure 7: Asia Pacific Aircraft Synthetic Vision Systems Market Revenue Share (%), by Country 2024 & 2032
- Figure 8: Latin America Aircraft Synthetic Vision Systems Market Revenue (Million), by Country 2024 & 2032
- Figure 9: Latin America Aircraft Synthetic Vision Systems Market Revenue Share (%), by Country 2024 & 2032
- Figure 10: Middle East and Africa Aircraft Synthetic Vision Systems Market Revenue (Million), by Country 2024 & 2032
- Figure 11: Middle East and Africa Aircraft Synthetic Vision Systems Market Revenue Share (%), by Country 2024 & 2032
- Figure 12: North America Aircraft Synthetic Vision Systems Market Revenue (Million), by Type 2024 & 2032
- Figure 13: North America Aircraft Synthetic Vision Systems Market Revenue Share (%), by Type 2024 & 2032
- Figure 14: North America Aircraft Synthetic Vision Systems Market Revenue (Million), by End User 2024 & 2032
- Figure 15: North America Aircraft Synthetic Vision Systems Market Revenue Share (%), by End User 2024 & 2032
- Figure 16: North America Aircraft Synthetic Vision Systems Market Revenue (Million), by Country 2024 & 2032
- Figure 17: North America Aircraft Synthetic Vision Systems Market Revenue Share (%), by Country 2024 & 2032
- Figure 18: Europe Aircraft Synthetic Vision Systems Market Revenue (Million), by Type 2024 & 2032
- Figure 19: Europe Aircraft Synthetic Vision Systems Market Revenue Share (%), by Type 2024 & 2032
- Figure 20: Europe Aircraft Synthetic Vision Systems Market Revenue (Million), by End User 2024 & 2032
- Figure 21: Europe Aircraft Synthetic Vision Systems Market Revenue Share (%), by End User 2024 & 2032
- Figure 22: Europe Aircraft Synthetic Vision Systems Market Revenue (Million), by Country 2024 & 2032
- Figure 23: Europe Aircraft Synthetic Vision Systems Market Revenue Share (%), by Country 2024 & 2032
- Figure 24: Asia Pacific Aircraft Synthetic Vision Systems Market Revenue (Million), by Type 2024 & 2032
- Figure 25: Asia Pacific Aircraft Synthetic Vision Systems Market Revenue Share (%), by Type 2024 & 2032
- Figure 26: Asia Pacific Aircraft Synthetic Vision Systems Market Revenue (Million), by End User 2024 & 2032
- Figure 27: Asia Pacific Aircraft Synthetic Vision Systems Market Revenue Share (%), by End User 2024 & 2032
- Figure 28: Asia Pacific Aircraft Synthetic Vision Systems Market Revenue (Million), by Country 2024 & 2032
- Figure 29: Asia Pacific Aircraft Synthetic Vision Systems Market Revenue Share (%), by Country 2024 & 2032
- Figure 30: Latin America Aircraft Synthetic Vision Systems Market Revenue (Million), by Type 2024 & 2032
- Figure 31: Latin America Aircraft Synthetic Vision Systems Market Revenue Share (%), by Type 2024 & 2032
- Figure 32: Latin America Aircraft Synthetic Vision Systems Market Revenue (Million), by End User 2024 & 2032
- Figure 33: Latin America Aircraft Synthetic Vision Systems Market Revenue Share (%), by End User 2024 & 2032
- Figure 34: Latin America Aircraft Synthetic Vision Systems Market Revenue (Million), by Country 2024 & 2032
- Figure 35: Latin America Aircraft Synthetic Vision Systems Market Revenue Share (%), by Country 2024 & 2032
- Figure 36: Middle East and Africa Aircraft Synthetic Vision Systems Market Revenue (Million), by Type 2024 & 2032
- Figure 37: Middle East and Africa Aircraft Synthetic Vision Systems Market Revenue Share (%), by Type 2024 & 2032
- Figure 38: Middle East and Africa Aircraft Synthetic Vision Systems Market Revenue (Million), by End User 2024 & 2032
- Figure 39: Middle East and Africa Aircraft Synthetic Vision Systems Market Revenue Share (%), by End User 2024 & 2032
- Figure 40: Middle East and Africa Aircraft Synthetic Vision Systems Market Revenue (Million), by Country 2024 & 2032
- Figure 41: Middle East and Africa Aircraft Synthetic Vision Systems Market Revenue Share (%), by Country 2024 & 2032
List of Tables
- Table 1: Global Aircraft Synthetic Vision Systems Market Revenue Million Forecast, by Region 2019 & 2032
- Table 2: Global Aircraft Synthetic Vision Systems Market Revenue Million Forecast, by Type 2019 & 2032
- Table 3: Global Aircraft Synthetic Vision Systems Market Revenue Million Forecast, by End User 2019 & 2032
- Table 4: Global Aircraft Synthetic Vision Systems Market Revenue Million Forecast, by Region 2019 & 2032
- Table 5: Global Aircraft Synthetic Vision Systems Market Revenue Million Forecast, by Country 2019 & 2032
- Table 6: United States Aircraft Synthetic Vision Systems Market Revenue (Million) Forecast, by Application 2019 & 2032
- Table 7: Canada Aircraft Synthetic Vision Systems Market Revenue (Million) Forecast, by Application 2019 & 2032
- Table 8: Global Aircraft Synthetic Vision Systems Market Revenue Million Forecast, by Country 2019 & 2032
- Table 9: Germany Aircraft Synthetic Vision Systems Market Revenue (Million) Forecast, by Application 2019 & 2032
- Table 10: United Kingdom Aircraft Synthetic Vision Systems Market Revenue (Million) Forecast, by Application 2019 & 2032
- Table 11: France Aircraft Synthetic Vision Systems Market Revenue (Million) Forecast, by Application 2019 & 2032
- Table 12: Russia Aircraft Synthetic Vision Systems Market Revenue (Million) Forecast, by Application 2019 & 2032
- Table 13: Rest of Europe Aircraft Synthetic Vision Systems Market Revenue (Million) Forecast, by Application 2019 & 2032
- Table 14: Global Aircraft Synthetic Vision Systems Market Revenue Million Forecast, by Country 2019 & 2032
- Table 15: China Aircraft Synthetic Vision Systems Market Revenue (Million) Forecast, by Application 2019 & 2032
- Table 16: Japan Aircraft Synthetic Vision Systems Market Revenue (Million) Forecast, by Application 2019 & 2032
- Table 17: India Aircraft Synthetic Vision Systems Market Revenue (Million) Forecast, by Application 2019 & 2032
- Table 18: South Korea Aircraft Synthetic Vision Systems Market Revenue (Million) Forecast, by Application 2019 & 2032
- Table 19: Rest of Asia Pacific Aircraft Synthetic Vision Systems Market Revenue (Million) Forecast, by Application 2019 & 2032
- Table 20: Global Aircraft Synthetic Vision Systems Market Revenue Million Forecast, by Country 2019 & 2032
- Table 21: Brazil Aircraft Synthetic Vision Systems Market Revenue (Million) Forecast, by Application 2019 & 2032
- Table 22: Mexico Aircraft Synthetic Vision Systems Market Revenue (Million) Forecast, by Application 2019 & 2032
- Table 23: Rest of Latin America Aircraft Synthetic Vision Systems Market Revenue (Million) Forecast, by Application 2019 & 2032
- Table 24: Global Aircraft Synthetic Vision Systems Market Revenue Million Forecast, by Country 2019 & 2032
- Table 25: United Arab Emirates Aircraft Synthetic Vision Systems Market Revenue (Million) Forecast, by Application 2019 & 2032
- Table 26: Saudi Arabia Aircraft Synthetic Vision Systems Market Revenue (Million) Forecast, by Application 2019 & 2032
- Table 27: Egypt Aircraft Synthetic Vision Systems Market Revenue (Million) Forecast, by Application 2019 & 2032
- Table 28: Rest of Middle East and Africa Aircraft Synthetic Vision Systems Market Revenue (Million) Forecast, by Application 2019 & 2032
- Table 29: Global Aircraft Synthetic Vision Systems Market Revenue Million Forecast, by Type 2019 & 2032
- Table 30: Global Aircraft Synthetic Vision Systems Market Revenue Million Forecast, by End User 2019 & 2032
- Table 31: Global Aircraft Synthetic Vision Systems Market Revenue Million Forecast, by Country 2019 & 2032
- Table 32: United States Aircraft Synthetic Vision Systems Market Revenue (Million) Forecast, by Application 2019 & 2032
- Table 33: Canada Aircraft Synthetic Vision Systems Market Revenue (Million) Forecast, by Application 2019 & 2032
- Table 34: Global Aircraft Synthetic Vision Systems Market Revenue Million Forecast, by Type 2019 & 2032
- Table 35: Global Aircraft Synthetic Vision Systems Market Revenue Million Forecast, by End User 2019 & 2032
- Table 36: Global Aircraft Synthetic Vision Systems Market Revenue Million Forecast, by Country 2019 & 2032
- Table 37: Germany Aircraft Synthetic Vision Systems Market Revenue (Million) Forecast, by Application 2019 & 2032
- Table 38: United Kingdom Aircraft Synthetic Vision Systems Market Revenue (Million) Forecast, by Application 2019 & 2032
- Table 39: France Aircraft Synthetic Vision Systems Market Revenue (Million) Forecast, by Application 2019 & 2032
- Table 40: Russia Aircraft Synthetic Vision Systems Market Revenue (Million) Forecast, by Application 2019 & 2032
- Table 41: Rest of Europe Aircraft Synthetic Vision Systems Market Revenue (Million) Forecast, by Application 2019 & 2032
- Table 42: Global Aircraft Synthetic Vision Systems Market Revenue Million Forecast, by Type 2019 & 2032
- Table 43: Global Aircraft Synthetic Vision Systems Market Revenue Million Forecast, by End User 2019 & 2032
- Table 44: Global Aircraft Synthetic Vision Systems Market Revenue Million Forecast, by Country 2019 & 2032
- Table 45: China Aircraft Synthetic Vision Systems Market Revenue (Million) Forecast, by Application 2019 & 2032
- Table 46: Japan Aircraft Synthetic Vision Systems Market Revenue (Million) Forecast, by Application 2019 & 2032
- Table 47: India Aircraft Synthetic Vision Systems Market Revenue (Million) Forecast, by Application 2019 & 2032
- Table 48: South Korea Aircraft Synthetic Vision Systems Market Revenue (Million) Forecast, by Application 2019 & 2032
- Table 49: Rest of Asia Pacific Aircraft Synthetic Vision Systems Market Revenue (Million) Forecast, by Application 2019 & 2032
- Table 50: Global Aircraft Synthetic Vision Systems Market Revenue Million Forecast, by Type 2019 & 2032
- Table 51: Global Aircraft Synthetic Vision Systems Market Revenue Million Forecast, by End User 2019 & 2032
- Table 52: Global Aircraft Synthetic Vision Systems Market Revenue Million Forecast, by Country 2019 & 2032
- Table 53: Brazil Aircraft Synthetic Vision Systems Market Revenue (Million) Forecast, by Application 2019 & 2032
- Table 54: Mexico Aircraft Synthetic Vision Systems Market Revenue (Million) Forecast, by Application 2019 & 2032
- Table 55: Rest of Latin America Aircraft Synthetic Vision Systems Market Revenue (Million) Forecast, by Application 2019 & 2032
- Table 56: Global Aircraft Synthetic Vision Systems Market Revenue Million Forecast, by Type 2019 & 2032
- Table 57: Global Aircraft Synthetic Vision Systems Market Revenue Million Forecast, by End User 2019 & 2032
- Table 58: Global Aircraft Synthetic Vision Systems Market Revenue Million Forecast, by Country 2019 & 2032
- Table 59: United Arab Emirates Aircraft Synthetic Vision Systems Market Revenue (Million) Forecast, by Application 2019 & 2032
- Table 60: Saudi Arabia Aircraft Synthetic Vision Systems Market Revenue (Million) Forecast, by Application 2019 & 2032
- Table 61: Egypt Aircraft Synthetic Vision Systems Market Revenue (Million) Forecast, by Application 2019 & 2032
- Table 62: Rest of Middle East and Africa Aircraft Synthetic Vision Systems Market Revenue (Million) Forecast, by Application 2019 & 2032
Frequently Asked Questions
1. What is the projected Compound Annual Growth Rate (CAGR) of the Aircraft Synthetic Vision Systems Market?
The projected CAGR is approximately > 2.80%.
2. Which companies are prominent players in the Aircraft Synthetic Vision Systems Market?
Key companies in the market include L3Harris Technologies Inc, Honeywell International Inc, Avidyne Corporation, Elbit Systems Ltd, Mercury Systems Inc, Garmin Ltd, Cobham Limited, Safran SA, Thales Group, ENSCO Inc, Aspen Avionics Inc, Collins Aerospace (Raytheon Technologies Corporation).
3. What are the main segments of the Aircraft Synthetic Vision Systems Market?
The market segments include Type, End User.
4. Can you provide details about the market size?
The market size is estimated to be USD XX Million as of 2022.
5. What are some drivers contributing to market growth?
N/A
6. What are the notable trends driving market growth?
Military End-user to Witness Higher Growth During the Forecast Period.
7. Are there any restraints impacting market growth?
N/A
8. Can you provide examples of recent developments in the market?
In October 2022, Collins Aerospace achieved a technical standard order (TSO) for its combined vision system (CVS) for business aviation aircraft. The CVS provides clarity to pilots in all types of weather to confidently and securely navigate aircraft through low visibility situations.
9. What pricing options are available for accessing the report?
Pricing options include single-user, multi-user, and enterprise licenses priced at USD 4750, USD 5250, and USD 8750 respectively.
10. Is the market size provided in terms of value or volume?
The market size is provided in terms of value, measured in Million.
11. Are there any specific market keywords associated with the report?
Yes, the market keyword associated with the report is "Aircraft Synthetic Vision Systems Market," which aids in identifying and referencing the specific market segment covered.
12. How do I determine which pricing option suits my needs best?
The pricing options vary based on user requirements and access needs. Individual users may opt for single-user licenses, while businesses requiring broader access may choose multi-user or enterprise licenses for cost-effective access to the report.
13. Are there any additional resources or data provided in the Aircraft Synthetic Vision Systems Market report?
While the report offers comprehensive insights, it's advisable to review the specific contents or supplementary materials provided to ascertain if additional resources or data are available.
14. How can I stay updated on further developments or reports in the Aircraft Synthetic Vision Systems Market?
To stay informed about further developments, trends, and reports in the Aircraft Synthetic Vision Systems Market, consider subscribing to industry newsletters, following relevant companies and organizations, or regularly checking reputable industry news sources and publications.
Methodology
Step 1 - Identification of Relevant Samples Size from Population Database


Step 2 - Approaches for Defining Global Market Size (Value, Volume* & Price*)

Note*: In applicable scenarios
Step 3 - Data Sources
Primary Research
- Web Analytics
- Survey Reports
- Research Institute
- Latest Research Reports
- Opinion Leaders
Secondary Research
- Annual Reports
- White Paper
- Latest Press Release
- Industry Association
- Paid Database
- Investor Presentations

Step 4 - Data Triangulation
Involves using different sources of information in order to increase the validity of a study
These sources are likely to be stakeholders in a program - participants, other researchers, program staff, other community members, and so on.
Then we put all data in single framework & apply various statistical tools to find out the dynamic on the market.
During the analysis stage, feedback from the stakeholder groups would be compared to determine areas of agreement as well as areas of divergence
