

Key Insights
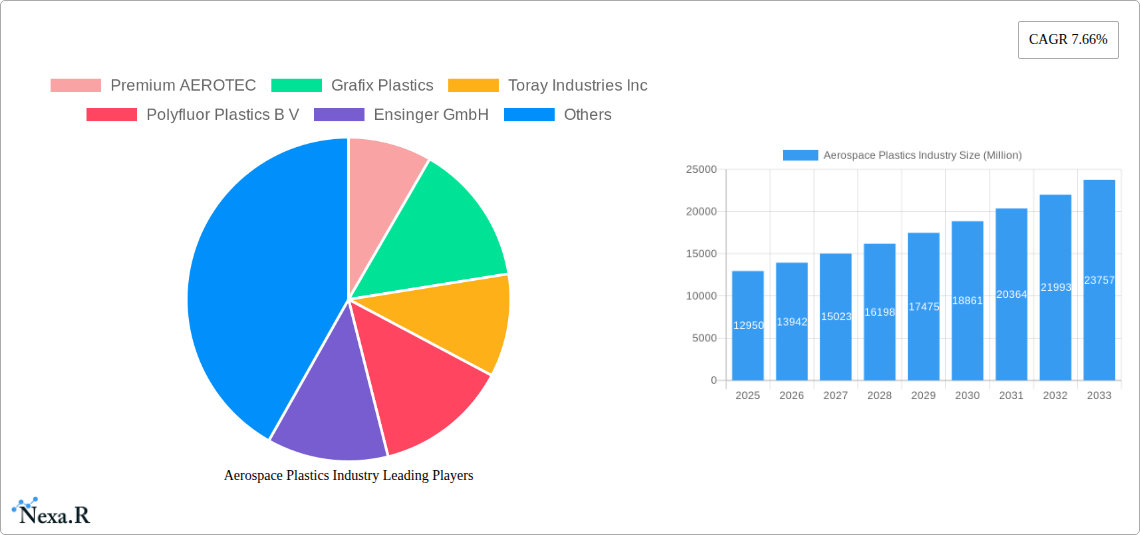
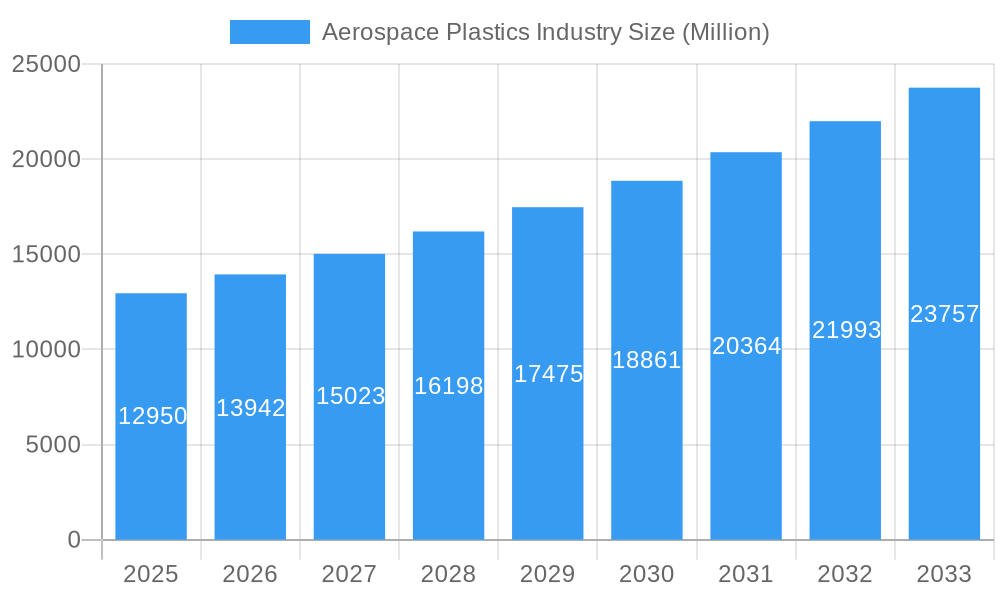
The aerospace plastics market, valued at $12.95 billion in 2025, is poised for robust growth, exhibiting a compound annual growth rate (CAGR) of 7.66% from 2025 to 2033. This expansion is driven by several key factors. The increasing demand for lightweight yet high-strength materials in aircraft and spacecraft construction is a primary catalyst. Plastics offer significant advantages over traditional metals in terms of weight reduction, leading to improved fuel efficiency and reduced emissions – crucial considerations in the context of environmental sustainability and operational costs. Furthermore, advancements in polymer technology are enabling the development of plastics with enhanced thermal resistance, impact strength, and chemical resistance, making them suitable for increasingly demanding aerospace applications. The growing adoption of advanced composites incorporating plastics, particularly in aerostructures, cabin interiors, and propulsion systems, further fuels market growth. The burgeoning space exploration sector also contributes significantly, with plastics finding increasing use in satellite components and launch vehicles. However, the market faces certain restraints, including the stringent regulatory compliance requirements within the aerospace industry and potential concerns about the long-term durability and recyclability of certain plastic materials.
Aerospace Plastics Industry Market Size (In Billion)
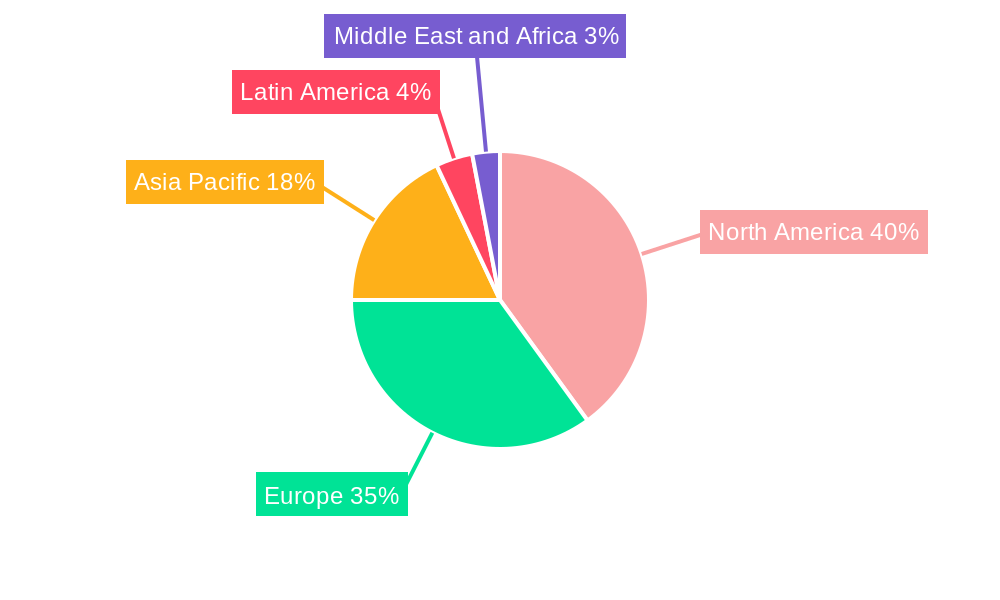
Regional market dynamics vary, with North America and Europe currently holding significant shares. However, the Asia-Pacific region is projected to witness substantial growth driven by increasing aerospace manufacturing activities and rising disposable incomes in key economies like China and India. The competitive landscape is characterized by a mix of established players and emerging companies, encompassing material suppliers, component manufacturers, and system integrators. These companies are focusing on innovation, strategic partnerships, and acquisitions to expand their market presence and capitalize on emerging opportunities presented by technological advancements and industry trends. The continued focus on lightweighting, sustainable materials, and improved performance characteristics will continue to shape the future of the aerospace plastics market. Market segmentation, with strong growth across aerostructures, cabin interiors, and propulsion systems, is an indicator of diverse application possibilities.
Aerospace Plastics Industry Company Market Share
Aerospace Plastics Industry Market Report: 2019-2033
This comprehensive report provides an in-depth analysis of the Aerospace Plastics market, encompassing market dynamics, growth trends, regional analysis, product landscape, key players, and future outlook. The study period covers 2019-2033, with a base year of 2025 and a forecast period of 2025-2033. The report focuses on key segments including General Aviation and Space, with applications spanning Aerostructure, Cabin Interiors, Propulsion Systems, and Satellites, catering to the Aviation end-user. Market values are presented in million units.
Aerospace Plastics Industry Market Dynamics & Structure
The aerospace plastics market is characterized by moderate concentration, with several key players holding significant market share. Technological innovation, particularly in high-performance polymers and composites, is a primary growth driver. Stringent regulatory frameworks concerning safety and environmental impact influence material selection and manufacturing processes. Competitive substitutes include traditional metallic materials, but the lightweight nature and design flexibility of plastics are driving adoption. End-user demographics are shifting towards increased demand for fuel-efficient aircraft, further bolstering market growth. The M&A landscape is active, with strategic acquisitions aiming to expand product portfolios and geographic reach.
- Market Concentration: Moderately concentrated, with top 5 players holding xx% market share in 2025.
- Technological Innovation: Focus on lightweight, high-strength materials like carbon fiber reinforced plastics (CFRP) and thermoplastic composites.
- Regulatory Framework: Stringent safety and environmental regulations impacting material selection and manufacturing.
- Competitive Substitutes: Metals (aluminum, titanium) are primary competitors; plastics offer advantages in weight and design flexibility.
- M&A Activity: Significant M&A activity observed in the historical period, with xx deals recorded between 2019 and 2024. This is expected to continue during the forecast period.
- Innovation Barriers: High R&D costs, lengthy certification processes, and material limitations hinder innovation.
Aerospace Plastics Industry Growth Trends & Insights
The aerospace plastics market experienced robust growth during the historical period (2019-2024), driven by increasing demand for fuel-efficient aircraft and the integration of advanced materials in aerospace designs. The market size is expected to reach xx million units in 2025 and continue to expand at a CAGR of xx% during the forecast period (2025-2033). This growth is fueled by technological advancements in high-performance polymers, increased adoption of lightweight materials in aerostructures and cabin interiors, and rising investments in space exploration. Consumer demand for improved passenger experience and enhanced safety features also contributes to this growth. Disruptive technologies, such as additive manufacturing (3D printing) and bio-based plastics, are expected to gain traction over the next decade, further shaping market dynamics.
Dominant Regions, Countries, or Segments in Aerospace Plastics Industry
North America and Europe currently dominate the aerospace plastics market, driven by a robust aerospace manufacturing base, strong R&D investments, and early adoption of advanced materials. Within these regions, the Aerostructure segment shows significant growth potential, owing to the increasing demand for lightweight yet high-strength aircraft components. The Space segment is also exhibiting strong growth momentum, fueled by expanding space exploration initiatives and satellite deployments. Asia-Pacific is projected to experience substantial growth during the forecast period, driven by increasing aircraft manufacturing activities and government support for aerospace technology development.
- Key Drivers:
- North America: Strong aerospace manufacturing sector, robust R&D investments, high technological advancement.
- Europe: Large established aerospace industry, significant government funding for innovation.
- Asia-Pacific: Rapid growth of the aviation industry, increasing government support.
- Dominance Factors:
- Established aerospace manufacturing infrastructure.
- High R&D investment and technological innovation.
- Government support and favorable economic policies.
- Growth Potential:
- Asia-Pacific region is projected to exhibit the highest growth rate due to increasing demand and investments.
- Space segment has high growth potential due to increased space exploration initiatives.
Aerospace Plastics Industry Product Landscape
The aerospace plastics industry offers a wide range of products, including high-performance thermoplastics (e.g., PEEK, PEI), thermosets (e.g., epoxy resins), and advanced composites (e.g., CFRP). These materials are tailored to meet specific application requirements, such as high temperature resistance, impact strength, and lightweight properties. Continuous innovation focuses on improving mechanical properties, reducing weight, and enhancing fire resistance. Unique selling propositions include superior strength-to-weight ratio, design flexibility, and cost-effectiveness in certain applications compared to traditional materials.
Key Drivers, Barriers & Challenges in Aerospace Plastics Industry
Key Drivers:
- Lightweighting: Demand for fuel efficiency and reduced emissions drives the adoption of lightweight plastics.
- Design Flexibility: Complex shapes and designs are easily achieved with plastics compared to traditional materials.
- Technological Advancements: Development of high-performance materials and advanced manufacturing techniques.
Key Challenges:
- High Certification Costs: Stringent safety regulations necessitate expensive and time-consuming testing and certification processes.
- Supply Chain Disruptions: Geopolitical factors and material scarcity can lead to supply chain vulnerabilities.
- Competition from Traditional Materials: Metals maintain a significant presence in certain aerospace applications.
Emerging Opportunities in Aerospace Plastics Industry
- Bio-based Plastics: Growing interest in sustainable aviation fuels and eco-friendly materials.
- Additive Manufacturing: 3D printing enables customized designs and on-demand production.
- Smart Materials: Integration of sensors and electronics into plastic components for improved monitoring and control.
- Space Applications: Expanding demand for lightweight, radiation-resistant materials in satellites and spacecraft.
Growth Accelerators in the Aerospace Plastics Industry
Technological breakthroughs in high-performance polymers, coupled with strategic partnerships between material suppliers and aircraft manufacturers, are key growth drivers. Expanding applications into emerging markets, such as unmanned aerial vehicles (UAVs) and electric aircraft, present significant opportunities for market expansion. Government initiatives aimed at promoting sustainable aviation further accelerate industry growth.
Key Players Shaping the Aerospace Plastics Industry Market
- Premium AEROTEC
- Grafix Plastics
- Toray Industries Inc
- Polyfluor Plastics B V
- Ensinger GmbH
- Curbell Plastics Inc
- Big Bear Plastic Products Limited
- Zeus Industrial Products Inc
- Paco Plastics Inc
- Loar Group Inc
- 3P Performance Plastics Products
Notable Milestones in Aerospace Plastics Industry Sector
- January 2023: Toray Industries, Inc. announced a USD 780 million investment to increase carbon fiber production capacity by 2025. This significant investment underscores the growing demand for lightweight materials in the aerospace industry.
- October 2023: Demgy Group acquired E.I.S. Aircraft GmbH, strengthening its position in high-value-added plastics processing for aeronautics. This acquisition highlights the ongoing consolidation within the industry.
In-Depth Aerospace Plastics Industry Market Outlook
The aerospace plastics market is poised for significant growth in the coming years, driven by continuous innovation in materials science and manufacturing processes. Strategic partnerships, increased investments in R&D, and expansion into new applications will further shape the market landscape. The focus on sustainability and lightweighting will continue to drive demand for advanced plastic materials in the aerospace sector, presenting lucrative opportunities for players across the value chain.
Aerospace Plastics Industry Segmentation
- 1. Production Analysis
- 2. Consumption Analysis
- 3. Import Market Analysis (Value & Volume)
- 4. Export Market Analysis (Value & Volume)
- 5. Price Trend Analysis
Aerospace Plastics Industry Segmentation By Geography
-
1. North America
- 1.1. United States
- 1.2. Canada
- 1.3. Mexico
-
2. South America
- 2.1. Brazil
- 2.2. Argentina
- 2.3. Rest of South America
-
3. Europe
- 3.1. United Kingdom
- 3.2. Germany
- 3.3. France
- 3.4. Italy
- 3.5. Spain
- 3.6. Russia
- 3.7. Benelux
- 3.8. Nordics
- 3.9. Rest of Europe
-
4. Middle East & Africa
- 4.1. Turkey
- 4.2. Israel
- 4.3. GCC
- 4.4. North Africa
- 4.5. South Africa
- 4.6. Rest of Middle East & Africa
-
5. Asia Pacific
- 5.1. China
- 5.2. India
- 5.3. Japan
- 5.4. South Korea
- 5.5. ASEAN
- 5.6. Oceania
- 5.7. Rest of Asia Pacific
Aerospace Plastics Industry Regional Market Share
Geographic Coverage of Aerospace Plastics Industry
Aerospace Plastics Industry REPORT HIGHLIGHTS
| Aspects | Details |
|---|---|
| Study Period | 2020-2034 |
| Base Year | 2025 |
| Estimated Year | 2026 |
| Forecast Period | 2026-2034 |
| Historical Period | 2020-2025 |
| Growth Rate | CAGR of 7.66% from 2020-2034 |
| Segmentation |
|
Table of Contents
- 1. Introduction
- 1.1. Research Scope
- 1.2. Market Segmentation
- 1.3. Research Objective
- 1.4. Definitions and Assumptions
- 2. Executive Summary
- 2.1. Market Snapshot
- 3. Market Dynamics
- 3.1. Market Drivers
- 3.2. Market Restrains
- 3.3. Market Trends
- 3.4. Market Opportunities
- 4. Market Factor Analysis
- 4.1. Porters Five Forces
- 4.1.1. Bargaining Power of Suppliers
- 4.1.2. Bargaining Power of Buyers
- 4.1.3. Threat of New Entrants
- 4.1.4. Threat of Substitutes
- 4.1.5. Competitive Rivalry
- 4.2. PESTEL analysis
- 4.3. BCG Analysis
- 4.3.1. Stars (High Growth, High Market Share)
- 4.3.2. Cash Cows (Low Growth, High Market Share)
- 4.3.3. Question Mark (High Growth, Low Market Share)
- 4.3.4. Dogs (Low Growth, Low Market Share)
- 4.4. Ansoff Matrix Analysis
- 4.5. Supply Chain Analysis
- 4.6. Regulatory Landscape
- 4.7. Current Market Potential and Opportunity Assessment (TAM–SAM–SOM Framework)
- 4.8. NRP Analyst Note
- 4.1. Porters Five Forces
- 5. Market Analysis, Insights and Forecast 2021-2033
- 5.1. Market Analysis, Insights and Forecast - by Production Analysis
- 5.2. Market Analysis, Insights and Forecast - by Consumption Analysis
- 5.3. Market Analysis, Insights and Forecast - by Import Market Analysis (Value & Volume)
- 5.4. Market Analysis, Insights and Forecast - by Export Market Analysis (Value & Volume)
- 5.5. Market Analysis, Insights and Forecast - by Price Trend Analysis
- 5.6. Market Analysis, Insights and Forecast - by Region
- 5.6.1. North America
- 5.6.2. South America
- 5.6.3. Europe
- 5.6.4. Middle East & Africa
- 5.6.5. Asia Pacific
- 6. Global Aerospace Plastics Industry Analysis, Insights and Forecast, 2021-2033
- 6.1. Market Analysis, Insights and Forecast - by Production Analysis
- 6.2. Market Analysis, Insights and Forecast - by Consumption Analysis
- 6.3. Market Analysis, Insights and Forecast - by Import Market Analysis (Value & Volume)
- 6.4. Market Analysis, Insights and Forecast - by Export Market Analysis (Value & Volume)
- 6.5. Market Analysis, Insights and Forecast - by Price Trend Analysis
- 7. North America Aerospace Plastics Industry Analysis, Insights and Forecast, 2020-2032
- 7.1. Market Analysis, Insights and Forecast - by Production Analysis
- 7.2. Market Analysis, Insights and Forecast - by Consumption Analysis
- 7.3. Market Analysis, Insights and Forecast - by Import Market Analysis (Value & Volume)
- 7.4. Market Analysis, Insights and Forecast - by Export Market Analysis (Value & Volume)
- 7.5. Market Analysis, Insights and Forecast - by Price Trend Analysis
- 8. South America Aerospace Plastics Industry Analysis, Insights and Forecast, 2020-2032
- 8.1. Market Analysis, Insights and Forecast - by Production Analysis
- 8.2. Market Analysis, Insights and Forecast - by Consumption Analysis
- 8.3. Market Analysis, Insights and Forecast - by Import Market Analysis (Value & Volume)
- 8.4. Market Analysis, Insights and Forecast - by Export Market Analysis (Value & Volume)
- 8.5. Market Analysis, Insights and Forecast - by Price Trend Analysis
- 9. Europe Aerospace Plastics Industry Analysis, Insights and Forecast, 2020-2032
- 9.1. Market Analysis, Insights and Forecast - by Production Analysis
- 9.2. Market Analysis, Insights and Forecast - by Consumption Analysis
- 9.3. Market Analysis, Insights and Forecast - by Import Market Analysis (Value & Volume)
- 9.4. Market Analysis, Insights and Forecast - by Export Market Analysis (Value & Volume)
- 9.5. Market Analysis, Insights and Forecast - by Price Trend Analysis
- 10. Middle East & Africa Aerospace Plastics Industry Analysis, Insights and Forecast, 2020-2032
- 10.1. Market Analysis, Insights and Forecast - by Production Analysis
- 10.2. Market Analysis, Insights and Forecast - by Consumption Analysis
- 10.3. Market Analysis, Insights and Forecast - by Import Market Analysis (Value & Volume)
- 10.4. Market Analysis, Insights and Forecast - by Export Market Analysis (Value & Volume)
- 10.5. Market Analysis, Insights and Forecast - by Price Trend Analysis
- 11. Asia Pacific Aerospace Plastics Industry Analysis, Insights and Forecast, 2020-2032
- 11.1. Market Analysis, Insights and Forecast - by Production Analysis
- 11.2. Market Analysis, Insights and Forecast - by Consumption Analysis
- 11.3. Market Analysis, Insights and Forecast - by Import Market Analysis (Value & Volume)
- 11.4. Market Analysis, Insights and Forecast - by Export Market Analysis (Value & Volume)
- 11.5. Market Analysis, Insights and Forecast - by Price Trend Analysis
- 12. Competitive Analysis
- 12.1. Company Profiles
- 12.1.1 Premium AEROTEC
- 12.1.1.1. Company Overview
- 12.1.1.2. Products
- 12.1.1.3. Company Financials
- 12.1.1.4. SWOT Analysis
- 12.1.2 Grafix Plastics
- 12.1.2.1. Company Overview
- 12.1.2.2. Products
- 12.1.2.3. Company Financials
- 12.1.2.4. SWOT Analysis
- 12.1.3 Toray Industries Inc
- 12.1.3.1. Company Overview
- 12.1.3.2. Products
- 12.1.3.3. Company Financials
- 12.1.3.4. SWOT Analysis
- 12.1.4 Polyfluor Plastics B V
- 12.1.4.1. Company Overview
- 12.1.4.2. Products
- 12.1.4.3. Company Financials
- 12.1.4.4. SWOT Analysis
- 12.1.5 Ensinger GmbH
- 12.1.5.1. Company Overview
- 12.1.5.2. Products
- 12.1.5.3. Company Financials
- 12.1.5.4. SWOT Analysis
- 12.1.6 Curbell Plastics Inc
- 12.1.6.1. Company Overview
- 12.1.6.2. Products
- 12.1.6.3. Company Financials
- 12.1.6.4. SWOT Analysis
- 12.1.7 Big Bear Plastic Products Limited
- 12.1.7.1. Company Overview
- 12.1.7.2. Products
- 12.1.7.3. Company Financials
- 12.1.7.4. SWOT Analysis
- 12.1.8 Zeus Industrial Products Inc
- 12.1.8.1. Company Overview
- 12.1.8.2. Products
- 12.1.8.3. Company Financials
- 12.1.8.4. SWOT Analysis
- 12.1.9 Paco Plastics Inc
- 12.1.9.1. Company Overview
- 12.1.9.2. Products
- 12.1.9.3. Company Financials
- 12.1.9.4. SWOT Analysis
- 12.1.10 Loar Group Inc
- 12.1.10.1. Company Overview
- 12.1.10.2. Products
- 12.1.10.3. Company Financials
- 12.1.10.4. SWOT Analysis
- 12.1.11 3P Performance Plastics Products
- 12.1.11.1. Company Overview
- 12.1.11.2. Products
- 12.1.11.3. Company Financials
- 12.1.11.4. SWOT Analysis
- 12.1.1 Premium AEROTEC
- 12.2. Market Entropy
- 12.2.1 Company's Key Areas Served
- 12.2.2 Recent Developments
- 12.3. Company Market Share Analysis 2025
- 12.3.1 Top 5 Companies Market Share Analysis
- 12.3.2 Top 3 Companies Market Share Analysis
- 12.4. List of Potential Customers
- 13. Research Methodology
List of Figures
- Figure 1: Global Aerospace Plastics Industry Revenue Breakdown (Million, %) by Region 2025 & 2033
- Figure 2: North America Aerospace Plastics Industry Revenue (Million), by Production Analysis 2025 & 2033
- Figure 3: North America Aerospace Plastics Industry Revenue Share (%), by Production Analysis 2025 & 2033
- Figure 4: North America Aerospace Plastics Industry Revenue (Million), by Consumption Analysis 2025 & 2033
- Figure 5: North America Aerospace Plastics Industry Revenue Share (%), by Consumption Analysis 2025 & 2033
- Figure 6: North America Aerospace Plastics Industry Revenue (Million), by Import Market Analysis (Value & Volume) 2025 & 2033
- Figure 7: North America Aerospace Plastics Industry Revenue Share (%), by Import Market Analysis (Value & Volume) 2025 & 2033
- Figure 8: North America Aerospace Plastics Industry Revenue (Million), by Export Market Analysis (Value & Volume) 2025 & 2033
- Figure 9: North America Aerospace Plastics Industry Revenue Share (%), by Export Market Analysis (Value & Volume) 2025 & 2033
- Figure 10: North America Aerospace Plastics Industry Revenue (Million), by Price Trend Analysis 2025 & 2033
- Figure 11: North America Aerospace Plastics Industry Revenue Share (%), by Price Trend Analysis 2025 & 2033
- Figure 12: North America Aerospace Plastics Industry Revenue (Million), by Country 2025 & 2033
- Figure 13: North America Aerospace Plastics Industry Revenue Share (%), by Country 2025 & 2033
- Figure 14: South America Aerospace Plastics Industry Revenue (Million), by Production Analysis 2025 & 2033
- Figure 15: South America Aerospace Plastics Industry Revenue Share (%), by Production Analysis 2025 & 2033
- Figure 16: South America Aerospace Plastics Industry Revenue (Million), by Consumption Analysis 2025 & 2033
- Figure 17: South America Aerospace Plastics Industry Revenue Share (%), by Consumption Analysis 2025 & 2033
- Figure 18: South America Aerospace Plastics Industry Revenue (Million), by Import Market Analysis (Value & Volume) 2025 & 2033
- Figure 19: South America Aerospace Plastics Industry Revenue Share (%), by Import Market Analysis (Value & Volume) 2025 & 2033
- Figure 20: South America Aerospace Plastics Industry Revenue (Million), by Export Market Analysis (Value & Volume) 2025 & 2033
- Figure 21: South America Aerospace Plastics Industry Revenue Share (%), by Export Market Analysis (Value & Volume) 2025 & 2033
- Figure 22: South America Aerospace Plastics Industry Revenue (Million), by Price Trend Analysis 2025 & 2033
- Figure 23: South America Aerospace Plastics Industry Revenue Share (%), by Price Trend Analysis 2025 & 2033
- Figure 24: South America Aerospace Plastics Industry Revenue (Million), by Country 2025 & 2033
- Figure 25: South America Aerospace Plastics Industry Revenue Share (%), by Country 2025 & 2033
- Figure 26: Europe Aerospace Plastics Industry Revenue (Million), by Production Analysis 2025 & 2033
- Figure 27: Europe Aerospace Plastics Industry Revenue Share (%), by Production Analysis 2025 & 2033
- Figure 28: Europe Aerospace Plastics Industry Revenue (Million), by Consumption Analysis 2025 & 2033
- Figure 29: Europe Aerospace Plastics Industry Revenue Share (%), by Consumption Analysis 2025 & 2033
- Figure 30: Europe Aerospace Plastics Industry Revenue (Million), by Import Market Analysis (Value & Volume) 2025 & 2033
- Figure 31: Europe Aerospace Plastics Industry Revenue Share (%), by Import Market Analysis (Value & Volume) 2025 & 2033
- Figure 32: Europe Aerospace Plastics Industry Revenue (Million), by Export Market Analysis (Value & Volume) 2025 & 2033
- Figure 33: Europe Aerospace Plastics Industry Revenue Share (%), by Export Market Analysis (Value & Volume) 2025 & 2033
- Figure 34: Europe Aerospace Plastics Industry Revenue (Million), by Price Trend Analysis 2025 & 2033
- Figure 35: Europe Aerospace Plastics Industry Revenue Share (%), by Price Trend Analysis 2025 & 2033
- Figure 36: Europe Aerospace Plastics Industry Revenue (Million), by Country 2025 & 2033
- Figure 37: Europe Aerospace Plastics Industry Revenue Share (%), by Country 2025 & 2033
- Figure 38: Middle East & Africa Aerospace Plastics Industry Revenue (Million), by Production Analysis 2025 & 2033
- Figure 39: Middle East & Africa Aerospace Plastics Industry Revenue Share (%), by Production Analysis 2025 & 2033
- Figure 40: Middle East & Africa Aerospace Plastics Industry Revenue (Million), by Consumption Analysis 2025 & 2033
- Figure 41: Middle East & Africa Aerospace Plastics Industry Revenue Share (%), by Consumption Analysis 2025 & 2033
- Figure 42: Middle East & Africa Aerospace Plastics Industry Revenue (Million), by Import Market Analysis (Value & Volume) 2025 & 2033
- Figure 43: Middle East & Africa Aerospace Plastics Industry Revenue Share (%), by Import Market Analysis (Value & Volume) 2025 & 2033
- Figure 44: Middle East & Africa Aerospace Plastics Industry Revenue (Million), by Export Market Analysis (Value & Volume) 2025 & 2033
- Figure 45: Middle East & Africa Aerospace Plastics Industry Revenue Share (%), by Export Market Analysis (Value & Volume) 2025 & 2033
- Figure 46: Middle East & Africa Aerospace Plastics Industry Revenue (Million), by Price Trend Analysis 2025 & 2033
- Figure 47: Middle East & Africa Aerospace Plastics Industry Revenue Share (%), by Price Trend Analysis 2025 & 2033
- Figure 48: Middle East & Africa Aerospace Plastics Industry Revenue (Million), by Country 2025 & 2033
- Figure 49: Middle East & Africa Aerospace Plastics Industry Revenue Share (%), by Country 2025 & 2033
- Figure 50: Asia Pacific Aerospace Plastics Industry Revenue (Million), by Production Analysis 2025 & 2033
- Figure 51: Asia Pacific Aerospace Plastics Industry Revenue Share (%), by Production Analysis 2025 & 2033
- Figure 52: Asia Pacific Aerospace Plastics Industry Revenue (Million), by Consumption Analysis 2025 & 2033
- Figure 53: Asia Pacific Aerospace Plastics Industry Revenue Share (%), by Consumption Analysis 2025 & 2033
- Figure 54: Asia Pacific Aerospace Plastics Industry Revenue (Million), by Import Market Analysis (Value & Volume) 2025 & 2033
- Figure 55: Asia Pacific Aerospace Plastics Industry Revenue Share (%), by Import Market Analysis (Value & Volume) 2025 & 2033
- Figure 56: Asia Pacific Aerospace Plastics Industry Revenue (Million), by Export Market Analysis (Value & Volume) 2025 & 2033
- Figure 57: Asia Pacific Aerospace Plastics Industry Revenue Share (%), by Export Market Analysis (Value & Volume) 2025 & 2033
- Figure 58: Asia Pacific Aerospace Plastics Industry Revenue (Million), by Price Trend Analysis 2025 & 2033
- Figure 59: Asia Pacific Aerospace Plastics Industry Revenue Share (%), by Price Trend Analysis 2025 & 2033
- Figure 60: Asia Pacific Aerospace Plastics Industry Revenue (Million), by Country 2025 & 2033
- Figure 61: Asia Pacific Aerospace Plastics Industry Revenue Share (%), by Country 2025 & 2033
List of Tables
- Table 1: Global Aerospace Plastics Industry Revenue Million Forecast, by Production Analysis 2020 & 2033
- Table 2: Global Aerospace Plastics Industry Revenue Million Forecast, by Consumption Analysis 2020 & 2033
- Table 3: Global Aerospace Plastics Industry Revenue Million Forecast, by Import Market Analysis (Value & Volume) 2020 & 2033
- Table 4: Global Aerospace Plastics Industry Revenue Million Forecast, by Export Market Analysis (Value & Volume) 2020 & 2033
- Table 5: Global Aerospace Plastics Industry Revenue Million Forecast, by Price Trend Analysis 2020 & 2033
- Table 6: Global Aerospace Plastics Industry Revenue Million Forecast, by Region 2020 & 2033
- Table 7: Global Aerospace Plastics Industry Revenue Million Forecast, by Production Analysis 2020 & 2033
- Table 8: Global Aerospace Plastics Industry Revenue Million Forecast, by Consumption Analysis 2020 & 2033
- Table 9: Global Aerospace Plastics Industry Revenue Million Forecast, by Import Market Analysis (Value & Volume) 2020 & 2033
- Table 10: Global Aerospace Plastics Industry Revenue Million Forecast, by Export Market Analysis (Value & Volume) 2020 & 2033
- Table 11: Global Aerospace Plastics Industry Revenue Million Forecast, by Price Trend Analysis 2020 & 2033
- Table 12: Global Aerospace Plastics Industry Revenue Million Forecast, by Country 2020 & 2033
- Table 13: United States Aerospace Plastics Industry Revenue (Million) Forecast, by Application 2020 & 2033
- Table 14: Canada Aerospace Plastics Industry Revenue (Million) Forecast, by Application 2020 & 2033
- Table 15: Mexico Aerospace Plastics Industry Revenue (Million) Forecast, by Application 2020 & 2033
- Table 16: Global Aerospace Plastics Industry Revenue Million Forecast, by Production Analysis 2020 & 2033
- Table 17: Global Aerospace Plastics Industry Revenue Million Forecast, by Consumption Analysis 2020 & 2033
- Table 18: Global Aerospace Plastics Industry Revenue Million Forecast, by Import Market Analysis (Value & Volume) 2020 & 2033
- Table 19: Global Aerospace Plastics Industry Revenue Million Forecast, by Export Market Analysis (Value & Volume) 2020 & 2033
- Table 20: Global Aerospace Plastics Industry Revenue Million Forecast, by Price Trend Analysis 2020 & 2033
- Table 21: Global Aerospace Plastics Industry Revenue Million Forecast, by Country 2020 & 2033
- Table 22: Brazil Aerospace Plastics Industry Revenue (Million) Forecast, by Application 2020 & 2033
- Table 23: Argentina Aerospace Plastics Industry Revenue (Million) Forecast, by Application 2020 & 2033
- Table 24: Rest of South America Aerospace Plastics Industry Revenue (Million) Forecast, by Application 2020 & 2033
- Table 25: Global Aerospace Plastics Industry Revenue Million Forecast, by Production Analysis 2020 & 2033
- Table 26: Global Aerospace Plastics Industry Revenue Million Forecast, by Consumption Analysis 2020 & 2033
- Table 27: Global Aerospace Plastics Industry Revenue Million Forecast, by Import Market Analysis (Value & Volume) 2020 & 2033
- Table 28: Global Aerospace Plastics Industry Revenue Million Forecast, by Export Market Analysis (Value & Volume) 2020 & 2033
- Table 29: Global Aerospace Plastics Industry Revenue Million Forecast, by Price Trend Analysis 2020 & 2033
- Table 30: Global Aerospace Plastics Industry Revenue Million Forecast, by Country 2020 & 2033
- Table 31: United Kingdom Aerospace Plastics Industry Revenue (Million) Forecast, by Application 2020 & 2033
- Table 32: Germany Aerospace Plastics Industry Revenue (Million) Forecast, by Application 2020 & 2033
- Table 33: France Aerospace Plastics Industry Revenue (Million) Forecast, by Application 2020 & 2033
- Table 34: Italy Aerospace Plastics Industry Revenue (Million) Forecast, by Application 2020 & 2033
- Table 35: Spain Aerospace Plastics Industry Revenue (Million) Forecast, by Application 2020 & 2033
- Table 36: Russia Aerospace Plastics Industry Revenue (Million) Forecast, by Application 2020 & 2033
- Table 37: Benelux Aerospace Plastics Industry Revenue (Million) Forecast, by Application 2020 & 2033
- Table 38: Nordics Aerospace Plastics Industry Revenue (Million) Forecast, by Application 2020 & 2033
- Table 39: Rest of Europe Aerospace Plastics Industry Revenue (Million) Forecast, by Application 2020 & 2033
- Table 40: Global Aerospace Plastics Industry Revenue Million Forecast, by Production Analysis 2020 & 2033
- Table 41: Global Aerospace Plastics Industry Revenue Million Forecast, by Consumption Analysis 2020 & 2033
- Table 42: Global Aerospace Plastics Industry Revenue Million Forecast, by Import Market Analysis (Value & Volume) 2020 & 2033
- Table 43: Global Aerospace Plastics Industry Revenue Million Forecast, by Export Market Analysis (Value & Volume) 2020 & 2033
- Table 44: Global Aerospace Plastics Industry Revenue Million Forecast, by Price Trend Analysis 2020 & 2033
- Table 45: Global Aerospace Plastics Industry Revenue Million Forecast, by Country 2020 & 2033
- Table 46: Turkey Aerospace Plastics Industry Revenue (Million) Forecast, by Application 2020 & 2033
- Table 47: Israel Aerospace Plastics Industry Revenue (Million) Forecast, by Application 2020 & 2033
- Table 48: GCC Aerospace Plastics Industry Revenue (Million) Forecast, by Application 2020 & 2033
- Table 49: North Africa Aerospace Plastics Industry Revenue (Million) Forecast, by Application 2020 & 2033
- Table 50: South Africa Aerospace Plastics Industry Revenue (Million) Forecast, by Application 2020 & 2033
- Table 51: Rest of Middle East & Africa Aerospace Plastics Industry Revenue (Million) Forecast, by Application 2020 & 2033
- Table 52: Global Aerospace Plastics Industry Revenue Million Forecast, by Production Analysis 2020 & 2033
- Table 53: Global Aerospace Plastics Industry Revenue Million Forecast, by Consumption Analysis 2020 & 2033
- Table 54: Global Aerospace Plastics Industry Revenue Million Forecast, by Import Market Analysis (Value & Volume) 2020 & 2033
- Table 55: Global Aerospace Plastics Industry Revenue Million Forecast, by Export Market Analysis (Value & Volume) 2020 & 2033
- Table 56: Global Aerospace Plastics Industry Revenue Million Forecast, by Price Trend Analysis 2020 & 2033
- Table 57: Global Aerospace Plastics Industry Revenue Million Forecast, by Country 2020 & 2033
- Table 58: China Aerospace Plastics Industry Revenue (Million) Forecast, by Application 2020 & 2033
- Table 59: India Aerospace Plastics Industry Revenue (Million) Forecast, by Application 2020 & 2033
- Table 60: Japan Aerospace Plastics Industry Revenue (Million) Forecast, by Application 2020 & 2033
- Table 61: South Korea Aerospace Plastics Industry Revenue (Million) Forecast, by Application 2020 & 2033
- Table 62: ASEAN Aerospace Plastics Industry Revenue (Million) Forecast, by Application 2020 & 2033
- Table 63: Oceania Aerospace Plastics Industry Revenue (Million) Forecast, by Application 2020 & 2033
- Table 64: Rest of Asia Pacific Aerospace Plastics Industry Revenue (Million) Forecast, by Application 2020 & 2033
Frequently Asked Questions
1. What is the projected Compound Annual Growth Rate (CAGR) of the Aerospace Plastics Industry?
The projected CAGR is approximately 7.66%.
2. Which companies are prominent players in the Aerospace Plastics Industry?
Key companies in the market include Premium AEROTEC, Grafix Plastics, Toray Industries Inc, Polyfluor Plastics B V, Ensinger GmbH, Curbell Plastics Inc, Big Bear Plastic Products Limited, Zeus Industrial Products Inc, Paco Plastics Inc, Loar Group Inc, 3P Performance Plastics Products.
3. What are the main segments of the Aerospace Plastics Industry?
The market segments include Production Analysis, Consumption Analysis, Import Market Analysis (Value & Volume), Export Market Analysis (Value & Volume), Price Trend Analysis.
4. Can you provide details about the market size?
The market size is estimated to be USD 12.95 Million as of 2022.
5. What are some drivers contributing to market growth?
; Increasing Number Of Air Passengers; Use Of Portable Electronic Devices.
6. What are the notable trends driving market growth?
Cabin Interiors to Witness Higher Growth During the Forecast Period.
7. Are there any restraints impacting market growth?
; High Cost Of Connectivity Equipments.
8. Can you provide examples of recent developments in the market?
In January 2023, Toray Industries, Inc. announced a USD 780 million investment towards increasing its production capacity for carbon fiber materials used in hydrogen fuel tanks and airplanes by 2025.
9. What pricing options are available for accessing the report?
Pricing options include single-user, multi-user, and enterprise licenses priced at USD 4750, USD 5250, and USD 8750 respectively.
10. Is the market size provided in terms of value or volume?
The market size is provided in terms of value, measured in Million.
11. Are there any specific market keywords associated with the report?
Yes, the market keyword associated with the report is "Aerospace Plastics Industry," which aids in identifying and referencing the specific market segment covered.
12. How do I determine which pricing option suits my needs best?
The pricing options vary based on user requirements and access needs. Individual users may opt for single-user licenses, while businesses requiring broader access may choose multi-user or enterprise licenses for cost-effective access to the report.
13. Are there any additional resources or data provided in the Aerospace Plastics Industry report?
While the report offers comprehensive insights, it's advisable to review the specific contents or supplementary materials provided to ascertain if additional resources or data are available.
14. How can I stay updated on further developments or reports in the Aerospace Plastics Industry?
To stay informed about further developments, trends, and reports in the Aerospace Plastics Industry, consider subscribing to industry newsletters, following relevant companies and organizations, or regularly checking reputable industry news sources and publications.
Methodology
Step 1 - Identification of Relevant Samples Size from Population Database


Step 2 - Approaches for Defining Global Market Size (Value, Volume* & Price*)

Note*: In applicable scenarios
Step 3 - Data Sources
Primary Research
- Web Analytics
- Survey Reports
- Research Institute
- Latest Research Reports
- Opinion Leaders
Secondary Research
- Annual Reports
- White Paper
- Latest Press Release
- Industry Association
- Paid Database
- Investor Presentations

Step 4 - Data Triangulation
Involves using different sources of information in order to increase the validity of a study
These sources are likely to be stakeholders in a program - participants, other researchers, program staff, other community members, and so on.
Then we put all data in single framework & apply various statistical tools to find out the dynamic on the market.
During the analysis stage, feedback from the stakeholder groups would be compared to determine areas of agreement as well as areas of divergence