

Key Insights
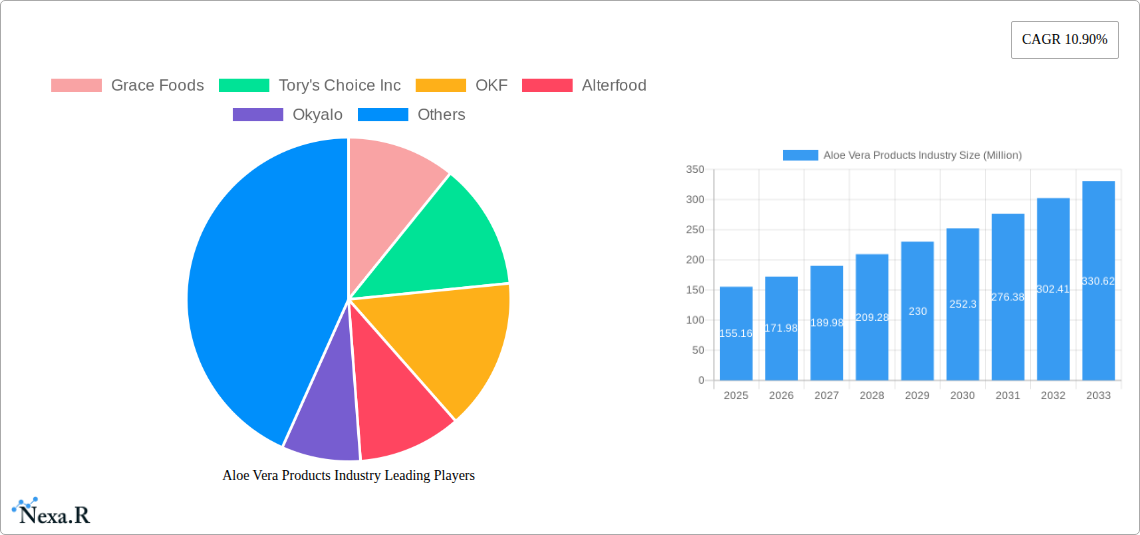
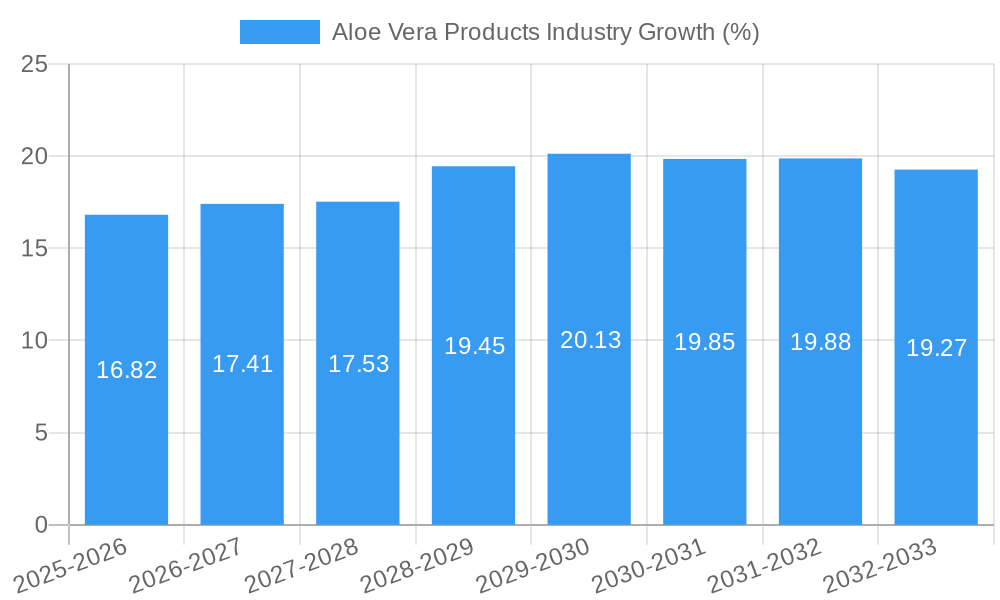
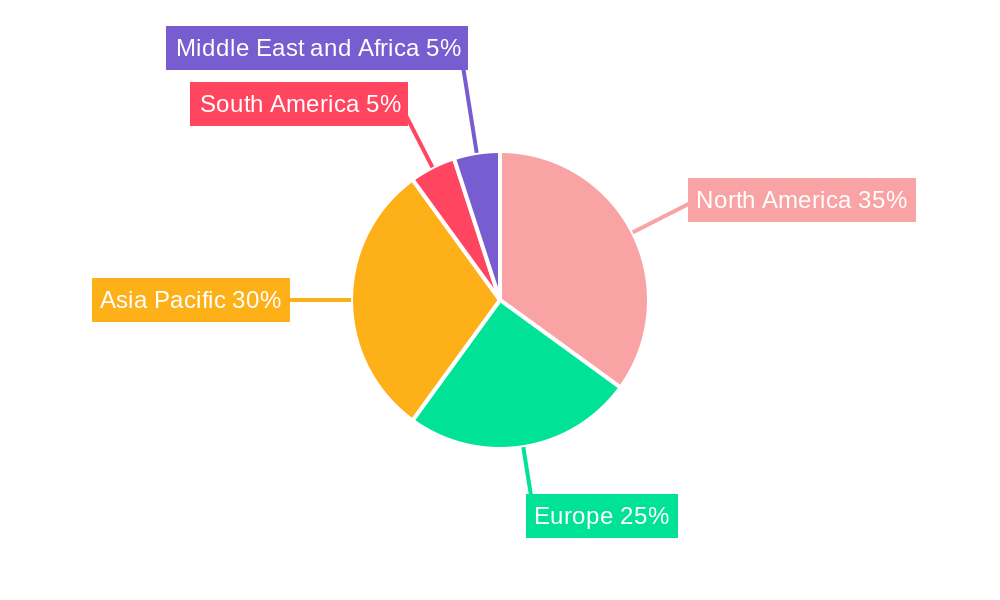
The global aloe vera products market is experiencing robust growth, projected to reach $155.16 million in 2025 and maintain a Compound Annual Growth Rate (CAGR) of 10.90% from 2025 to 2033. This expansion is driven by increasing consumer awareness of aloe vera's health benefits, particularly its soothing properties for skin and digestive health. The rising popularity of natural and organic products further fuels market demand, as aloe vera is a key ingredient in many cosmetics, beverages, and health supplements. Significant market segments include hot drinks, bottled drinks, and juice concentrates, with supermarkets and hypermarkets representing the leading distribution channel. However, the market faces some challenges, including potential fluctuations in raw material prices and the need for effective quality control to maintain product consistency and consumer trust. Furthermore, increasing competition from other natural ingredients and the development of synthetic alternatives present ongoing hurdles. The Asia-Pacific region, particularly China and India, is expected to demonstrate significant growth due to the region's large population and increasing disposable incomes. North America also presents a substantial market owing to established consumer preference for health and wellness products.
The market's future trajectory will depend significantly on product innovation and effective marketing strategies. Companies are focusing on developing new aloe vera-based products tailored to specific consumer needs, incorporating aloe vera into diverse product lines, and emphasizing the ingredient's unique health benefits. Strategic partnerships with retailers and expanding online distribution channels will be crucial to capturing a larger market share. Furthermore, addressing concerns around sustainability and ethical sourcing of aloe vera will be vital for maintaining consumer confidence and long-term market growth. The success of individual companies within this market will hinge on their ability to differentiate their products, effectively communicate their value proposition, and adapt to evolving consumer preferences.
Aloe Vera Products Industry: A Comprehensive Market Report (2019-2033)
This comprehensive report provides an in-depth analysis of the global Aloe Vera Products industry, encompassing market dynamics, growth trends, regional dominance, product landscape, key players, and future outlook. The study period covers 2019-2033, with 2025 as the base and estimated year. The report leverages extensive primary and secondary research to offer actionable insights for industry professionals, investors, and stakeholders. The total market size is predicted to reach xx Million by 2033.
Aloe Vera Products Industry Market Dynamics & Structure
The Aloe Vera Products industry is characterized by a moderately fragmented market structure, with several key players vying for market share. Market concentration is expected to increase slightly over the forecast period due to M&A activities and the expansion of larger multinational companies. Technological innovation, particularly in processing and packaging, plays a crucial role in enhancing product quality and shelf life. Stringent regulatory frameworks regarding food safety and labeling influence product formulation and marketing strategies. The Aloe Vera industry faces competition from other functional beverages and health supplements, presenting a constant challenge to maintain market share. End-user demographics are largely skewed towards health-conscious consumers, particularly millennials and Gen Z, with a growing interest in natural and organic products.
- Market Concentration: Moderately fragmented, with a xx% market share held by the top 5 players in 2024.
- Technological Innovation: Focus on improved extraction methods, extended shelf life technologies, and innovative packaging.
- Regulatory Framework: Stringent food safety regulations and labeling requirements across different geographies.
- Competitive Substitutes: Other functional beverages, health supplements, and skincare products.
- M&A Trends: A moderate increase in M&A activity is anticipated over the next decade, driven by expansion strategies and consolidation efforts. An estimated xx M&A deals occurred between 2019 and 2024.
Aloe Vera Products Industry Growth Trends & Insights
The global Aloe Vera Products market has witnessed substantial growth over the past few years, driven by increasing consumer awareness of health benefits, rising disposable incomes, and the expanding popularity of functional beverages. The market size is projected to register a CAGR of xx% during the forecast period (2025-2033), exceeding xx Million by 2033. Adoption rates are particularly high in developed countries, but significant growth potential exists in emerging economies due to rising purchasing power and changing lifestyle patterns. Technological disruptions, such as the use of advanced extraction techniques, are contributing to product quality improvements and cost reductions. Consumer behavior shifts are evident in the rising preference for natural, organic, and sustainably sourced Aloe Vera products.
Dominant Regions, Countries, or Segments in Aloe Vera Products Industry
The North American and European regions currently dominate the global Aloe Vera Products market, driven by high consumer awareness, established distribution networks, and strong regulatory frameworks. However, Asia-Pacific is poised for significant growth due to the burgeoning middle class, increasing disposable income, and rising demand for health and wellness products. Within the product type segment, Bottled drinks currently hold the largest market share, followed by Aloe Vera water and Juice Concentrates. Supermarkets/Hypermarkets and online retail stores are the leading distribution channels.
Key Drivers:
- North America & Europe: Strong consumer demand for functional beverages, extensive distribution networks, and established regulatory frameworks.
- Asia-Pacific: Rapid economic growth, rising disposable incomes, and increasing health consciousness.
- Bottled Drinks: Convenience, wide availability, and diverse flavor options.
- Supermarkets/Hypermarkets: Established infrastructure, wide reach, and established consumer shopping habits.
Aloe Vera Products Industry Product Landscape
The Aloe Vera product landscape is constantly evolving, with innovations focused on enhancing taste, texture, and functional benefits. New product formulations incorporate diverse flavors, added nutrients (vitamins, minerals), and unique blends with other ingredients. Technological advancements in extraction, processing, and packaging are improving product quality, shelf life, and sustainability. The focus on unique selling propositions, such as organic certification, fair trade sourcing, and health-focused marketing, drives consumer preference.
Key Drivers, Barriers & Challenges in Aloe Vera Products Industry
Key Drivers:
- Growing consumer demand for healthy and functional beverages.
- Increasing awareness of Aloe Vera's health benefits.
- Technological advancements in extraction and processing.
- Expansion of distribution channels.
Challenges:
- Fluctuations in Aloe Vera raw material prices.
- Intense competition from other functional beverages.
- Stringent regulatory compliance requirements.
- Ensuring product authenticity and quality.
Emerging Opportunities in Aloe Vera Products Industry
- Expansion into untapped markets in developing countries.
- Development of novel product formulations, such as Aloe Vera infused skincare products or nutritional supplements.
- Leveraging e-commerce and direct-to-consumer channels.
- Focusing on sustainable sourcing practices and environmental responsibility.
Growth Accelerators in the Aloe Vera Products Industry Industry
Strategic partnerships between Aloe Vera producers and established beverage companies can unlock significant growth potential. Technological breakthroughs in sustainable extraction methods and improved processing techniques will enhance product quality and reduce production costs. Expansion into new geographical markets and introduction of innovative product formats will drive market penetration.
Key Players Shaping the Aloe Vera Products Industry Market
- Grace Foods
- Tory's Choice Inc
- OKF
- Alterfood
- Okyalo
- Houssy Global
- Veganic
- Forever Living Products
- Simplee Aloe
Notable Milestones in Aloe Vera Products Industry Sector
- April 2021: Veganic launched 100% organic aloe vera juices in the US.
- October 2021: Sappe launched new aloe vera drinks in Thailand.
- September 2022: 1NE Beverages launched aloe vera juices in India.
In-Depth Aloe Vera Products Industry Market Outlook
The future of the Aloe Vera Products market is bright, driven by sustained consumer demand for healthy and functional beverages. Strategic investments in R&D, sustainable sourcing, and innovative marketing strategies will be crucial for long-term growth. The focus on expanding into new markets and introducing value-added products will further accelerate market expansion. The Aloe Vera industry is poised to capitalize on the growing global health and wellness trend, offering significant opportunities for businesses that innovate and adapt to evolving consumer preferences.
Aloe Vera Products Industry Segmentation
-
1. Product Type
- 1.1. Hot drinks
- 1.2. Bottled drinks
- 1.3. Juice Concentrates
- 1.4. Aloe Vera water
-
2. Distribution Channel
- 2.1. Supermarkets/Hypermarkets
- 2.2. Convenience/Grocery Stores
- 2.3. Specialty Stores
- 2.4. Online Retail Stores
- 2.5. Other Distribution Channels
Aloe Vera Products Industry Segmentation By Geography
-
1. North America
- 1.1. United States
- 1.2. Canada
- 1.3. Mexico
- 1.4. Rest of North America
-
2. Europe
- 2.1. Spain
- 2.2. United Kingdom
- 2.3. Germany
- 2.4. France
- 2.5. Italy
- 2.6. Russia
- 2.7. Rest of Europe
-
3. Asia Pacific
- 3.1. China
- 3.2. Japan
- 3.3. India
- 3.4. Australia
- 3.5. Rest of Asia Pacific
-
4. South America
- 4.1. Brazil
- 4.2. Argentina
- 4.3. Rest of South America
-
5. Middle East and Africa
- 5.1. South Africa
- 5.2. Saudi Arabia
- 5.3. Rest of Middle East and Africa
Aloe Vera Products Industry REPORT HIGHLIGHTS
| Aspects | Details |
|---|---|
| Study Period | 2019-2033 |
| Base Year | 2024 |
| Estimated Year | 2025 |
| Forecast Period | 2025-2033 |
| Historical Period | 2019-2024 |
| Growth Rate | CAGR of 10.90% from 2019-2033 |
| Segmentation |
|
Table of Contents
- 1. Introduction
- 1.1. Research Scope
- 1.2. Market Segmentation
- 1.3. Research Methodology
- 1.4. Definitions and Assumptions
- 2. Executive Summary
- 2.1. Introduction
- 3. Market Dynamics
- 3.1. Introduction
- 3.2. Market Drivers
- 3.2.1. Increasing Consumer Awareness Regarding Natural Products; Growing Demand for Anthocyanin in Pharmaceutical Industry
- 3.3. Market Restrains
- 3.3.1. Easy Availability of Synthetic Food Colorant
- 3.4. Market Trends
- 3.4.1. Aloe Vera based Juices to Witness Higher Growth
- 4. Market Factor Analysis
- 4.1. Porters Five Forces
- 4.2. Supply/Value Chain
- 4.3. PESTEL analysis
- 4.4. Market Entropy
- 4.5. Patent/Trademark Analysis
- 5. Global Aloe Vera Products Industry Analysis, Insights and Forecast, 2019-2031
- 5.1. Market Analysis, Insights and Forecast - by Product Type
- 5.1.1. Hot drinks
- 5.1.2. Bottled drinks
- 5.1.3. Juice Concentrates
- 5.1.4. Aloe Vera water
- 5.2. Market Analysis, Insights and Forecast - by Distribution Channel
- 5.2.1. Supermarkets/Hypermarkets
- 5.2.2. Convenience/Grocery Stores
- 5.2.3. Specialty Stores
- 5.2.4. Online Retail Stores
- 5.2.5. Other Distribution Channels
- 5.3. Market Analysis, Insights and Forecast - by Region
- 5.3.1. North America
- 5.3.2. Europe
- 5.3.3. Asia Pacific
- 5.3.4. South America
- 5.3.5. Middle East and Africa
- 5.1. Market Analysis, Insights and Forecast - by Product Type
- 6. North America Aloe Vera Products Industry Analysis, Insights and Forecast, 2019-2031
- 6.1. Market Analysis, Insights and Forecast - by Product Type
- 6.1.1. Hot drinks
- 6.1.2. Bottled drinks
- 6.1.3. Juice Concentrates
- 6.1.4. Aloe Vera water
- 6.2. Market Analysis, Insights and Forecast - by Distribution Channel
- 6.2.1. Supermarkets/Hypermarkets
- 6.2.2. Convenience/Grocery Stores
- 6.2.3. Specialty Stores
- 6.2.4. Online Retail Stores
- 6.2.5. Other Distribution Channels
- 6.1. Market Analysis, Insights and Forecast - by Product Type
- 7. Europe Aloe Vera Products Industry Analysis, Insights and Forecast, 2019-2031
- 7.1. Market Analysis, Insights and Forecast - by Product Type
- 7.1.1. Hot drinks
- 7.1.2. Bottled drinks
- 7.1.3. Juice Concentrates
- 7.1.4. Aloe Vera water
- 7.2. Market Analysis, Insights and Forecast - by Distribution Channel
- 7.2.1. Supermarkets/Hypermarkets
- 7.2.2. Convenience/Grocery Stores
- 7.2.3. Specialty Stores
- 7.2.4. Online Retail Stores
- 7.2.5. Other Distribution Channels
- 7.1. Market Analysis, Insights and Forecast - by Product Type
- 8. Asia Pacific Aloe Vera Products Industry Analysis, Insights and Forecast, 2019-2031
- 8.1. Market Analysis, Insights and Forecast - by Product Type
- 8.1.1. Hot drinks
- 8.1.2. Bottled drinks
- 8.1.3. Juice Concentrates
- 8.1.4. Aloe Vera water
- 8.2. Market Analysis, Insights and Forecast - by Distribution Channel
- 8.2.1. Supermarkets/Hypermarkets
- 8.2.2. Convenience/Grocery Stores
- 8.2.3. Specialty Stores
- 8.2.4. Online Retail Stores
- 8.2.5. Other Distribution Channels
- 8.1. Market Analysis, Insights and Forecast - by Product Type
- 9. South America Aloe Vera Products Industry Analysis, Insights and Forecast, 2019-2031
- 9.1. Market Analysis, Insights and Forecast - by Product Type
- 9.1.1. Hot drinks
- 9.1.2. Bottled drinks
- 9.1.3. Juice Concentrates
- 9.1.4. Aloe Vera water
- 9.2. Market Analysis, Insights and Forecast - by Distribution Channel
- 9.2.1. Supermarkets/Hypermarkets
- 9.2.2. Convenience/Grocery Stores
- 9.2.3. Specialty Stores
- 9.2.4. Online Retail Stores
- 9.2.5. Other Distribution Channels
- 9.1. Market Analysis, Insights and Forecast - by Product Type
- 10. Middle East and Africa Aloe Vera Products Industry Analysis, Insights and Forecast, 2019-2031
- 10.1. Market Analysis, Insights and Forecast - by Product Type
- 10.1.1. Hot drinks
- 10.1.2. Bottled drinks
- 10.1.3. Juice Concentrates
- 10.1.4. Aloe Vera water
- 10.2. Market Analysis, Insights and Forecast - by Distribution Channel
- 10.2.1. Supermarkets/Hypermarkets
- 10.2.2. Convenience/Grocery Stores
- 10.2.3. Specialty Stores
- 10.2.4. Online Retail Stores
- 10.2.5. Other Distribution Channels
- 10.1. Market Analysis, Insights and Forecast - by Product Type
- 11. North America Aloe Vera Products Industry Analysis, Insights and Forecast, 2019-2031
- 11.1. Market Analysis, Insights and Forecast - By Country/Sub-region
- 11.1.1 United States
- 11.1.2 Canada
- 11.1.3 Mexico
- 11.1.4 Rest of North America
- 12. Europe Aloe Vera Products Industry Analysis, Insights and Forecast, 2019-2031
- 12.1. Market Analysis, Insights and Forecast - By Country/Sub-region
- 12.1.1 Spain
- 12.1.2 United Kingdom
- 12.1.3 Germany
- 12.1.4 France
- 12.1.5 Italy
- 12.1.6 Russia
- 12.1.7 Rest of Europe
- 13. Asia Pacific Aloe Vera Products Industry Analysis, Insights and Forecast, 2019-2031
- 13.1. Market Analysis, Insights and Forecast - By Country/Sub-region
- 13.1.1 China
- 13.1.2 Japan
- 13.1.3 India
- 13.1.4 Australia
- 13.1.5 Rest of Asia Pacific
- 14. South America Aloe Vera Products Industry Analysis, Insights and Forecast, 2019-2031
- 14.1. Market Analysis, Insights and Forecast - By Country/Sub-region
- 14.1.1 Brazil
- 14.1.2 Argentina
- 14.1.3 Rest of South America
- 15. Middle East and Africa Aloe Vera Products Industry Analysis, Insights and Forecast, 2019-2031
- 15.1. Market Analysis, Insights and Forecast - By Country/Sub-region
- 15.1.1 South Africa
- 15.1.2 Saudi Arabia
- 15.1.3 Rest of Middle East and Africa
- 16. Competitive Analysis
- 16.1. Global Market Share Analysis 2024
- 16.2. Company Profiles
- 16.2.1 Grace Foods
- 16.2.1.1. Overview
- 16.2.1.2. Products
- 16.2.1.3. SWOT Analysis
- 16.2.1.4. Recent Developments
- 16.2.1.5. Financials (Based on Availability)
- 16.2.2 Tory's Choice Inc
- 16.2.2.1. Overview
- 16.2.2.2. Products
- 16.2.2.3. SWOT Analysis
- 16.2.2.4. Recent Developments
- 16.2.2.5. Financials (Based on Availability)
- 16.2.3 OKF
- 16.2.3.1. Overview
- 16.2.3.2. Products
- 16.2.3.3. SWOT Analysis
- 16.2.3.4. Recent Developments
- 16.2.3.5. Financials (Based on Availability)
- 16.2.4 Alterfood
- 16.2.4.1. Overview
- 16.2.4.2. Products
- 16.2.4.3. SWOT Analysis
- 16.2.4.4. Recent Developments
- 16.2.4.5. Financials (Based on Availability)
- 16.2.5 Okyalo
- 16.2.5.1. Overview
- 16.2.5.2. Products
- 16.2.5.3. SWOT Analysis
- 16.2.5.4. Recent Developments
- 16.2.5.5. Financials (Based on Availability)
- 16.2.6 Houssy Global
- 16.2.6.1. Overview
- 16.2.6.2. Products
- 16.2.6.3. SWOT Analysis
- 16.2.6.4. Recent Developments
- 16.2.6.5. Financials (Based on Availability)
- 16.2.7 Veganic*List Not Exhaustive
- 16.2.7.1. Overview
- 16.2.7.2. Products
- 16.2.7.3. SWOT Analysis
- 16.2.7.4. Recent Developments
- 16.2.7.5. Financials (Based on Availability)
- 16.2.8 Forever Living Products
- 16.2.8.1. Overview
- 16.2.8.2. Products
- 16.2.8.3. SWOT Analysis
- 16.2.8.4. Recent Developments
- 16.2.8.5. Financials (Based on Availability)
- 16.2.9 Simplee Aloe
- 16.2.9.1. Overview
- 16.2.9.2. Products
- 16.2.9.3. SWOT Analysis
- 16.2.9.4. Recent Developments
- 16.2.9.5. Financials (Based on Availability)
- 16.2.1 Grace Foods
List of Figures
- Figure 1: Global Aloe Vera Products Industry Revenue Breakdown (Million, %) by Region 2024 & 2032
- Figure 2: North America Aloe Vera Products Industry Revenue (Million), by Country 2024 & 2032
- Figure 3: North America Aloe Vera Products Industry Revenue Share (%), by Country 2024 & 2032
- Figure 4: Europe Aloe Vera Products Industry Revenue (Million), by Country 2024 & 2032
- Figure 5: Europe Aloe Vera Products Industry Revenue Share (%), by Country 2024 & 2032
- Figure 6: Asia Pacific Aloe Vera Products Industry Revenue (Million), by Country 2024 & 2032
- Figure 7: Asia Pacific Aloe Vera Products Industry Revenue Share (%), by Country 2024 & 2032
- Figure 8: South America Aloe Vera Products Industry Revenue (Million), by Country 2024 & 2032
- Figure 9: South America Aloe Vera Products Industry Revenue Share (%), by Country 2024 & 2032
- Figure 10: Middle East and Africa Aloe Vera Products Industry Revenue (Million), by Country 2024 & 2032
- Figure 11: Middle East and Africa Aloe Vera Products Industry Revenue Share (%), by Country 2024 & 2032
- Figure 12: North America Aloe Vera Products Industry Revenue (Million), by Product Type 2024 & 2032
- Figure 13: North America Aloe Vera Products Industry Revenue Share (%), by Product Type 2024 & 2032
- Figure 14: North America Aloe Vera Products Industry Revenue (Million), by Distribution Channel 2024 & 2032
- Figure 15: North America Aloe Vera Products Industry Revenue Share (%), by Distribution Channel 2024 & 2032
- Figure 16: North America Aloe Vera Products Industry Revenue (Million), by Country 2024 & 2032
- Figure 17: North America Aloe Vera Products Industry Revenue Share (%), by Country 2024 & 2032
- Figure 18: Europe Aloe Vera Products Industry Revenue (Million), by Product Type 2024 & 2032
- Figure 19: Europe Aloe Vera Products Industry Revenue Share (%), by Product Type 2024 & 2032
- Figure 20: Europe Aloe Vera Products Industry Revenue (Million), by Distribution Channel 2024 & 2032
- Figure 21: Europe Aloe Vera Products Industry Revenue Share (%), by Distribution Channel 2024 & 2032
- Figure 22: Europe Aloe Vera Products Industry Revenue (Million), by Country 2024 & 2032
- Figure 23: Europe Aloe Vera Products Industry Revenue Share (%), by Country 2024 & 2032
- Figure 24: Asia Pacific Aloe Vera Products Industry Revenue (Million), by Product Type 2024 & 2032
- Figure 25: Asia Pacific Aloe Vera Products Industry Revenue Share (%), by Product Type 2024 & 2032
- Figure 26: Asia Pacific Aloe Vera Products Industry Revenue (Million), by Distribution Channel 2024 & 2032
- Figure 27: Asia Pacific Aloe Vera Products Industry Revenue Share (%), by Distribution Channel 2024 & 2032
- Figure 28: Asia Pacific Aloe Vera Products Industry Revenue (Million), by Country 2024 & 2032
- Figure 29: Asia Pacific Aloe Vera Products Industry Revenue Share (%), by Country 2024 & 2032
- Figure 30: South America Aloe Vera Products Industry Revenue (Million), by Product Type 2024 & 2032
- Figure 31: South America Aloe Vera Products Industry Revenue Share (%), by Product Type 2024 & 2032
- Figure 32: South America Aloe Vera Products Industry Revenue (Million), by Distribution Channel 2024 & 2032
- Figure 33: South America Aloe Vera Products Industry Revenue Share (%), by Distribution Channel 2024 & 2032
- Figure 34: South America Aloe Vera Products Industry Revenue (Million), by Country 2024 & 2032
- Figure 35: South America Aloe Vera Products Industry Revenue Share (%), by Country 2024 & 2032
- Figure 36: Middle East and Africa Aloe Vera Products Industry Revenue (Million), by Product Type 2024 & 2032
- Figure 37: Middle East and Africa Aloe Vera Products Industry Revenue Share (%), by Product Type 2024 & 2032
- Figure 38: Middle East and Africa Aloe Vera Products Industry Revenue (Million), by Distribution Channel 2024 & 2032
- Figure 39: Middle East and Africa Aloe Vera Products Industry Revenue Share (%), by Distribution Channel 2024 & 2032
- Figure 40: Middle East and Africa Aloe Vera Products Industry Revenue (Million), by Country 2024 & 2032
- Figure 41: Middle East and Africa Aloe Vera Products Industry Revenue Share (%), by Country 2024 & 2032
List of Tables
- Table 1: Global Aloe Vera Products Industry Revenue Million Forecast, by Region 2019 & 2032
- Table 2: Global Aloe Vera Products Industry Revenue Million Forecast, by Product Type 2019 & 2032
- Table 3: Global Aloe Vera Products Industry Revenue Million Forecast, by Distribution Channel 2019 & 2032
- Table 4: Global Aloe Vera Products Industry Revenue Million Forecast, by Region 2019 & 2032
- Table 5: Global Aloe Vera Products Industry Revenue Million Forecast, by Country 2019 & 2032
- Table 6: United States Aloe Vera Products Industry Revenue (Million) Forecast, by Application 2019 & 2032
- Table 7: Canada Aloe Vera Products Industry Revenue (Million) Forecast, by Application 2019 & 2032
- Table 8: Mexico Aloe Vera Products Industry Revenue (Million) Forecast, by Application 2019 & 2032
- Table 9: Rest of North America Aloe Vera Products Industry Revenue (Million) Forecast, by Application 2019 & 2032
- Table 10: Global Aloe Vera Products Industry Revenue Million Forecast, by Country 2019 & 2032
- Table 11: Spain Aloe Vera Products Industry Revenue (Million) Forecast, by Application 2019 & 2032
- Table 12: United Kingdom Aloe Vera Products Industry Revenue (Million) Forecast, by Application 2019 & 2032
- Table 13: Germany Aloe Vera Products Industry Revenue (Million) Forecast, by Application 2019 & 2032
- Table 14: France Aloe Vera Products Industry Revenue (Million) Forecast, by Application 2019 & 2032
- Table 15: Italy Aloe Vera Products Industry Revenue (Million) Forecast, by Application 2019 & 2032
- Table 16: Russia Aloe Vera Products Industry Revenue (Million) Forecast, by Application 2019 & 2032
- Table 17: Rest of Europe Aloe Vera Products Industry Revenue (Million) Forecast, by Application 2019 & 2032
- Table 18: Global Aloe Vera Products Industry Revenue Million Forecast, by Country 2019 & 2032
- Table 19: China Aloe Vera Products Industry Revenue (Million) Forecast, by Application 2019 & 2032
- Table 20: Japan Aloe Vera Products Industry Revenue (Million) Forecast, by Application 2019 & 2032
- Table 21: India Aloe Vera Products Industry Revenue (Million) Forecast, by Application 2019 & 2032
- Table 22: Australia Aloe Vera Products Industry Revenue (Million) Forecast, by Application 2019 & 2032
- Table 23: Rest of Asia Pacific Aloe Vera Products Industry Revenue (Million) Forecast, by Application 2019 & 2032
- Table 24: Global Aloe Vera Products Industry Revenue Million Forecast, by Country 2019 & 2032
- Table 25: Brazil Aloe Vera Products Industry Revenue (Million) Forecast, by Application 2019 & 2032
- Table 26: Argentina Aloe Vera Products Industry Revenue (Million) Forecast, by Application 2019 & 2032
- Table 27: Rest of South America Aloe Vera Products Industry Revenue (Million) Forecast, by Application 2019 & 2032
- Table 28: Global Aloe Vera Products Industry Revenue Million Forecast, by Country 2019 & 2032
- Table 29: South Africa Aloe Vera Products Industry Revenue (Million) Forecast, by Application 2019 & 2032
- Table 30: Saudi Arabia Aloe Vera Products Industry Revenue (Million) Forecast, by Application 2019 & 2032
- Table 31: Rest of Middle East and Africa Aloe Vera Products Industry Revenue (Million) Forecast, by Application 2019 & 2032
- Table 32: Global Aloe Vera Products Industry Revenue Million Forecast, by Product Type 2019 & 2032
- Table 33: Global Aloe Vera Products Industry Revenue Million Forecast, by Distribution Channel 2019 & 2032
- Table 34: Global Aloe Vera Products Industry Revenue Million Forecast, by Country 2019 & 2032
- Table 35: United States Aloe Vera Products Industry Revenue (Million) Forecast, by Application 2019 & 2032
- Table 36: Canada Aloe Vera Products Industry Revenue (Million) Forecast, by Application 2019 & 2032
- Table 37: Mexico Aloe Vera Products Industry Revenue (Million) Forecast, by Application 2019 & 2032
- Table 38: Rest of North America Aloe Vera Products Industry Revenue (Million) Forecast, by Application 2019 & 2032
- Table 39: Global Aloe Vera Products Industry Revenue Million Forecast, by Product Type 2019 & 2032
- Table 40: Global Aloe Vera Products Industry Revenue Million Forecast, by Distribution Channel 2019 & 2032
- Table 41: Global Aloe Vera Products Industry Revenue Million Forecast, by Country 2019 & 2032
- Table 42: Spain Aloe Vera Products Industry Revenue (Million) Forecast, by Application 2019 & 2032
- Table 43: United Kingdom Aloe Vera Products Industry Revenue (Million) Forecast, by Application 2019 & 2032
- Table 44: Germany Aloe Vera Products Industry Revenue (Million) Forecast, by Application 2019 & 2032
- Table 45: France Aloe Vera Products Industry Revenue (Million) Forecast, by Application 2019 & 2032
- Table 46: Italy Aloe Vera Products Industry Revenue (Million) Forecast, by Application 2019 & 2032
- Table 47: Russia Aloe Vera Products Industry Revenue (Million) Forecast, by Application 2019 & 2032
- Table 48: Rest of Europe Aloe Vera Products Industry Revenue (Million) Forecast, by Application 2019 & 2032
- Table 49: Global Aloe Vera Products Industry Revenue Million Forecast, by Product Type 2019 & 2032
- Table 50: Global Aloe Vera Products Industry Revenue Million Forecast, by Distribution Channel 2019 & 2032
- Table 51: Global Aloe Vera Products Industry Revenue Million Forecast, by Country 2019 & 2032
- Table 52: China Aloe Vera Products Industry Revenue (Million) Forecast, by Application 2019 & 2032
- Table 53: Japan Aloe Vera Products Industry Revenue (Million) Forecast, by Application 2019 & 2032
- Table 54: India Aloe Vera Products Industry Revenue (Million) Forecast, by Application 2019 & 2032
- Table 55: Australia Aloe Vera Products Industry Revenue (Million) Forecast, by Application 2019 & 2032
- Table 56: Rest of Asia Pacific Aloe Vera Products Industry Revenue (Million) Forecast, by Application 2019 & 2032
- Table 57: Global Aloe Vera Products Industry Revenue Million Forecast, by Product Type 2019 & 2032
- Table 58: Global Aloe Vera Products Industry Revenue Million Forecast, by Distribution Channel 2019 & 2032
- Table 59: Global Aloe Vera Products Industry Revenue Million Forecast, by Country 2019 & 2032
- Table 60: Brazil Aloe Vera Products Industry Revenue (Million) Forecast, by Application 2019 & 2032
- Table 61: Argentina Aloe Vera Products Industry Revenue (Million) Forecast, by Application 2019 & 2032
- Table 62: Rest of South America Aloe Vera Products Industry Revenue (Million) Forecast, by Application 2019 & 2032
- Table 63: Global Aloe Vera Products Industry Revenue Million Forecast, by Product Type 2019 & 2032
- Table 64: Global Aloe Vera Products Industry Revenue Million Forecast, by Distribution Channel 2019 & 2032
- Table 65: Global Aloe Vera Products Industry Revenue Million Forecast, by Country 2019 & 2032
- Table 66: South Africa Aloe Vera Products Industry Revenue (Million) Forecast, by Application 2019 & 2032
- Table 67: Saudi Arabia Aloe Vera Products Industry Revenue (Million) Forecast, by Application 2019 & 2032
- Table 68: Rest of Middle East and Africa Aloe Vera Products Industry Revenue (Million) Forecast, by Application 2019 & 2032
Frequently Asked Questions
1. What is the projected Compound Annual Growth Rate (CAGR) of the Aloe Vera Products Industry?
The projected CAGR is approximately 10.90%.
2. Which companies are prominent players in the Aloe Vera Products Industry?
Key companies in the market include Grace Foods, Tory's Choice Inc, OKF, Alterfood, Okyalo, Houssy Global, Veganic*List Not Exhaustive, Forever Living Products, Simplee Aloe.
3. What are the main segments of the Aloe Vera Products Industry?
The market segments include Product Type, Distribution Channel.
4. Can you provide details about the market size?
The market size is estimated to be USD 155.16 Million as of 2022.
5. What are some drivers contributing to market growth?
Increasing Consumer Awareness Regarding Natural Products; Growing Demand for Anthocyanin in Pharmaceutical Industry.
6. What are the notable trends driving market growth?
Aloe Vera based Juices to Witness Higher Growth.
7. Are there any restraints impacting market growth?
Easy Availability of Synthetic Food Colorant.
8. Can you provide examples of recent developments in the market?
September 2022: 1NE Beverages, a seasoning and beverage brand under the subsidiary of US-based Livinia Foods, launched aloe vera juices available in a range of flavors in India. The company claims the product has antioxidant properties and multiple health benefits ranging from skin, oral, dental, or digestive health.
9. What pricing options are available for accessing the report?
Pricing options include single-user, multi-user, and enterprise licenses priced at USD 4750, USD 5250, and USD 8750 respectively.
10. Is the market size provided in terms of value or volume?
The market size is provided in terms of value, measured in Million.
11. Are there any specific market keywords associated with the report?
Yes, the market keyword associated with the report is "Aloe Vera Products Industry," which aids in identifying and referencing the specific market segment covered.
12. How do I determine which pricing option suits my needs best?
The pricing options vary based on user requirements and access needs. Individual users may opt for single-user licenses, while businesses requiring broader access may choose multi-user or enterprise licenses for cost-effective access to the report.
13. Are there any additional resources or data provided in the Aloe Vera Products Industry report?
While the report offers comprehensive insights, it's advisable to review the specific contents or supplementary materials provided to ascertain if additional resources or data are available.
14. How can I stay updated on further developments or reports in the Aloe Vera Products Industry?
To stay informed about further developments, trends, and reports in the Aloe Vera Products Industry, consider subscribing to industry newsletters, following relevant companies and organizations, or regularly checking reputable industry news sources and publications.
Methodology
Step 1 - Identification of Relevant Samples Size from Population Database


Step 2 - Approaches for Defining Global Market Size (Value, Volume* & Price*)

Note*: In applicable scenarios
Step 3 - Data Sources
Primary Research
- Web Analytics
- Survey Reports
- Research Institute
- Latest Research Reports
- Opinion Leaders
Secondary Research
- Annual Reports
- White Paper
- Latest Press Release
- Industry Association
- Paid Database
- Investor Presentations

Step 4 - Data Triangulation
Involves using different sources of information in order to increase the validity of a study
These sources are likely to be stakeholders in a program - participants, other researchers, program staff, other community members, and so on.
Then we put all data in single framework & apply various statistical tools to find out the dynamic on the market.
During the analysis stage, feedback from the stakeholder groups would be compared to determine areas of agreement as well as areas of divergence
