

Key Insights
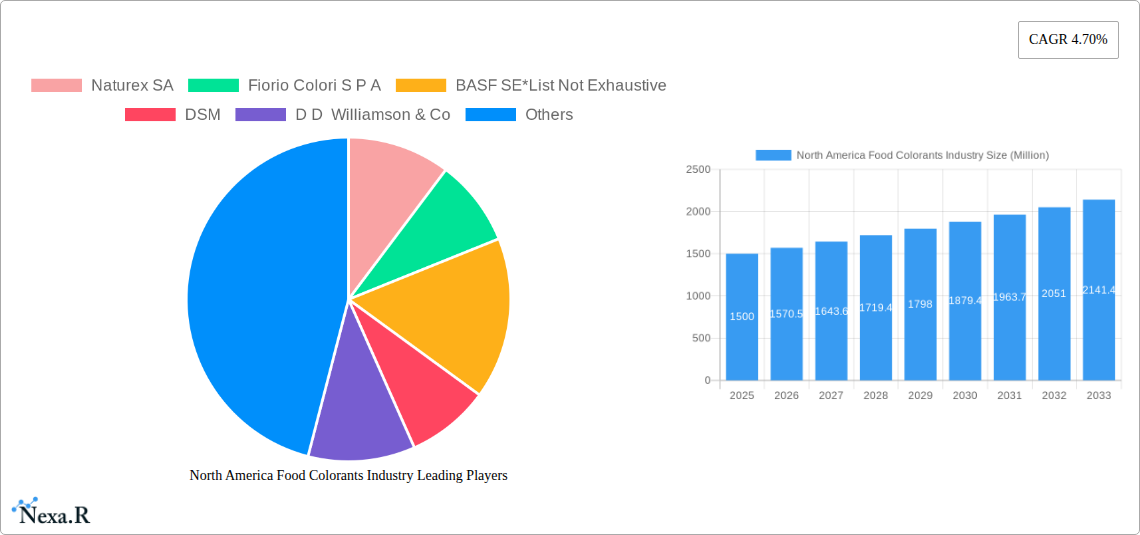
The North America food colorants market, valued at approximately $1.5 billion in 2025, is projected to experience robust growth, driven by increasing demand for processed foods and beverages, coupled with rising consumer preference for visually appealing products. The market's Compound Annual Growth Rate (CAGR) of 4.70% from 2025 to 2033 reflects a steady expansion, anticipated to reach approximately $2.3 billion by 2033. Key market segments include natural colorants, which are witnessing accelerated growth due to escalating health consciousness and regulatory pressure regarding artificial additives. Synthetic colorants, while still holding significant market share, are expected to face slower growth rates due to these aforementioned trends. Within applications, the beverages sector is a major contributor, followed by dairy & frozen products, bakery items, and confectionery. The United States holds the dominant market share within North America, fueled by its large food processing and manufacturing industries. Growth is also being stimulated by innovative product development, including the introduction of new colorant formulations with enhanced stability and functionality. However, fluctuating raw material prices and stringent regulatory compliance requirements pose potential challenges to market expansion. Competitive intensity is moderate, with key players like Naturex, BASF, DSM, and Sensient Technologies constantly striving for innovation and market share expansion through strategic acquisitions and product diversification.
The market's segmentation offers lucrative opportunities for specialized players. For example, companies focusing on natural food colorants derived from plant-based sources are well-positioned to capture considerable growth. This is particularly true given the increasing consumer preference for clean-label products and the growing awareness of the potential health implications associated with artificial food colorants. Regional disparities exist within North America, with the United States exhibiting higher growth compared to Canada and Mexico. This discrepancy stems from differences in consumer preferences, regulatory landscapes, and economic conditions across these nations. Future growth will likely be influenced by factors such as evolving consumer trends, technological advancements in colorant production, and stricter regulatory guidelines impacting the use of artificial colorants. Companies will increasingly need to adapt their strategies to cater to the changing demands of health-conscious consumers and navigate the complexities of a more regulated market environment.
North America Food Colorants Industry Market Report: 2019-2033
This comprehensive report provides an in-depth analysis of the North America food colorants industry, encompassing market dynamics, growth trends, dominant segments, and key players. With a study period spanning 2019-2033, a base year of 2025, and a forecast period of 2025-2033, this report offers invaluable insights for industry professionals, investors, and strategic decision-makers. The report covers both parent and child markets for a more detailed and holistic understanding.
North America Food Colorants Industry Market Dynamics & Structure
This section analyzes the competitive landscape of the North American food colorants market, examining market concentration, technological advancements, regulatory compliance, substitute products, end-user demographics, and merger & acquisition (M&A) activity. The market is moderately concentrated, with key players holding significant market share.
- Market Concentration: The top five players hold approximately xx% of the market share in 2025.
- Technological Innovation: Significant innovation focuses on natural colorants and sustainable production methods, driven by consumer demand for clean-label products. However, challenges remain in achieving cost parity with synthetic counterparts.
- Regulatory Framework: Stringent regulations regarding food safety and labeling significantly impact product development and market access. Compliance costs represent a significant barrier for smaller players.
- Competitive Substitutes: Natural ingredients and alternative coloring techniques are emerging as substitutes, particularly in the health-conscious segment.
- End-User Demographics: Growing health awareness and demand for natural food products are primary drivers for market segmentation.
- M&A Trends: The industry witnesses a moderate level of M&A activity, with larger companies acquiring smaller players to expand their product portfolios and geographic reach. An estimated xx M&A deals occurred between 2019 and 2024.
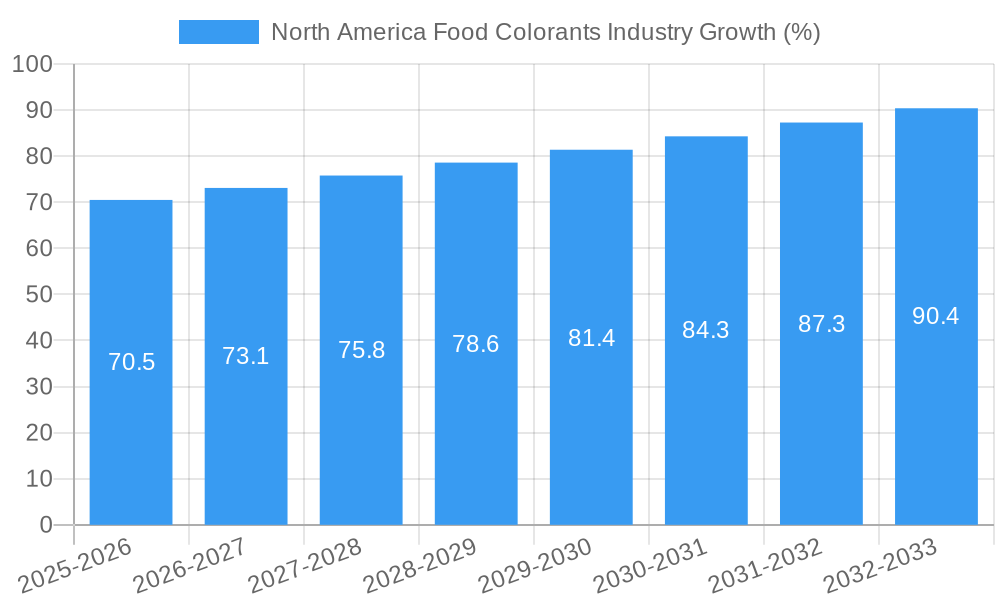
North America Food Colorants Industry Growth Trends & Insights
The North America food colorants market exhibits a steady growth trajectory, fueled by the expanding food and beverage sector and increasing consumer demand for visually appealing products. The market size reached xx million in 2025 and is projected to reach xx million by 2033, exhibiting a CAGR of xx% during the forecast period. This growth is driven by several factors:
- Increasing demand for processed foods and convenience products across various food categories (Beverages, Bakery, Confectionery, etc.) significantly fuels the market growth.
- The rise of innovative product development and product differentiation strategies that place emphasis on visual appeal and aesthetics.
- Changing consumer preferences for natural and organic food colorants lead to significant market expansion in the natural segment.
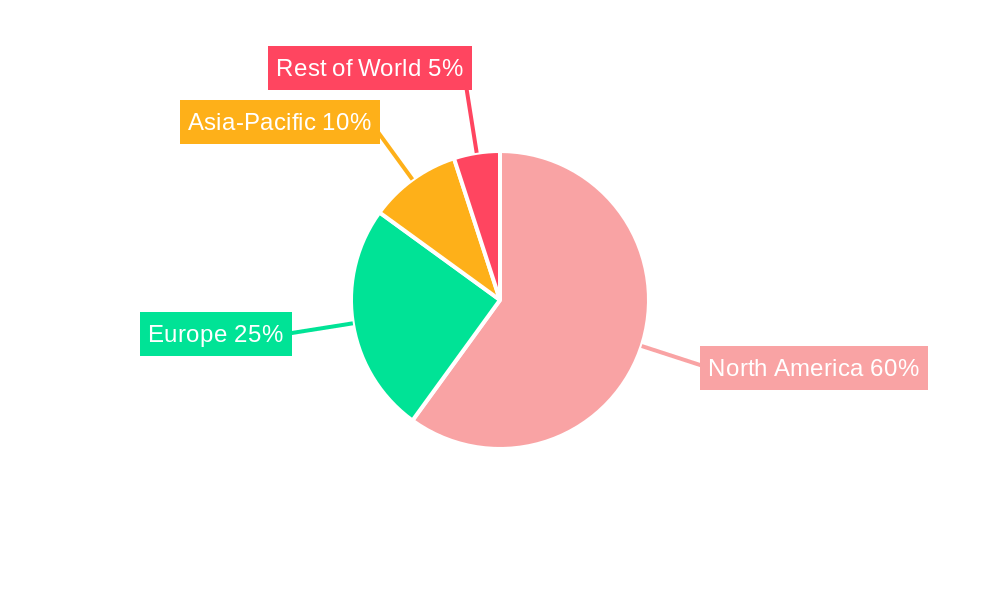
Dominant Regions, Countries, or Segments in North America Food Colorants Industry
The United States dominates the North American food colorants market, accounting for approximately xx% of the total market value in 2025. This dominance is attributed to the large and diverse food and beverage industry, high consumer spending on processed foods, and robust regulatory frameworks. Within the product type segment, Synthetic colors hold a larger market share compared to natural colors in 2025 (xx% vs xx%), driven by their cost-effectiveness and versatility. However, the natural color segment is exhibiting faster growth, with a projected CAGR of xx% during the forecast period, exceeding that of synthetic colorants. The beverages segment is the largest application area, followed by confectionery and dairy & frozen products. Key drivers for regional and segment dominance include:
- United States: Large and established food processing industry, high consumer spending on packaged food products.
- Beverages Segment: High demand for visually appealing drinks.
- Synthetic Color Segment: Cost-effectiveness and wide range of applications.
North America Food Colorants Industry Product Landscape
The North American food colorants market showcases a wide array of products, ranging from synthetic dyes to natural extracts and pigments. Product innovation focuses on developing clean-label options, improving color stability, and enhancing functionality. Key advancements include the development of highly concentrated colorants for reduced usage and improved color consistency, alongside natural alternatives that meet increasing consumer demand.
Key Drivers, Barriers & Challenges in North America Food Colorants Industry
Key Drivers: Growing demand for processed foods, increasing consumer preference for vibrant colors in food, and the expansion of the food and beverage industry are major drivers. Government regulations on food labeling and safety standards further shape product development.
Challenges: Fluctuations in raw material prices, stringent regulatory compliance requirements, and intense competition from both domestic and international players pose significant challenges. Supply chain disruptions, particularly those related to natural colorant sourcing, can lead to production delays and increased costs. Estimated xx% of the production cost is impacted by the volatile supply chain affecting market growth and profitability.
Emerging Opportunities in North America Food Colorants Industry
Emerging opportunities lie in the growing demand for clean-label and natural food colorants, the increasing popularity of plant-based foods, and the expansion of functional food products. There is considerable potential for innovative applications of food colorants in novel food formats and personalized nutrition solutions.
Growth Accelerators in the North America Food Colorants Industry Industry
Technological advancements, strategic partnerships, and expansion into emerging food segments are driving long-term growth. The development of sustainable and cost-effective natural colorants and the exploration of new application areas within the health and wellness sector are further accelerating market expansion.
Key Players Shaping the North America Food Colorants Industry Market
- Naturex SA
- Fiorio Colori S P A
- BASF SE
- DSM
- D D Williamson & Co
- Chr. Hansen Holdings
- Dohler group
- Sensient Technologies Corporation
Notable Milestones in North America Food Colorants Industry Sector
- 2021: Increased regulatory scrutiny on synthetic colorants leads to a surge in demand for natural alternatives.
- 2022: Major players launch new product lines focusing on clean-label and sustainable solutions.
- 2023: Several M&A activities consolidate market share amongst leading players.
In-Depth North America Food Colorants Industry Market Outlook
The North America food colorants market presents significant growth potential driven by continued expansion of the food and beverage sector, innovation in natural colorants, and evolving consumer preferences. Strategic partnerships, technological advancements, and a focus on sustainability will be critical success factors for companies operating in this dynamic market. The market is projected to witness robust growth in the coming years, providing lucrative opportunities for both established players and emerging businesses.
North America Food Colorants Industry Segmentation
-
1. Product Type
- 1.1. Natural Color
- 1.2. Synthetic Color
-
2. Application
- 2.1. Beverages
- 2.2. Dairy & Frozen Products
- 2.3. Bakery
- 2.4. Meat, Poultry and Seafood
- 2.5. Confectionery
- 2.6. Oils & Fats
- 2.7. Others
-
3. Geography
- 3.1. United States
- 3.2. Canada
- 3.3. Mexico
- 3.4. Rest of North America
North America Food Colorants Industry Segmentation By Geography
- 1. United States
- 2. Canada
- 3. Mexico
- 4. Rest of North America
North America Food Colorants Industry REPORT HIGHLIGHTS
| Aspects | Details |
|---|---|
| Study Period | 2019-2033 |
| Base Year | 2024 |
| Estimated Year | 2025 |
| Forecast Period | 2025-2033 |
| Historical Period | 2019-2024 |
| Growth Rate | CAGR of 4.70% from 2019-2033 |
| Segmentation |
|
Table of Contents
- 1. Introduction
- 1.1. Research Scope
- 1.2. Market Segmentation
- 1.3. Research Methodology
- 1.4. Definitions and Assumptions
- 2. Executive Summary
- 2.1. Introduction
- 3. Market Dynamics
- 3.1. Introduction
- 3.2. Market Drivers
- 3.2.1. Rising Health Consciousness among consumer
- 3.3. Market Restrains
- 3.3.1. High Cost of natural Ingredients
- 3.4. Market Trends
- 3.4.1. Growing Demand for Clean Label Products
- 4. Market Factor Analysis
- 4.1. Porters Five Forces
- 4.2. Supply/Value Chain
- 4.3. PESTEL analysis
- 4.4. Market Entropy
- 4.5. Patent/Trademark Analysis
- 5. North America Food Colorants Industry Analysis, Insights and Forecast, 2019-2031
- 5.1. Market Analysis, Insights and Forecast - by Product Type
- 5.1.1. Natural Color
- 5.1.2. Synthetic Color
- 5.2. Market Analysis, Insights and Forecast - by Application
- 5.2.1. Beverages
- 5.2.2. Dairy & Frozen Products
- 5.2.3. Bakery
- 5.2.4. Meat, Poultry and Seafood
- 5.2.5. Confectionery
- 5.2.6. Oils & Fats
- 5.2.7. Others
- 5.3. Market Analysis, Insights and Forecast - by Geography
- 5.3.1. United States
- 5.3.2. Canada
- 5.3.3. Mexico
- 5.3.4. Rest of North America
- 5.4. Market Analysis, Insights and Forecast - by Region
- 5.4.1. United States
- 5.4.2. Canada
- 5.4.3. Mexico
- 5.4.4. Rest of North America
- 5.1. Market Analysis, Insights and Forecast - by Product Type
- 6. United States North America Food Colorants Industry Analysis, Insights and Forecast, 2019-2031
- 6.1. Market Analysis, Insights and Forecast - by Product Type
- 6.1.1. Natural Color
- 6.1.2. Synthetic Color
- 6.2. Market Analysis, Insights and Forecast - by Application
- 6.2.1. Beverages
- 6.2.2. Dairy & Frozen Products
- 6.2.3. Bakery
- 6.2.4. Meat, Poultry and Seafood
- 6.2.5. Confectionery
- 6.2.6. Oils & Fats
- 6.2.7. Others
- 6.3. Market Analysis, Insights and Forecast - by Geography
- 6.3.1. United States
- 6.3.2. Canada
- 6.3.3. Mexico
- 6.3.4. Rest of North America
- 6.1. Market Analysis, Insights and Forecast - by Product Type
- 7. Canada North America Food Colorants Industry Analysis, Insights and Forecast, 2019-2031
- 7.1. Market Analysis, Insights and Forecast - by Product Type
- 7.1.1. Natural Color
- 7.1.2. Synthetic Color
- 7.2. Market Analysis, Insights and Forecast - by Application
- 7.2.1. Beverages
- 7.2.2. Dairy & Frozen Products
- 7.2.3. Bakery
- 7.2.4. Meat, Poultry and Seafood
- 7.2.5. Confectionery
- 7.2.6. Oils & Fats
- 7.2.7. Others
- 7.3. Market Analysis, Insights and Forecast - by Geography
- 7.3.1. United States
- 7.3.2. Canada
- 7.3.3. Mexico
- 7.3.4. Rest of North America
- 7.1. Market Analysis, Insights and Forecast - by Product Type
- 8. Mexico North America Food Colorants Industry Analysis, Insights and Forecast, 2019-2031
- 8.1. Market Analysis, Insights and Forecast - by Product Type
- 8.1.1. Natural Color
- 8.1.2. Synthetic Color
- 8.2. Market Analysis, Insights and Forecast - by Application
- 8.2.1. Beverages
- 8.2.2. Dairy & Frozen Products
- 8.2.3. Bakery
- 8.2.4. Meat, Poultry and Seafood
- 8.2.5. Confectionery
- 8.2.6. Oils & Fats
- 8.2.7. Others
- 8.3. Market Analysis, Insights and Forecast - by Geography
- 8.3.1. United States
- 8.3.2. Canada
- 8.3.3. Mexico
- 8.3.4. Rest of North America
- 8.1. Market Analysis, Insights and Forecast - by Product Type
- 9. Rest of North America North America Food Colorants Industry Analysis, Insights and Forecast, 2019-2031
- 9.1. Market Analysis, Insights and Forecast - by Product Type
- 9.1.1. Natural Color
- 9.1.2. Synthetic Color
- 9.2. Market Analysis, Insights and Forecast - by Application
- 9.2.1. Beverages
- 9.2.2. Dairy & Frozen Products
- 9.2.3. Bakery
- 9.2.4. Meat, Poultry and Seafood
- 9.2.5. Confectionery
- 9.2.6. Oils & Fats
- 9.2.7. Others
- 9.3. Market Analysis, Insights and Forecast - by Geography
- 9.3.1. United States
- 9.3.2. Canada
- 9.3.3. Mexico
- 9.3.4. Rest of North America
- 9.1. Market Analysis, Insights and Forecast - by Product Type
- 10. United States North America Food Colorants Industry Analysis, Insights and Forecast, 2019-2031
- 11. Canada North America Food Colorants Industry Analysis, Insights and Forecast, 2019-2031
- 12. Mexico North America Food Colorants Industry Analysis, Insights and Forecast, 2019-2031
- 13. Rest of North America North America Food Colorants Industry Analysis, Insights and Forecast, 2019-2031
- 14. Competitive Analysis
- 14.1. Market Share Analysis 2024
- 14.2. Company Profiles
- 14.2.1 Naturex SA
- 14.2.1.1. Overview
- 14.2.1.2. Products
- 14.2.1.3. SWOT Analysis
- 14.2.1.4. Recent Developments
- 14.2.1.5. Financials (Based on Availability)
- 14.2.2 Fiorio Colori S P A
- 14.2.2.1. Overview
- 14.2.2.2. Products
- 14.2.2.3. SWOT Analysis
- 14.2.2.4. Recent Developments
- 14.2.2.5. Financials (Based on Availability)
- 14.2.3 BASF SE*List Not Exhaustive
- 14.2.3.1. Overview
- 14.2.3.2. Products
- 14.2.3.3. SWOT Analysis
- 14.2.3.4. Recent Developments
- 14.2.3.5. Financials (Based on Availability)
- 14.2.4 DSM
- 14.2.4.1. Overview
- 14.2.4.2. Products
- 14.2.4.3. SWOT Analysis
- 14.2.4.4. Recent Developments
- 14.2.4.5. Financials (Based on Availability)
- 14.2.5 D D Williamson & Co
- 14.2.5.1. Overview
- 14.2.5.2. Products
- 14.2.5.3. SWOT Analysis
- 14.2.5.4. Recent Developments
- 14.2.5.5. Financials (Based on Availability)
- 14.2.6 Chr Hansen holdings
- 14.2.6.1. Overview
- 14.2.6.2. Products
- 14.2.6.3. SWOT Analysis
- 14.2.6.4. Recent Developments
- 14.2.6.5. Financials (Based on Availability)
- 14.2.7 Dohler group
- 14.2.7.1. Overview
- 14.2.7.2. Products
- 14.2.7.3. SWOT Analysis
- 14.2.7.4. Recent Developments
- 14.2.7.5. Financials (Based on Availability)
- 14.2.8 Sensient technologies Corporation
- 14.2.8.1. Overview
- 14.2.8.2. Products
- 14.2.8.3. SWOT Analysis
- 14.2.8.4. Recent Developments
- 14.2.8.5. Financials (Based on Availability)
- 14.2.1 Naturex SA
List of Figures
- Figure 1: North America Food Colorants Industry Revenue Breakdown (Million, %) by Product 2024 & 2032
- Figure 2: North America Food Colorants Industry Share (%) by Company 2024
List of Tables
- Table 1: North America Food Colorants Industry Revenue Million Forecast, by Region 2019 & 2032
- Table 2: North America Food Colorants Industry Revenue Million Forecast, by Product Type 2019 & 2032
- Table 3: North America Food Colorants Industry Revenue Million Forecast, by Application 2019 & 2032
- Table 4: North America Food Colorants Industry Revenue Million Forecast, by Geography 2019 & 2032
- Table 5: North America Food Colorants Industry Revenue Million Forecast, by Region 2019 & 2032
- Table 6: North America Food Colorants Industry Revenue Million Forecast, by Country 2019 & 2032
- Table 7: United States North America Food Colorants Industry Revenue (Million) Forecast, by Application 2019 & 2032
- Table 8: Canada North America Food Colorants Industry Revenue (Million) Forecast, by Application 2019 & 2032
- Table 9: Mexico North America Food Colorants Industry Revenue (Million) Forecast, by Application 2019 & 2032
- Table 10: Rest of North America North America Food Colorants Industry Revenue (Million) Forecast, by Application 2019 & 2032
- Table 11: North America Food Colorants Industry Revenue Million Forecast, by Product Type 2019 & 2032
- Table 12: North America Food Colorants Industry Revenue Million Forecast, by Application 2019 & 2032
- Table 13: North America Food Colorants Industry Revenue Million Forecast, by Geography 2019 & 2032
- Table 14: North America Food Colorants Industry Revenue Million Forecast, by Country 2019 & 2032
- Table 15: North America Food Colorants Industry Revenue Million Forecast, by Product Type 2019 & 2032
- Table 16: North America Food Colorants Industry Revenue Million Forecast, by Application 2019 & 2032
- Table 17: North America Food Colorants Industry Revenue Million Forecast, by Geography 2019 & 2032
- Table 18: North America Food Colorants Industry Revenue Million Forecast, by Country 2019 & 2032
- Table 19: North America Food Colorants Industry Revenue Million Forecast, by Product Type 2019 & 2032
- Table 20: North America Food Colorants Industry Revenue Million Forecast, by Application 2019 & 2032
- Table 21: North America Food Colorants Industry Revenue Million Forecast, by Geography 2019 & 2032
- Table 22: North America Food Colorants Industry Revenue Million Forecast, by Country 2019 & 2032
- Table 23: North America Food Colorants Industry Revenue Million Forecast, by Product Type 2019 & 2032
- Table 24: North America Food Colorants Industry Revenue Million Forecast, by Application 2019 & 2032
- Table 25: North America Food Colorants Industry Revenue Million Forecast, by Geography 2019 & 2032
- Table 26: North America Food Colorants Industry Revenue Million Forecast, by Country 2019 & 2032
Frequently Asked Questions
1. What is the projected Compound Annual Growth Rate (CAGR) of the North America Food Colorants Industry?
The projected CAGR is approximately 4.70%.
2. Which companies are prominent players in the North America Food Colorants Industry?
Key companies in the market include Naturex SA, Fiorio Colori S P A, BASF SE*List Not Exhaustive, DSM, D D Williamson & Co, Chr Hansen holdings, Dohler group, Sensient technologies Corporation.
3. What are the main segments of the North America Food Colorants Industry?
The market segments include Product Type, Application, Geography.
4. Can you provide details about the market size?
The market size is estimated to be USD XX Million as of 2022.
5. What are some drivers contributing to market growth?
Rising Health Consciousness among consumer.
6. What are the notable trends driving market growth?
Growing Demand for Clean Label Products.
7. Are there any restraints impacting market growth?
High Cost of natural Ingredients.
8. Can you provide examples of recent developments in the market?
N/A
9. What pricing options are available for accessing the report?
Pricing options include single-user, multi-user, and enterprise licenses priced at USD 4750, USD 5250, and USD 8750 respectively.
10. Is the market size provided in terms of value or volume?
The market size is provided in terms of value, measured in Million.
11. Are there any specific market keywords associated with the report?
Yes, the market keyword associated with the report is "North America Food Colorants Industry," which aids in identifying and referencing the specific market segment covered.
12. How do I determine which pricing option suits my needs best?
The pricing options vary based on user requirements and access needs. Individual users may opt for single-user licenses, while businesses requiring broader access may choose multi-user or enterprise licenses for cost-effective access to the report.
13. Are there any additional resources or data provided in the North America Food Colorants Industry report?
While the report offers comprehensive insights, it's advisable to review the specific contents or supplementary materials provided to ascertain if additional resources or data are available.
14. How can I stay updated on further developments or reports in the North America Food Colorants Industry?
To stay informed about further developments, trends, and reports in the North America Food Colorants Industry, consider subscribing to industry newsletters, following relevant companies and organizations, or regularly checking reputable industry news sources and publications.
Methodology
Step 1 - Identification of Relevant Samples Size from Population Database


Step 2 - Approaches for Defining Global Market Size (Value, Volume* & Price*)

Note*: In applicable scenarios
Step 3 - Data Sources
Primary Research
- Web Analytics
- Survey Reports
- Research Institute
- Latest Research Reports
- Opinion Leaders
Secondary Research
- Annual Reports
- White Paper
- Latest Press Release
- Industry Association
- Paid Database
- Investor Presentations

Step 4 - Data Triangulation
Involves using different sources of information in order to increase the validity of a study
These sources are likely to be stakeholders in a program - participants, other researchers, program staff, other community members, and so on.
Then we put all data in single framework & apply various statistical tools to find out the dynamic on the market.
During the analysis stage, feedback from the stakeholder groups would be compared to determine areas of agreement as well as areas of divergence
