

Key Insights
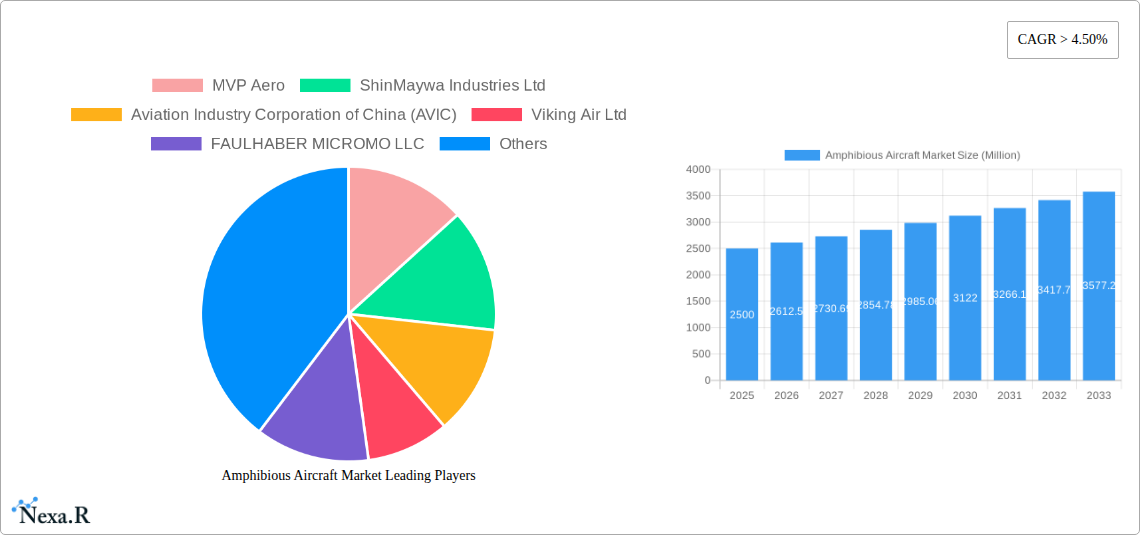
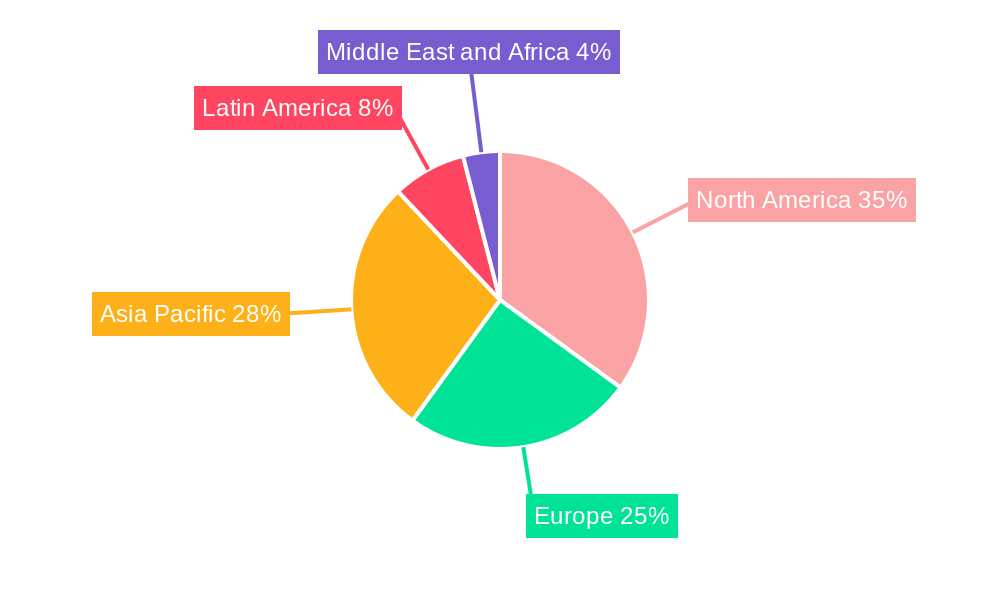
The amphibious aircraft market is experiencing robust growth, driven by increasing demand for versatile aircraft capable of operating from both land and water. The market's Compound Annual Growth Rate (CAGR) exceeding 4.50% from 2019 to 2024 indicates a significant upward trajectory. This growth is fueled by several key factors. Firstly, the civilian sector is witnessing heightened demand for amphibious aircraft for various applications, including tourism, search and rescue operations, and transporting goods to remote areas with limited infrastructure. Secondly, military applications are contributing significantly, with a growing need for these aircraft in coastal surveillance, maritime patrol, and amphibious assault operations. The market is segmented by application (civilian and military) and engine type (piston and turboprop), with turboprop engines increasingly dominating due to their superior power and range. Technological advancements, such as improved materials and engine efficiency, are further bolstering market expansion. However, high initial investment costs and stringent regulatory approvals can act as market restraints. The North American market currently holds a substantial share, driven by strong demand from both civilian and military sectors, but the Asia-Pacific region is projected to witness the fastest growth in the forecast period (2025-2033), spurred by economic development and increased infrastructure investment in countries like China and India. Leading manufacturers such as Viking Air, AVIC, and MVP Aero are strategically positioning themselves to capitalize on these growth opportunities through product innovation and expansion of their global reach.
The forecast period (2025-2033) promises continued expansion, with the market size projected to grow significantly due to factors such as increasing government spending on defense, rising tourism in coastal and island regions, and the growing acceptance of sustainable aviation practices. The market segmentation continues to evolve, with advancements in electric and hybrid-electric propulsion systems likely to shape the future landscape. However, challenges such as environmental concerns, geopolitical uncertainties, and the need for robust maintenance infrastructure will need careful consideration by industry stakeholders to ensure sustainable growth. Competition among manufacturers is intensifying, driving innovation and creating more affordable and advanced amphibious aircraft options for various applications. Companies are increasingly focusing on developing lighter, more fuel-efficient aircraft with enhanced safety features to cater to the evolving market demands.
This in-depth report provides a comprehensive analysis of the Amphibious Aircraft Market, encompassing market dynamics, growth trends, regional dominance, product landscape, key challenges, emerging opportunities, and key players. The study covers the historical period (2019-2024), base year (2025), and forecast period (2025-2033), offering valuable insights for industry professionals, investors, and strategic decision-makers. The market is segmented by application (civilian and military) and engine type (piston and turboprop). This report projects a market size of xx million units by 2033.
Amphibious Aircraft Market Dynamics & Structure
The Amphibious Aircraft market exhibits a moderately concentrated structure, with key players holding significant market share. Technological innovation, particularly in materials science and propulsion systems, is a primary driver of growth. Stringent regulatory frameworks governing aircraft certification and safety standards pose both challenges and opportunities for market entrants. The market witnesses competition from alternative transportation methods, particularly in niche applications. M&A activity has been relatively modest, with xx deals recorded between 2019 and 2024, representing a xx% increase compared to the previous five-year period. End-user demographics are shifting towards increasing demand from civilian sectors, particularly tourism and search and rescue operations.
- Market Concentration: Moderately concentrated, with top 5 players holding approximately xx% market share in 2024.
- Technological Innovation: Focus on lightweight materials, advanced avionics, and hybrid-electric propulsion systems.
- Regulatory Framework: Stringent safety regulations impacting certification and operational costs.
- Competitive Substitutes: Helicopters, boats, and traditional fixed-wing aircraft pose competition in specific applications.
- M&A Activity: xx deals between 2019-2024, indicating moderate consolidation.
- Innovation Barriers: High development costs, complex certification processes, and limited access to specialized manufacturing technologies.
Amphibious Aircraft Market Growth Trends & Insights
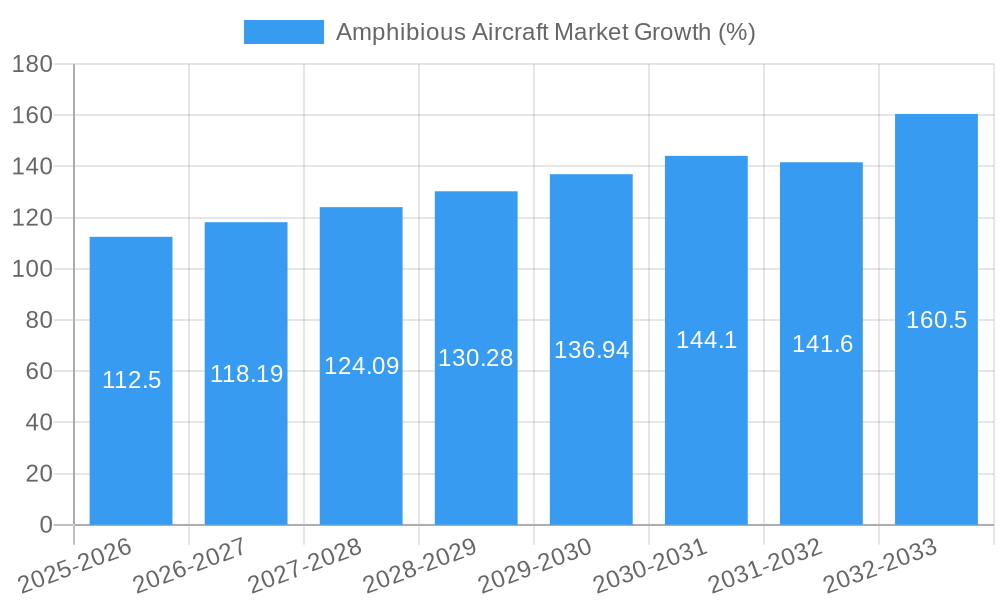
The amphibious aircraft market is experiencing steady growth, driven by rising demand across various sectors. The market size expanded from xx million units in 2019 to xx million units in 2024, registering a CAGR of xx%. This growth is fueled by increasing adoption rates in civilian applications, such as tourism, recreational activities, and search and rescue operations. Technological advancements, particularly in engine efficiency and avionics, are further driving market penetration. Consumer behavior shifts towards experiences and eco-conscious travel further contribute to positive growth outlook. The forecast period (2025-2033) projects a CAGR of xx%, with the market expected to reach xx million units by 2033. This growth will be fueled by increasing demand from emerging economies and technological innovations leading to enhanced efficiency and safety.
Dominant Regions, Countries, or Segments in Amphibious Aircraft Market
North America currently dominates the amphibious aircraft market, accounting for approximately xx% of the global market share in 2024, followed by Europe with xx%. This dominance is attributed to robust economic conditions, well-established aviation infrastructure, and a high concentration of both manufacturers and end-users. The civilian segment is the largest application area, holding xx% of the market share in 2024, driven by increasing tourism and recreational activities. The turboprop engine segment also leads, with xx% market share, due to its better performance and efficiency compared to piston engines.
- North America: Strong aviation infrastructure, high consumer demand, and presence of major manufacturers.
- Europe: Established aviation industry, significant tourism sector, and supportive government policies.
- Civilian Segment: Growth driven by tourism, recreational flying, and search and rescue operations.
- Turboprop Segment: Superior performance and fuel efficiency compared to piston engines.
- Asia-Pacific: Emerging market with significant growth potential driven by increasing infrastructure development and economic growth.
Amphibious Aircraft Market Product Landscape
The amphibious aircraft market showcases a range of products, from small, single-engine aircraft for recreational use to larger, multi-engine models for commercial and military applications. Recent innovations include improved materials (lighter, stronger composites) and advanced avionics for enhanced safety and performance. Unique selling propositions often focus on versatility, efficiency, and enhanced safety features. Technological advancements are continuously pushing the boundaries of operational efficiency, payload capacity, and environmental impact, with a clear trend towards hybrid and electric propulsion systems.
Key Drivers, Barriers & Challenges in Amphibious Aircraft Market
Key Drivers:
- Increasing demand from the tourism and recreational sectors.
- Growth in search and rescue operations.
- Technological advancements improving efficiency and safety.
- Government investments in aviation infrastructure.
Challenges & Restraints:
- High manufacturing and certification costs.
- Stringent safety regulations and certification requirements.
- Limited availability of specialized maintenance and repair services.
- Competition from alternative transportation modes.
Emerging Opportunities in Amphibious Aircraft Market
- Expansion into underserved regions and emerging markets.
- Development of specialized amphibious aircraft for specific applications (e.g., environmental monitoring, offshore operations).
- Growing demand for eco-friendly amphibious aircraft.
- Integration of advanced technologies (e.g., autonomous flight systems).
Growth Accelerators in the Amphibious Aircraft Market Industry
The long-term growth of the amphibious aircraft market will be accelerated by technological advancements in propulsion systems, materials science, and avionics. Strategic partnerships between manufacturers and operators will enhance market penetration. Furthermore, expansion into new applications and geographic markets, supported by supportive government policies, will fuel market expansion.
Key Players Shaping the Amphibious Aircraft Market Market
- MVP Aero
- ShinMaywa Industries Ltd
- Aviation Industry Corporation of China (AVIC)
- Viking Air Ltd
- FAULHABER MICROMO LLC
- Atol Avion
- Vickers Aircraft Company Limited
- LISA Airplanes
- United Aircraft Corporation
- Equator Aircraft AS
- Flywhale Aircraft GmbH & Co KG
- Aero Adventure LLC
- Seawings International
- ICON Aircraft Inc
Notable Milestones in Amphibious Aircraft Market Sector
- 2020: Introduction of a new hybrid-electric amphibious aircraft prototype by MVP Aero.
- 2022: Successful completion of flight tests for a new amphibious aircraft model by Viking Air.
- 2023: Acquisition of a smaller amphibious aircraft manufacturer by a major aerospace company. (Specific details not available - xx)
In-Depth Amphibious Aircraft Market Market Outlook
The amphibious aircraft market is poised for substantial growth over the forecast period, driven by a convergence of factors including technological advancements, increasing demand across various sectors, and expansion into new geographic markets. Strategic investments in research and development, alongside partnerships to leverage diverse expertise, will further strengthen the market's potential. The focus on sustainable aviation technologies will shape future product development and create new opportunities for market expansion.
Amphibious Aircraft Market Segmentation
- 1. Production Analysis
- 2. Consumption Analysis
- 3. Import Market Analysis (Value & Volume)
- 4. Export Market Analysis (Value & Volume)
- 5. Price Trend Analysis
Amphibious Aircraft Market Segmentation By Geography
-
1. North America
- 1.1. United States
- 1.2. Canada
- 1.3. Mexico
-
2. South America
- 2.1. Brazil
- 2.2. Argentina
- 2.3. Rest of South America
-
3. Europe
- 3.1. United Kingdom
- 3.2. Germany
- 3.3. France
- 3.4. Italy
- 3.5. Spain
- 3.6. Russia
- 3.7. Benelux
- 3.8. Nordics
- 3.9. Rest of Europe
-
4. Middle East & Africa
- 4.1. Turkey
- 4.2. Israel
- 4.3. GCC
- 4.4. North Africa
- 4.5. South Africa
- 4.6. Rest of Middle East & Africa
-
5. Asia Pacific
- 5.1. China
- 5.2. India
- 5.3. Japan
- 5.4. South Korea
- 5.5. ASEAN
- 5.6. Oceania
- 5.7. Rest of Asia Pacific
Amphibious Aircraft Market REPORT HIGHLIGHTS
| Aspects | Details |
|---|---|
| Study Period | 2019-2033 |
| Base Year | 2024 |
| Estimated Year | 2025 |
| Forecast Period | 2025-2033 |
| Historical Period | 2019-2024 |
| Growth Rate | CAGR of > 4.50% from 2019-2033 |
| Segmentation |
|
Table of Contents
- 1. Introduction
- 1.1. Research Scope
- 1.2. Market Segmentation
- 1.3. Research Methodology
- 1.4. Definitions and Assumptions
- 2. Executive Summary
- 2.1. Introduction
- 3. Market Dynamics
- 3.1. Introduction
- 3.2. Market Drivers
- 3.2.1. Increase in Internet of Things (IoT) and Autonomous Systems; Rise in Demand for Military and Defense Satellite Communication Solutions
- 3.3. Market Restrains
- 3.3.1. Cybersecurity Threats to Satellite Communication; Interference in Transmission of Data
- 3.4. Market Trends
- 3.4.1. Military Segment of the Market is Expected to Witness Decent Growth Rate During the Forecast Period
- 4. Market Factor Analysis
- 4.1. Porters Five Forces
- 4.2. Supply/Value Chain
- 4.3. PESTEL analysis
- 4.4. Market Entropy
- 4.5. Patent/Trademark Analysis
- 5. Global Amphibious Aircraft Market Analysis, Insights and Forecast, 2019-2031
- 5.1. Market Analysis, Insights and Forecast - by Production Analysis
- 5.2. Market Analysis, Insights and Forecast - by Consumption Analysis
- 5.3. Market Analysis, Insights and Forecast - by Import Market Analysis (Value & Volume)
- 5.4. Market Analysis, Insights and Forecast - by Export Market Analysis (Value & Volume)
- 5.5. Market Analysis, Insights and Forecast - by Price Trend Analysis
- 5.6. Market Analysis, Insights and Forecast - by Region
- 5.6.1. North America
- 5.6.2. South America
- 5.6.3. Europe
- 5.6.4. Middle East & Africa
- 5.6.5. Asia Pacific
- 5.1. Market Analysis, Insights and Forecast - by Production Analysis
- 6. North America Amphibious Aircraft Market Analysis, Insights and Forecast, 2019-2031
- 6.1. Market Analysis, Insights and Forecast - by Production Analysis
- 6.2. Market Analysis, Insights and Forecast - by Consumption Analysis
- 6.3. Market Analysis, Insights and Forecast - by Import Market Analysis (Value & Volume)
- 6.4. Market Analysis, Insights and Forecast - by Export Market Analysis (Value & Volume)
- 6.5. Market Analysis, Insights and Forecast - by Price Trend Analysis
- 6.1. Market Analysis, Insights and Forecast - by Production Analysis
- 7. South America Amphibious Aircraft Market Analysis, Insights and Forecast, 2019-2031
- 7.1. Market Analysis, Insights and Forecast - by Production Analysis
- 7.2. Market Analysis, Insights and Forecast - by Consumption Analysis
- 7.3. Market Analysis, Insights and Forecast - by Import Market Analysis (Value & Volume)
- 7.4. Market Analysis, Insights and Forecast - by Export Market Analysis (Value & Volume)
- 7.5. Market Analysis, Insights and Forecast - by Price Trend Analysis
- 7.1. Market Analysis, Insights and Forecast - by Production Analysis
- 8. Europe Amphibious Aircraft Market Analysis, Insights and Forecast, 2019-2031
- 8.1. Market Analysis, Insights and Forecast - by Production Analysis
- 8.2. Market Analysis, Insights and Forecast - by Consumption Analysis
- 8.3. Market Analysis, Insights and Forecast - by Import Market Analysis (Value & Volume)
- 8.4. Market Analysis, Insights and Forecast - by Export Market Analysis (Value & Volume)
- 8.5. Market Analysis, Insights and Forecast - by Price Trend Analysis
- 8.1. Market Analysis, Insights and Forecast - by Production Analysis
- 9. Middle East & Africa Amphibious Aircraft Market Analysis, Insights and Forecast, 2019-2031
- 9.1. Market Analysis, Insights and Forecast - by Production Analysis
- 9.2. Market Analysis, Insights and Forecast - by Consumption Analysis
- 9.3. Market Analysis, Insights and Forecast - by Import Market Analysis (Value & Volume)
- 9.4. Market Analysis, Insights and Forecast - by Export Market Analysis (Value & Volume)
- 9.5. Market Analysis, Insights and Forecast - by Price Trend Analysis
- 9.1. Market Analysis, Insights and Forecast - by Production Analysis
- 10. Asia Pacific Amphibious Aircraft Market Analysis, Insights and Forecast, 2019-2031
- 10.1. Market Analysis, Insights and Forecast - by Production Analysis
- 10.2. Market Analysis, Insights and Forecast - by Consumption Analysis
- 10.3. Market Analysis, Insights and Forecast - by Import Market Analysis (Value & Volume)
- 10.4. Market Analysis, Insights and Forecast - by Export Market Analysis (Value & Volume)
- 10.5. Market Analysis, Insights and Forecast - by Price Trend Analysis
- 10.1. Market Analysis, Insights and Forecast - by Production Analysis
- 11. North America Amphibious Aircraft Market Analysis, Insights and Forecast, 2019-2031
- 11.1. Market Analysis, Insights and Forecast - By Country/Sub-region
- 11.1.1 United States
- 11.1.2 Canada
- 12. Asia Pacific Amphibious Aircraft Market Analysis, Insights and Forecast, 2019-2031
- 12.1. Market Analysis, Insights and Forecast - By Country/Sub-region
- 12.1.1 China
- 12.1.2 Japan
- 12.1.3 India
- 12.1.4 Rest of Asia Pacific
- 13. Europe Amphibious Aircraft Market Analysis, Insights and Forecast, 2019-2031
- 13.1. Market Analysis, Insights and Forecast - By Country/Sub-region
- 13.1.1 United Kingdom
- 13.1.2 Germany
- 13.1.3 France
- 13.1.4 Rest of Europe
- 14. Latin America Amphibious Aircraft Market Analysis, Insights and Forecast, 2019-2031
- 14.1. Market Analysis, Insights and Forecast - By Country/Sub-region
- 14.1.1 Mexico
- 14.1.2 Brazil
- 14.1.3 Rest of Latin America
- 15. Middle East and Africa Amphibious Aircraft Market Analysis, Insights and Forecast, 2019-2031
- 15.1. Market Analysis, Insights and Forecast - By Country/Sub-region
- 15.1.1 United Arab Emirates
- 15.1.2 Saudi Arabia
- 15.1.3 Rest of Middle East and Africa
- 16. Competitive Analysis
- 16.1. Global Market Share Analysis 2024
- 16.2. Company Profiles
- 16.2.1 MVP Aero
- 16.2.1.1. Overview
- 16.2.1.2. Products
- 16.2.1.3. SWOT Analysis
- 16.2.1.4. Recent Developments
- 16.2.1.5. Financials (Based on Availability)
- 16.2.2 ShinMaywa Industries Ltd
- 16.2.2.1. Overview
- 16.2.2.2. Products
- 16.2.2.3. SWOT Analysis
- 16.2.2.4. Recent Developments
- 16.2.2.5. Financials (Based on Availability)
- 16.2.3 Aviation Industry Corporation of China (AVIC)
- 16.2.3.1. Overview
- 16.2.3.2. Products
- 16.2.3.3. SWOT Analysis
- 16.2.3.4. Recent Developments
- 16.2.3.5. Financials (Based on Availability)
- 16.2.4 Viking Air Ltd
- 16.2.4.1. Overview
- 16.2.4.2. Products
- 16.2.4.3. SWOT Analysis
- 16.2.4.4. Recent Developments
- 16.2.4.5. Financials (Based on Availability)
- 16.2.5 FAULHABER MICROMO LLC
- 16.2.5.1. Overview
- 16.2.5.2. Products
- 16.2.5.3. SWOT Analysis
- 16.2.5.4. Recent Developments
- 16.2.5.5. Financials (Based on Availability)
- 16.2.6 Atol Avion
- 16.2.6.1. Overview
- 16.2.6.2. Products
- 16.2.6.3. SWOT Analysis
- 16.2.6.4. Recent Developments
- 16.2.6.5. Financials (Based on Availability)
- 16.2.7 Vickers Aircraft Company Limited
- 16.2.7.1. Overview
- 16.2.7.2. Products
- 16.2.7.3. SWOT Analysis
- 16.2.7.4. Recent Developments
- 16.2.7.5. Financials (Based on Availability)
- 16.2.8 LISA Airplanes
- 16.2.8.1. Overview
- 16.2.8.2. Products
- 16.2.8.3. SWOT Analysis
- 16.2.8.4. Recent Developments
- 16.2.8.5. Financials (Based on Availability)
- 16.2.9 United Aircraft Corporation
- 16.2.9.1. Overview
- 16.2.9.2. Products
- 16.2.9.3. SWOT Analysis
- 16.2.9.4. Recent Developments
- 16.2.9.5. Financials (Based on Availability)
- 16.2.10 Equator Aircraft AS
- 16.2.10.1. Overview
- 16.2.10.2. Products
- 16.2.10.3. SWOT Analysis
- 16.2.10.4. Recent Developments
- 16.2.10.5. Financials (Based on Availability)
- 16.2.11 Flywhale Aircraft GmbH & Co KG
- 16.2.11.1. Overview
- 16.2.11.2. Products
- 16.2.11.3. SWOT Analysis
- 16.2.11.4. Recent Developments
- 16.2.11.5. Financials (Based on Availability)
- 16.2.12 Aero Adventure LLC
- 16.2.12.1. Overview
- 16.2.12.2. Products
- 16.2.12.3. SWOT Analysis
- 16.2.12.4. Recent Developments
- 16.2.12.5. Financials (Based on Availability)
- 16.2.13 Seawings International
- 16.2.13.1. Overview
- 16.2.13.2. Products
- 16.2.13.3. SWOT Analysis
- 16.2.13.4. Recent Developments
- 16.2.13.5. Financials (Based on Availability)
- 16.2.14 ICON Aircraft Inc
- 16.2.14.1. Overview
- 16.2.14.2. Products
- 16.2.14.3. SWOT Analysis
- 16.2.14.4. Recent Developments
- 16.2.14.5. Financials (Based on Availability)
- 16.2.1 MVP Aero
List of Figures
- Figure 1: Global Amphibious Aircraft Market Revenue Breakdown (Million, %) by Region 2024 & 2032
- Figure 2: North America Amphibious Aircraft Market Revenue (Million), by Country 2024 & 2032
- Figure 3: North America Amphibious Aircraft Market Revenue Share (%), by Country 2024 & 2032
- Figure 4: Asia Pacific Amphibious Aircraft Market Revenue (Million), by Country 2024 & 2032
- Figure 5: Asia Pacific Amphibious Aircraft Market Revenue Share (%), by Country 2024 & 2032
- Figure 6: Europe Amphibious Aircraft Market Revenue (Million), by Country 2024 & 2032
- Figure 7: Europe Amphibious Aircraft Market Revenue Share (%), by Country 2024 & 2032
- Figure 8: Latin America Amphibious Aircraft Market Revenue (Million), by Country 2024 & 2032
- Figure 9: Latin America Amphibious Aircraft Market Revenue Share (%), by Country 2024 & 2032
- Figure 10: Middle East and Africa Amphibious Aircraft Market Revenue (Million), by Country 2024 & 2032
- Figure 11: Middle East and Africa Amphibious Aircraft Market Revenue Share (%), by Country 2024 & 2032
- Figure 12: North America Amphibious Aircraft Market Revenue (Million), by Production Analysis 2024 & 2032
- Figure 13: North America Amphibious Aircraft Market Revenue Share (%), by Production Analysis 2024 & 2032
- Figure 14: North America Amphibious Aircraft Market Revenue (Million), by Consumption Analysis 2024 & 2032
- Figure 15: North America Amphibious Aircraft Market Revenue Share (%), by Consumption Analysis 2024 & 2032
- Figure 16: North America Amphibious Aircraft Market Revenue (Million), by Import Market Analysis (Value & Volume) 2024 & 2032
- Figure 17: North America Amphibious Aircraft Market Revenue Share (%), by Import Market Analysis (Value & Volume) 2024 & 2032
- Figure 18: North America Amphibious Aircraft Market Revenue (Million), by Export Market Analysis (Value & Volume) 2024 & 2032
- Figure 19: North America Amphibious Aircraft Market Revenue Share (%), by Export Market Analysis (Value & Volume) 2024 & 2032
- Figure 20: North America Amphibious Aircraft Market Revenue (Million), by Price Trend Analysis 2024 & 2032
- Figure 21: North America Amphibious Aircraft Market Revenue Share (%), by Price Trend Analysis 2024 & 2032
- Figure 22: North America Amphibious Aircraft Market Revenue (Million), by Country 2024 & 2032
- Figure 23: North America Amphibious Aircraft Market Revenue Share (%), by Country 2024 & 2032
- Figure 24: South America Amphibious Aircraft Market Revenue (Million), by Production Analysis 2024 & 2032
- Figure 25: South America Amphibious Aircraft Market Revenue Share (%), by Production Analysis 2024 & 2032
- Figure 26: South America Amphibious Aircraft Market Revenue (Million), by Consumption Analysis 2024 & 2032
- Figure 27: South America Amphibious Aircraft Market Revenue Share (%), by Consumption Analysis 2024 & 2032
- Figure 28: South America Amphibious Aircraft Market Revenue (Million), by Import Market Analysis (Value & Volume) 2024 & 2032
- Figure 29: South America Amphibious Aircraft Market Revenue Share (%), by Import Market Analysis (Value & Volume) 2024 & 2032
- Figure 30: South America Amphibious Aircraft Market Revenue (Million), by Export Market Analysis (Value & Volume) 2024 & 2032
- Figure 31: South America Amphibious Aircraft Market Revenue Share (%), by Export Market Analysis (Value & Volume) 2024 & 2032
- Figure 32: South America Amphibious Aircraft Market Revenue (Million), by Price Trend Analysis 2024 & 2032
- Figure 33: South America Amphibious Aircraft Market Revenue Share (%), by Price Trend Analysis 2024 & 2032
- Figure 34: South America Amphibious Aircraft Market Revenue (Million), by Country 2024 & 2032
- Figure 35: South America Amphibious Aircraft Market Revenue Share (%), by Country 2024 & 2032
- Figure 36: Europe Amphibious Aircraft Market Revenue (Million), by Production Analysis 2024 & 2032
- Figure 37: Europe Amphibious Aircraft Market Revenue Share (%), by Production Analysis 2024 & 2032
- Figure 38: Europe Amphibious Aircraft Market Revenue (Million), by Consumption Analysis 2024 & 2032
- Figure 39: Europe Amphibious Aircraft Market Revenue Share (%), by Consumption Analysis 2024 & 2032
- Figure 40: Europe Amphibious Aircraft Market Revenue (Million), by Import Market Analysis (Value & Volume) 2024 & 2032
- Figure 41: Europe Amphibious Aircraft Market Revenue Share (%), by Import Market Analysis (Value & Volume) 2024 & 2032
- Figure 42: Europe Amphibious Aircraft Market Revenue (Million), by Export Market Analysis (Value & Volume) 2024 & 2032
- Figure 43: Europe Amphibious Aircraft Market Revenue Share (%), by Export Market Analysis (Value & Volume) 2024 & 2032
- Figure 44: Europe Amphibious Aircraft Market Revenue (Million), by Price Trend Analysis 2024 & 2032
- Figure 45: Europe Amphibious Aircraft Market Revenue Share (%), by Price Trend Analysis 2024 & 2032
- Figure 46: Europe Amphibious Aircraft Market Revenue (Million), by Country 2024 & 2032
- Figure 47: Europe Amphibious Aircraft Market Revenue Share (%), by Country 2024 & 2032
- Figure 48: Middle East & Africa Amphibious Aircraft Market Revenue (Million), by Production Analysis 2024 & 2032
- Figure 49: Middle East & Africa Amphibious Aircraft Market Revenue Share (%), by Production Analysis 2024 & 2032
- Figure 50: Middle East & Africa Amphibious Aircraft Market Revenue (Million), by Consumption Analysis 2024 & 2032
- Figure 51: Middle East & Africa Amphibious Aircraft Market Revenue Share (%), by Consumption Analysis 2024 & 2032
- Figure 52: Middle East & Africa Amphibious Aircraft Market Revenue (Million), by Import Market Analysis (Value & Volume) 2024 & 2032
- Figure 53: Middle East & Africa Amphibious Aircraft Market Revenue Share (%), by Import Market Analysis (Value & Volume) 2024 & 2032
- Figure 54: Middle East & Africa Amphibious Aircraft Market Revenue (Million), by Export Market Analysis (Value & Volume) 2024 & 2032
- Figure 55: Middle East & Africa Amphibious Aircraft Market Revenue Share (%), by Export Market Analysis (Value & Volume) 2024 & 2032
- Figure 56: Middle East & Africa Amphibious Aircraft Market Revenue (Million), by Price Trend Analysis 2024 & 2032
- Figure 57: Middle East & Africa Amphibious Aircraft Market Revenue Share (%), by Price Trend Analysis 2024 & 2032
- Figure 58: Middle East & Africa Amphibious Aircraft Market Revenue (Million), by Country 2024 & 2032
- Figure 59: Middle East & Africa Amphibious Aircraft Market Revenue Share (%), by Country 2024 & 2032
- Figure 60: Asia Pacific Amphibious Aircraft Market Revenue (Million), by Production Analysis 2024 & 2032
- Figure 61: Asia Pacific Amphibious Aircraft Market Revenue Share (%), by Production Analysis 2024 & 2032
- Figure 62: Asia Pacific Amphibious Aircraft Market Revenue (Million), by Consumption Analysis 2024 & 2032
- Figure 63: Asia Pacific Amphibious Aircraft Market Revenue Share (%), by Consumption Analysis 2024 & 2032
- Figure 64: Asia Pacific Amphibious Aircraft Market Revenue (Million), by Import Market Analysis (Value & Volume) 2024 & 2032
- Figure 65: Asia Pacific Amphibious Aircraft Market Revenue Share (%), by Import Market Analysis (Value & Volume) 2024 & 2032
- Figure 66: Asia Pacific Amphibious Aircraft Market Revenue (Million), by Export Market Analysis (Value & Volume) 2024 & 2032
- Figure 67: Asia Pacific Amphibious Aircraft Market Revenue Share (%), by Export Market Analysis (Value & Volume) 2024 & 2032
- Figure 68: Asia Pacific Amphibious Aircraft Market Revenue (Million), by Price Trend Analysis 2024 & 2032
- Figure 69: Asia Pacific Amphibious Aircraft Market Revenue Share (%), by Price Trend Analysis 2024 & 2032
- Figure 70: Asia Pacific Amphibious Aircraft Market Revenue (Million), by Country 2024 & 2032
- Figure 71: Asia Pacific Amphibious Aircraft Market Revenue Share (%), by Country 2024 & 2032
List of Tables
- Table 1: Global Amphibious Aircraft Market Revenue Million Forecast, by Region 2019 & 2032
- Table 2: Global Amphibious Aircraft Market Revenue Million Forecast, by Production Analysis 2019 & 2032
- Table 3: Global Amphibious Aircraft Market Revenue Million Forecast, by Consumption Analysis 2019 & 2032
- Table 4: Global Amphibious Aircraft Market Revenue Million Forecast, by Import Market Analysis (Value & Volume) 2019 & 2032
- Table 5: Global Amphibious Aircraft Market Revenue Million Forecast, by Export Market Analysis (Value & Volume) 2019 & 2032
- Table 6: Global Amphibious Aircraft Market Revenue Million Forecast, by Price Trend Analysis 2019 & 2032
- Table 7: Global Amphibious Aircraft Market Revenue Million Forecast, by Region 2019 & 2032
- Table 8: Global Amphibious Aircraft Market Revenue Million Forecast, by Country 2019 & 2032
- Table 9: United States Amphibious Aircraft Market Revenue (Million) Forecast, by Application 2019 & 2032
- Table 10: Canada Amphibious Aircraft Market Revenue (Million) Forecast, by Application 2019 & 2032
- Table 11: Global Amphibious Aircraft Market Revenue Million Forecast, by Country 2019 & 2032
- Table 12: China Amphibious Aircraft Market Revenue (Million) Forecast, by Application 2019 & 2032
- Table 13: Japan Amphibious Aircraft Market Revenue (Million) Forecast, by Application 2019 & 2032
- Table 14: India Amphibious Aircraft Market Revenue (Million) Forecast, by Application 2019 & 2032
- Table 15: Rest of Asia Pacific Amphibious Aircraft Market Revenue (Million) Forecast, by Application 2019 & 2032
- Table 16: Global Amphibious Aircraft Market Revenue Million Forecast, by Country 2019 & 2032
- Table 17: United Kingdom Amphibious Aircraft Market Revenue (Million) Forecast, by Application 2019 & 2032
- Table 18: Germany Amphibious Aircraft Market Revenue (Million) Forecast, by Application 2019 & 2032
- Table 19: France Amphibious Aircraft Market Revenue (Million) Forecast, by Application 2019 & 2032
- Table 20: Rest of Europe Amphibious Aircraft Market Revenue (Million) Forecast, by Application 2019 & 2032
- Table 21: Global Amphibious Aircraft Market Revenue Million Forecast, by Country 2019 & 2032
- Table 22: Mexico Amphibious Aircraft Market Revenue (Million) Forecast, by Application 2019 & 2032
- Table 23: Brazil Amphibious Aircraft Market Revenue (Million) Forecast, by Application 2019 & 2032
- Table 24: Rest of Latin America Amphibious Aircraft Market Revenue (Million) Forecast, by Application 2019 & 2032
- Table 25: Global Amphibious Aircraft Market Revenue Million Forecast, by Country 2019 & 2032
- Table 26: United Arab Emirates Amphibious Aircraft Market Revenue (Million) Forecast, by Application 2019 & 2032
- Table 27: Saudi Arabia Amphibious Aircraft Market Revenue (Million) Forecast, by Application 2019 & 2032
- Table 28: Rest of Middle East and Africa Amphibious Aircraft Market Revenue (Million) Forecast, by Application 2019 & 2032
- Table 29: Global Amphibious Aircraft Market Revenue Million Forecast, by Production Analysis 2019 & 2032
- Table 30: Global Amphibious Aircraft Market Revenue Million Forecast, by Consumption Analysis 2019 & 2032
- Table 31: Global Amphibious Aircraft Market Revenue Million Forecast, by Import Market Analysis (Value & Volume) 2019 & 2032
- Table 32: Global Amphibious Aircraft Market Revenue Million Forecast, by Export Market Analysis (Value & Volume) 2019 & 2032
- Table 33: Global Amphibious Aircraft Market Revenue Million Forecast, by Price Trend Analysis 2019 & 2032
- Table 34: Global Amphibious Aircraft Market Revenue Million Forecast, by Country 2019 & 2032
- Table 35: United States Amphibious Aircraft Market Revenue (Million) Forecast, by Application 2019 & 2032
- Table 36: Canada Amphibious Aircraft Market Revenue (Million) Forecast, by Application 2019 & 2032
- Table 37: Mexico Amphibious Aircraft Market Revenue (Million) Forecast, by Application 2019 & 2032
- Table 38: Global Amphibious Aircraft Market Revenue Million Forecast, by Production Analysis 2019 & 2032
- Table 39: Global Amphibious Aircraft Market Revenue Million Forecast, by Consumption Analysis 2019 & 2032
- Table 40: Global Amphibious Aircraft Market Revenue Million Forecast, by Import Market Analysis (Value & Volume) 2019 & 2032
- Table 41: Global Amphibious Aircraft Market Revenue Million Forecast, by Export Market Analysis (Value & Volume) 2019 & 2032
- Table 42: Global Amphibious Aircraft Market Revenue Million Forecast, by Price Trend Analysis 2019 & 2032
- Table 43: Global Amphibious Aircraft Market Revenue Million Forecast, by Country 2019 & 2032
- Table 44: Brazil Amphibious Aircraft Market Revenue (Million) Forecast, by Application 2019 & 2032
- Table 45: Argentina Amphibious Aircraft Market Revenue (Million) Forecast, by Application 2019 & 2032
- Table 46: Rest of South America Amphibious Aircraft Market Revenue (Million) Forecast, by Application 2019 & 2032
- Table 47: Global Amphibious Aircraft Market Revenue Million Forecast, by Production Analysis 2019 & 2032
- Table 48: Global Amphibious Aircraft Market Revenue Million Forecast, by Consumption Analysis 2019 & 2032
- Table 49: Global Amphibious Aircraft Market Revenue Million Forecast, by Import Market Analysis (Value & Volume) 2019 & 2032
- Table 50: Global Amphibious Aircraft Market Revenue Million Forecast, by Export Market Analysis (Value & Volume) 2019 & 2032
- Table 51: Global Amphibious Aircraft Market Revenue Million Forecast, by Price Trend Analysis 2019 & 2032
- Table 52: Global Amphibious Aircraft Market Revenue Million Forecast, by Country 2019 & 2032
- Table 53: United Kingdom Amphibious Aircraft Market Revenue (Million) Forecast, by Application 2019 & 2032
- Table 54: Germany Amphibious Aircraft Market Revenue (Million) Forecast, by Application 2019 & 2032
- Table 55: France Amphibious Aircraft Market Revenue (Million) Forecast, by Application 2019 & 2032
- Table 56: Italy Amphibious Aircraft Market Revenue (Million) Forecast, by Application 2019 & 2032
- Table 57: Spain Amphibious Aircraft Market Revenue (Million) Forecast, by Application 2019 & 2032
- Table 58: Russia Amphibious Aircraft Market Revenue (Million) Forecast, by Application 2019 & 2032
- Table 59: Benelux Amphibious Aircraft Market Revenue (Million) Forecast, by Application 2019 & 2032
- Table 60: Nordics Amphibious Aircraft Market Revenue (Million) Forecast, by Application 2019 & 2032
- Table 61: Rest of Europe Amphibious Aircraft Market Revenue (Million) Forecast, by Application 2019 & 2032
- Table 62: Global Amphibious Aircraft Market Revenue Million Forecast, by Production Analysis 2019 & 2032
- Table 63: Global Amphibious Aircraft Market Revenue Million Forecast, by Consumption Analysis 2019 & 2032
- Table 64: Global Amphibious Aircraft Market Revenue Million Forecast, by Import Market Analysis (Value & Volume) 2019 & 2032
- Table 65: Global Amphibious Aircraft Market Revenue Million Forecast, by Export Market Analysis (Value & Volume) 2019 & 2032
- Table 66: Global Amphibious Aircraft Market Revenue Million Forecast, by Price Trend Analysis 2019 & 2032
- Table 67: Global Amphibious Aircraft Market Revenue Million Forecast, by Country 2019 & 2032
- Table 68: Turkey Amphibious Aircraft Market Revenue (Million) Forecast, by Application 2019 & 2032
- Table 69: Israel Amphibious Aircraft Market Revenue (Million) Forecast, by Application 2019 & 2032
- Table 70: GCC Amphibious Aircraft Market Revenue (Million) Forecast, by Application 2019 & 2032
- Table 71: North Africa Amphibious Aircraft Market Revenue (Million) Forecast, by Application 2019 & 2032
- Table 72: South Africa Amphibious Aircraft Market Revenue (Million) Forecast, by Application 2019 & 2032
- Table 73: Rest of Middle East & Africa Amphibious Aircraft Market Revenue (Million) Forecast, by Application 2019 & 2032
- Table 74: Global Amphibious Aircraft Market Revenue Million Forecast, by Production Analysis 2019 & 2032
- Table 75: Global Amphibious Aircraft Market Revenue Million Forecast, by Consumption Analysis 2019 & 2032
- Table 76: Global Amphibious Aircraft Market Revenue Million Forecast, by Import Market Analysis (Value & Volume) 2019 & 2032
- Table 77: Global Amphibious Aircraft Market Revenue Million Forecast, by Export Market Analysis (Value & Volume) 2019 & 2032
- Table 78: Global Amphibious Aircraft Market Revenue Million Forecast, by Price Trend Analysis 2019 & 2032
- Table 79: Global Amphibious Aircraft Market Revenue Million Forecast, by Country 2019 & 2032
- Table 80: China Amphibious Aircraft Market Revenue (Million) Forecast, by Application 2019 & 2032
- Table 81: India Amphibious Aircraft Market Revenue (Million) Forecast, by Application 2019 & 2032
- Table 82: Japan Amphibious Aircraft Market Revenue (Million) Forecast, by Application 2019 & 2032
- Table 83: South Korea Amphibious Aircraft Market Revenue (Million) Forecast, by Application 2019 & 2032
- Table 84: ASEAN Amphibious Aircraft Market Revenue (Million) Forecast, by Application 2019 & 2032
- Table 85: Oceania Amphibious Aircraft Market Revenue (Million) Forecast, by Application 2019 & 2032
- Table 86: Rest of Asia Pacific Amphibious Aircraft Market Revenue (Million) Forecast, by Application 2019 & 2032
Frequently Asked Questions
1. What is the projected Compound Annual Growth Rate (CAGR) of the Amphibious Aircraft Market?
The projected CAGR is approximately > 4.50%.
2. Which companies are prominent players in the Amphibious Aircraft Market?
Key companies in the market include MVP Aero, ShinMaywa Industries Ltd, Aviation Industry Corporation of China (AVIC), Viking Air Ltd, FAULHABER MICROMO LLC, Atol Avion, Vickers Aircraft Company Limited, LISA Airplanes, United Aircraft Corporation, Equator Aircraft AS, Flywhale Aircraft GmbH & Co KG, Aero Adventure LLC, Seawings International, ICON Aircraft Inc.
3. What are the main segments of the Amphibious Aircraft Market?
The market segments include Production Analysis, Consumption Analysis, Import Market Analysis (Value & Volume), Export Market Analysis (Value & Volume), Price Trend Analysis.
4. Can you provide details about the market size?
The market size is estimated to be USD XX Million as of 2022.
5. What are some drivers contributing to market growth?
Increase in Internet of Things (IoT) and Autonomous Systems; Rise in Demand for Military and Defense Satellite Communication Solutions.
6. What are the notable trends driving market growth?
Military Segment of the Market is Expected to Witness Decent Growth Rate During the Forecast Period.
7. Are there any restraints impacting market growth?
Cybersecurity Threats to Satellite Communication; Interference in Transmission of Data.
8. Can you provide examples of recent developments in the market?
N/A
9. What pricing options are available for accessing the report?
Pricing options include single-user, multi-user, and enterprise licenses priced at USD 4750, USD 5250, and USD 8750 respectively.
10. Is the market size provided in terms of value or volume?
The market size is provided in terms of value, measured in Million.
11. Are there any specific market keywords associated with the report?
Yes, the market keyword associated with the report is "Amphibious Aircraft Market," which aids in identifying and referencing the specific market segment covered.
12. How do I determine which pricing option suits my needs best?
The pricing options vary based on user requirements and access needs. Individual users may opt for single-user licenses, while businesses requiring broader access may choose multi-user or enterprise licenses for cost-effective access to the report.
13. Are there any additional resources or data provided in the Amphibious Aircraft Market report?
While the report offers comprehensive insights, it's advisable to review the specific contents or supplementary materials provided to ascertain if additional resources or data are available.
14. How can I stay updated on further developments or reports in the Amphibious Aircraft Market?
To stay informed about further developments, trends, and reports in the Amphibious Aircraft Market, consider subscribing to industry newsletters, following relevant companies and organizations, or regularly checking reputable industry news sources and publications.
Methodology
Step 1 - Identification of Relevant Samples Size from Population Database


Step 2 - Approaches for Defining Global Market Size (Value, Volume* & Price*)

Note*: In applicable scenarios
Step 3 - Data Sources
Primary Research
- Web Analytics
- Survey Reports
- Research Institute
- Latest Research Reports
- Opinion Leaders
Secondary Research
- Annual Reports
- White Paper
- Latest Press Release
- Industry Association
- Paid Database
- Investor Presentations

Step 4 - Data Triangulation
Involves using different sources of information in order to increase the validity of a study
These sources are likely to be stakeholders in a program - participants, other researchers, program staff, other community members, and so on.
Then we put all data in single framework & apply various statistical tools to find out the dynamic on the market.
During the analysis stage, feedback from the stakeholder groups would be compared to determine areas of agreement as well as areas of divergence
