

Key Insights
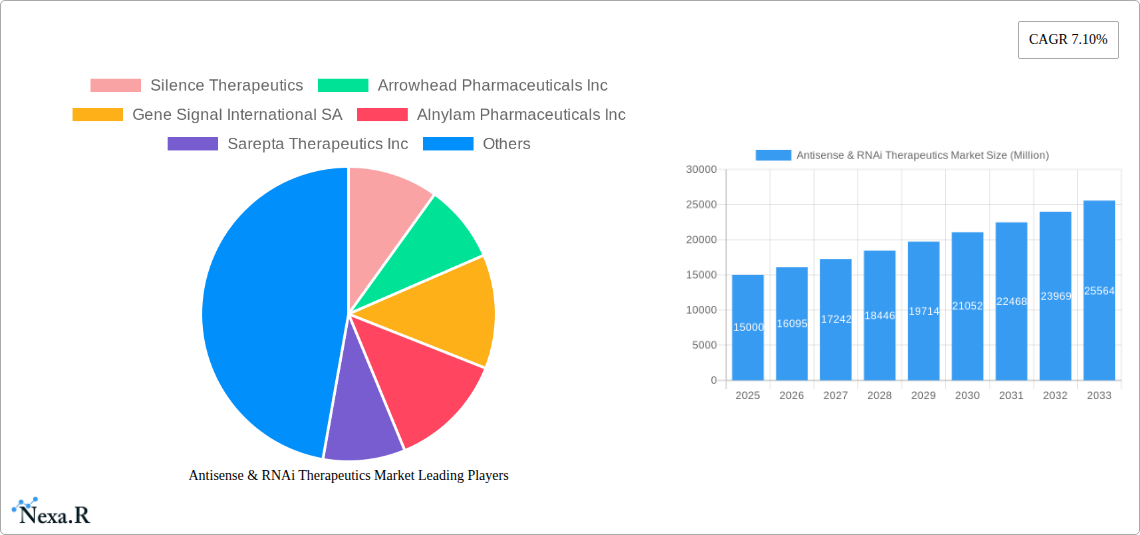
The Antisense & RNAi Therapeutics market is experiencing robust growth, projected to reach a substantial size by 2033, driven by a 7.10% CAGR from 2025. This expansion is fueled by several key factors. Firstly, the increasing prevalence of genetic disorders like autosomal recessive and dominant diseases, and chromosomal abnormalities creates a significant unmet medical need. Secondly, advancements in RNA interference (RNAi) and antisense technologies are leading to the development of more effective and targeted therapies. The diverse range of administration routes, including intravenous, subcutaneous, intrathecal, pulmonary delivery, and intraperitoneal injection, provides flexibility in treatment approaches, further contributing to market growth. The robust pipeline of innovative therapies from key players like Alnylam Pharmaceuticals, Ionis Pharmaceuticals, and others fuels optimism for the future. However, challenges remain, including the high cost of development and manufacturing, potential off-target effects, and complexities associated with delivery mechanisms.
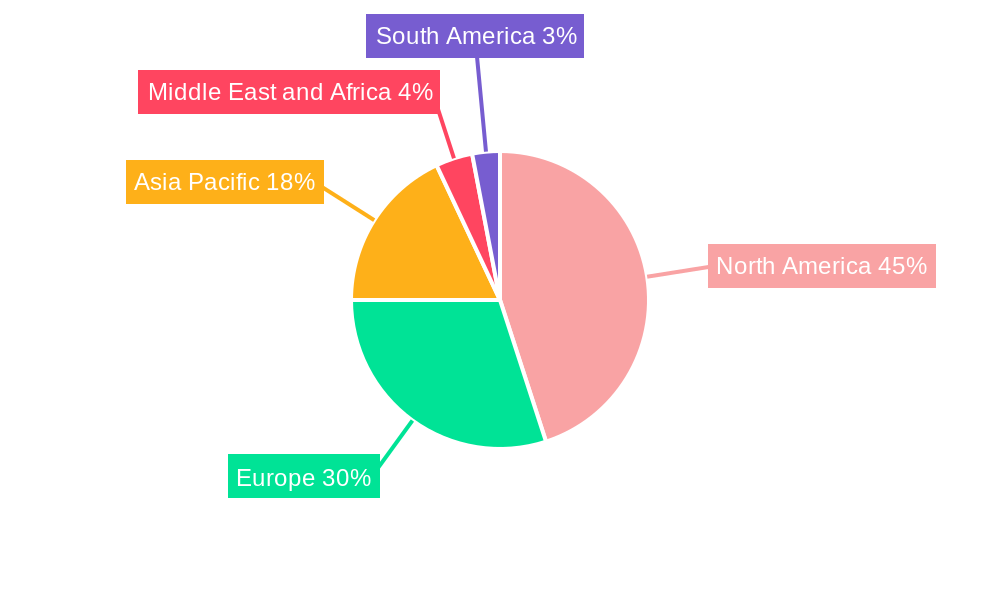
Despite these challenges, the market is poised for significant expansion. The therapeutic segments, particularly RNA interference and antisense technologies, are experiencing substantial investment and research activity. The geographical distribution of the market is broad, with North America and Europe currently holding significant shares due to advanced healthcare infrastructure and robust regulatory frameworks. However, Asia Pacific is anticipated to demonstrate strong growth potential in the coming years due to rising healthcare spending and increasing awareness of genetic disorders. Competitive landscape is characterized by both established pharmaceutical giants and specialized biotech companies focusing on RNAi and antisense therapies, leading to a dynamic environment characterized by collaborations, mergers, and acquisitions. The ongoing development of novel therapies, coupled with favorable regulatory landscapes in several regions, strongly indicates the continued ascent of this market throughout the forecast period.
Antisense & RNAi Therapeutics Market: A Comprehensive Report (2019-2033)
This comprehensive report provides an in-depth analysis of the Antisense & RNAi Therapeutics market, encompassing market dynamics, growth trends, regional segmentation, product landscape, key players, and future outlook. The study period covers 2019-2033, with 2025 as the base and estimated year. This report is invaluable for industry professionals, investors, and researchers seeking to understand and capitalize on the opportunities within this rapidly evolving sector. The parent market is the broader Pharmaceutical Market, while the child market focuses specifically on Antisense and RNAi therapies. The market size in 2025 is estimated at xx Million.
Antisense & RNAi Therapeutics Market Dynamics & Structure
The Antisense & RNAi Therapeutics market is characterized by a moderately concentrated landscape, with key players like Alnylam Pharmaceuticals and Ionis Pharmaceuticals holding significant market share. Technological innovation, particularly in delivery systems and target specificity, is a major growth driver. Stringent regulatory frameworks and the need for extensive clinical trials present challenges, however. The market experiences continuous M&A activity, reflecting the strategic importance of this therapeutic modality. Substitute therapies, such as traditional small molecule drugs, also impact market growth. End-user demographics are largely defined by patients suffering from genetic disorders, with an expanding range of indications driving market growth.
- Market Concentration: Moderately concentrated, with top 5 players holding approximately xx% market share in 2025.
- Technological Innovation: Focus on improving delivery methods (e.g., lipid nanoparticles, targeted conjugates) and expanding therapeutic applications.
- Regulatory Framework: Stringent approval processes necessitate significant investment in clinical trials and regulatory submissions.
- Competitive Substitutes: Traditional small molecule drugs and other emerging therapeutic modalities pose competitive pressure.
- End-User Demographics: Primarily patients with genetic disorders, expanding to other therapeutic areas.
- M&A Trends: High levels of merger and acquisition activity, with xx major deals recorded between 2019 and 2024.
Antisense & RNAi Therapeutics Market Growth Trends & Insights
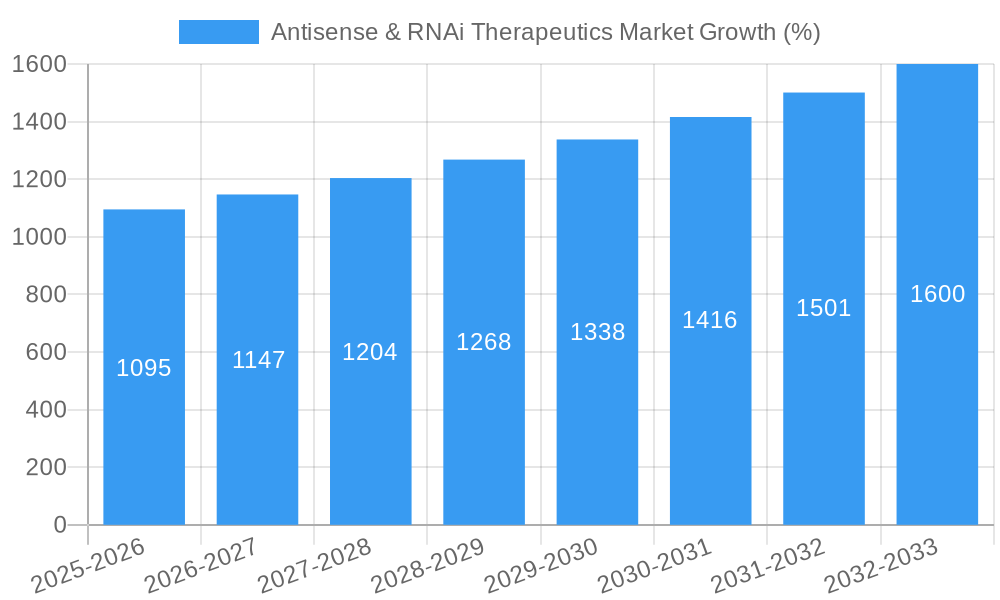
The Antisense & RNAi Therapeutics market has witnessed robust growth in recent years, driven by increasing prevalence of genetic disorders, technological advancements, and successful clinical trial outcomes. The market is projected to exhibit a CAGR of xx% from 2025 to 2033, reaching a market value of xx Million by 2033. Increased adoption rates, fueled by improved efficacy and safety profiles, contribute significantly to market expansion. Technological disruptions, including the development of novel delivery systems and improved target identification, further enhance market growth potential. Consumer behavior shifts towards personalized medicine are also influencing market dynamics. Market penetration remains relatively low, presenting substantial room for future growth.
Dominant Regions, Countries, or Segments in Antisense & RNAi Therapeutics Market
North America currently dominates the Antisense & RNAi Therapeutics market, driven by robust research infrastructure, high healthcare expenditure, and early adoption of novel therapies. However, the European and Asia-Pacific markets are showing promising growth potential. Within therapeutic segments, RNA interference (RNAi) currently holds a larger market share compared to antisense therapies, but both segments are anticipated to experience significant growth. Intravenous route of administration currently dominates, although subcutaneous and other delivery methods are gaining traction. Autosomal recessive diseases are a key indication, with ongoing research expanding applications to other genetic disorders.
- Leading Region: North America (xx% market share in 2025)
- Key Growth Drivers:
- Strong R&D infrastructure and funding in North America.
- Growing prevalence of genetic disorders globally.
- Favorable regulatory environment in certain regions.
- Increasing healthcare expenditure.
- Dominant Segments: RNAi therapeutics (xx% market share in 2025) and intravenous administration (xx% market share in 2025). Autosomal recessive diseases represent a significant portion of the indication market.
Antisense & RNAi Therapeutics Market Product Landscape
The Antisense & RNAi therapeutics market showcases continuous product innovation, focusing on improved efficacy, safety, and delivery mechanisms. This includes advancements in siRNA and antisense oligonucleotide design, development of targeted delivery systems (e.g., lipid nanoparticles, conjugates), and expansion into new therapeutic areas beyond genetic diseases. Products are differentiated based on target specificity, delivery method, and therapeutic index. Technological advancements are enabling the development of more potent and safer therapeutics, leading to enhanced clinical outcomes.
Key Drivers, Barriers & Challenges in Antisense & RNAi Therapeutics Market
Key Drivers:
- Technological advancements, particularly in delivery systems and target identification.
- Growing prevalence of genetic disorders with unmet medical needs.
- Increased investment in R&D and clinical trials.
- Favorable regulatory environment in certain regions.
Challenges:
- High cost of development and manufacturing.
- Stringent regulatory requirements and lengthy approval processes.
- Potential off-target effects and toxicity.
- Competition from alternative therapeutic modalities.
- xx% of clinical trials fail to meet their primary endpoints, leading to significant financial losses for developers.
Emerging Opportunities in Antisense & RNAi Therapeutics Market
Emerging opportunities include expansion into new therapeutic areas such as oncology, infectious diseases, and cardiovascular diseases. The development of novel delivery methods to overcome tissue-specific barriers and enhance therapeutic efficacy provides substantial growth potential. Personalized medicine approaches, leveraging genetic information to tailor therapies to individual patients, also present significant opportunities. Furthermore, exploration of combination therapies with other modalities can enhance therapeutic outcomes.
Growth Accelerators in the Antisense & RNAi Therapeutics Market Industry
Long-term growth in the Antisense & RNAi Therapeutics market will be propelled by significant technological breakthroughs, including improvements in delivery systems and target specificity. Strategic partnerships between pharmaceutical companies and biotech firms will accelerate product development and market penetration. Expansion into new therapeutic areas and geographical markets will further fuel market growth. The increasing availability of sophisticated diagnostic tools will aid in early disease detection and facilitate better patient selection for targeted therapies.
Key Players Shaping the Antisense & RNAi Therapeutics Market Market
- Silence Therapeutics
- Arrowhead Pharmaceuticals Inc
- Gene Signal International SA
- Alnylam Pharmaceuticals Inc
- Sarepta Therapeutics Inc
- Isarna Therapeutics GmbH
- Biogen Inc
- Arbutus Biopharma (Formerly Called Tekmira Pharmaceuticals)
- Benitec Biopharma Ltd
- Ionis Pharmaceuticals (Akcea Therapeutics Inc)
Notable Milestones in Antisense & RNAi Therapeutics Market Sector
- December 2021: Novartis AG receives FDA approval for Leqvio (inclisiran), an siRNA therapy for lowering LDL cholesterol.
- December 2021: AstraZeneca plc and Ionis Pharmaceuticals enter a global development and commercialization agreement for eplontersen, an antisense investigational medicine for ATTR-CM and ATTR-PN.
- July 2021: Alnylam Pharmaceuticals and PeptiDream Inc. sign a licensing and collaboration agreement to develop peptide-siRNA conjugates for extra-hepatic delivery of RNAi therapeutics.
In-Depth Antisense & RNAi Therapeutics Market Market Outlook
The future of the Antisense & RNAi Therapeutics market is bright, driven by a confluence of factors including continuous technological innovation, increasing market penetration, and expansion into new therapeutic areas. Strategic partnerships and collaborations are expected to accelerate drug development and commercialization efforts. The market presents significant opportunities for companies with innovative technologies and a strong focus on clinical development. Further research and development in improving delivery systems and enhancing target specificity will unlock the full potential of this promising therapeutic class.
Antisense & RNAi Therapeutics Market Segmentation
-
1. Therapeutics
- 1.1. RNA Interference
- 1.2. RNA Antisense
-
2. Route of Administration
- 2.1. Intravenous Route
- 2.2. Subcutaneous Route
- 2.3. Intrathecal Route
- 2.4. Pulmonary Delivery
- 2.5. Intraperitoneal Injection
- 2.6. Others
-
3. Indication
- 3.1. Autosomal Recessive Disease
- 3.2. Autosomal Dominant Disease
- 3.3. Chromosomal Disease
- 3.4. Others
Antisense & RNAi Therapeutics Market Segmentation By Geography
-
1. North America
- 1.1. United States
- 1.2. Canada
- 1.3. Mexico
-
2. Europe
- 2.1. Germany
- 2.2. United Kingdom
- 2.3. France
- 2.4. Italy
- 2.5. Spain
- 2.6. Rest of Europe
-
3. Asia Pacific
- 3.1. China
- 3.2. Japan
- 3.3. India
- 3.4. Australia
- 3.5. South Korea
- 3.6. Rest of Asia Pacific
-
4. Middle East and Africa
- 4.1. GCC
- 4.2. South Africa
- 4.3. Rest of Middle East and Africa
-
5. South America
- 5.1. Brazil
- 5.2. Argentina
- 5.3. Rest of South America
Antisense & RNAi Therapeutics Market REPORT HIGHLIGHTS
| Aspects | Details |
|---|---|
| Study Period | 2019-2033 |
| Base Year | 2024 |
| Estimated Year | 2025 |
| Forecast Period | 2025-2033 |
| Historical Period | 2019-2024 |
| Growth Rate | CAGR of 7.10% from 2019-2033 |
| Segmentation |
|
Table of Contents
- 1. Introduction
- 1.1. Research Scope
- 1.2. Market Segmentation
- 1.3. Research Methodology
- 1.4. Definitions and Assumptions
- 2. Executive Summary
- 2.1. Introduction
- 3. Market Dynamics
- 3.1. Introduction
- 3.2. Market Drivers
- 3.2.1. Better Therapeutic Outcomes for Rare Disease Due to Effective Gene Slicing Technology; Surge in R&D funding Coupled with Presence of Promising Pipeline Products
- 3.3. Market Restrains
- 3.3.1. High Cost of Therapeutics
- 3.4. Market Trends
- 3.4.1. RNA Antisense is Expected to Witness High Growth Over the Forecast Period
- 4. Market Factor Analysis
- 4.1. Porters Five Forces
- 4.2. Supply/Value Chain
- 4.3. PESTEL analysis
- 4.4. Market Entropy
- 4.5. Patent/Trademark Analysis
- 5. Global Antisense & RNAi Therapeutics Market Analysis, Insights and Forecast, 2019-2031
- 5.1. Market Analysis, Insights and Forecast - by Therapeutics
- 5.1.1. RNA Interference
- 5.1.2. RNA Antisense
- 5.2. Market Analysis, Insights and Forecast - by Route of Administration
- 5.2.1. Intravenous Route
- 5.2.2. Subcutaneous Route
- 5.2.3. Intrathecal Route
- 5.2.4. Pulmonary Delivery
- 5.2.5. Intraperitoneal Injection
- 5.2.6. Others
- 5.3. Market Analysis, Insights and Forecast - by Indication
- 5.3.1. Autosomal Recessive Disease
- 5.3.2. Autosomal Dominant Disease
- 5.3.3. Chromosomal Disease
- 5.3.4. Others
- 5.4. Market Analysis, Insights and Forecast - by Region
- 5.4.1. North America
- 5.4.2. Europe
- 5.4.3. Asia Pacific
- 5.4.4. Middle East and Africa
- 5.4.5. South America
- 5.1. Market Analysis, Insights and Forecast - by Therapeutics
- 6. North America Antisense & RNAi Therapeutics Market Analysis, Insights and Forecast, 2019-2031
- 6.1. Market Analysis, Insights and Forecast - by Therapeutics
- 6.1.1. RNA Interference
- 6.1.2. RNA Antisense
- 6.2. Market Analysis, Insights and Forecast - by Route of Administration
- 6.2.1. Intravenous Route
- 6.2.2. Subcutaneous Route
- 6.2.3. Intrathecal Route
- 6.2.4. Pulmonary Delivery
- 6.2.5. Intraperitoneal Injection
- 6.2.6. Others
- 6.3. Market Analysis, Insights and Forecast - by Indication
- 6.3.1. Autosomal Recessive Disease
- 6.3.2. Autosomal Dominant Disease
- 6.3.3. Chromosomal Disease
- 6.3.4. Others
- 6.1. Market Analysis, Insights and Forecast - by Therapeutics
- 7. Europe Antisense & RNAi Therapeutics Market Analysis, Insights and Forecast, 2019-2031
- 7.1. Market Analysis, Insights and Forecast - by Therapeutics
- 7.1.1. RNA Interference
- 7.1.2. RNA Antisense
- 7.2. Market Analysis, Insights and Forecast - by Route of Administration
- 7.2.1. Intravenous Route
- 7.2.2. Subcutaneous Route
- 7.2.3. Intrathecal Route
- 7.2.4. Pulmonary Delivery
- 7.2.5. Intraperitoneal Injection
- 7.2.6. Others
- 7.3. Market Analysis, Insights and Forecast - by Indication
- 7.3.1. Autosomal Recessive Disease
- 7.3.2. Autosomal Dominant Disease
- 7.3.3. Chromosomal Disease
- 7.3.4. Others
- 7.1. Market Analysis, Insights and Forecast - by Therapeutics
- 8. Asia Pacific Antisense & RNAi Therapeutics Market Analysis, Insights and Forecast, 2019-2031
- 8.1. Market Analysis, Insights and Forecast - by Therapeutics
- 8.1.1. RNA Interference
- 8.1.2. RNA Antisense
- 8.2. Market Analysis, Insights and Forecast - by Route of Administration
- 8.2.1. Intravenous Route
- 8.2.2. Subcutaneous Route
- 8.2.3. Intrathecal Route
- 8.2.4. Pulmonary Delivery
- 8.2.5. Intraperitoneal Injection
- 8.2.6. Others
- 8.3. Market Analysis, Insights and Forecast - by Indication
- 8.3.1. Autosomal Recessive Disease
- 8.3.2. Autosomal Dominant Disease
- 8.3.3. Chromosomal Disease
- 8.3.4. Others
- 8.1. Market Analysis, Insights and Forecast - by Therapeutics
- 9. Middle East and Africa Antisense & RNAi Therapeutics Market Analysis, Insights and Forecast, 2019-2031
- 9.1. Market Analysis, Insights and Forecast - by Therapeutics
- 9.1.1. RNA Interference
- 9.1.2. RNA Antisense
- 9.2. Market Analysis, Insights and Forecast - by Route of Administration
- 9.2.1. Intravenous Route
- 9.2.2. Subcutaneous Route
- 9.2.3. Intrathecal Route
- 9.2.4. Pulmonary Delivery
- 9.2.5. Intraperitoneal Injection
- 9.2.6. Others
- 9.3. Market Analysis, Insights and Forecast - by Indication
- 9.3.1. Autosomal Recessive Disease
- 9.3.2. Autosomal Dominant Disease
- 9.3.3. Chromosomal Disease
- 9.3.4. Others
- 9.1. Market Analysis, Insights and Forecast - by Therapeutics
- 10. South America Antisense & RNAi Therapeutics Market Analysis, Insights and Forecast, 2019-2031
- 10.1. Market Analysis, Insights and Forecast - by Therapeutics
- 10.1.1. RNA Interference
- 10.1.2. RNA Antisense
- 10.2. Market Analysis, Insights and Forecast - by Route of Administration
- 10.2.1. Intravenous Route
- 10.2.2. Subcutaneous Route
- 10.2.3. Intrathecal Route
- 10.2.4. Pulmonary Delivery
- 10.2.5. Intraperitoneal Injection
- 10.2.6. Others
- 10.3. Market Analysis, Insights and Forecast - by Indication
- 10.3.1. Autosomal Recessive Disease
- 10.3.2. Autosomal Dominant Disease
- 10.3.3. Chromosomal Disease
- 10.3.4. Others
- 10.1. Market Analysis, Insights and Forecast - by Therapeutics
- 11. North America Antisense & RNAi Therapeutics Market Analysis, Insights and Forecast, 2019-2031
- 11.1. Market Analysis, Insights and Forecast - By Country/Sub-region
- 11.1.1 United States
- 11.1.2 Canada
- 11.1.3 Mexico
- 12. Europe Antisense & RNAi Therapeutics Market Analysis, Insights and Forecast, 2019-2031
- 12.1. Market Analysis, Insights and Forecast - By Country/Sub-region
- 12.1.1 Germany
- 12.1.2 United Kingdom
- 12.1.3 France
- 12.1.4 Italy
- 12.1.5 Spain
- 12.1.6 Rest of Europe
- 13. Asia Pacific Antisense & RNAi Therapeutics Market Analysis, Insights and Forecast, 2019-2031
- 13.1. Market Analysis, Insights and Forecast - By Country/Sub-region
- 13.1.1 China
- 13.1.2 Japan
- 13.1.3 India
- 13.1.4 Australia
- 13.1.5 South Korea
- 13.1.6 Rest of Asia Pacific
- 14. Middle East and Africa Antisense & RNAi Therapeutics Market Analysis, Insights and Forecast, 2019-2031
- 14.1. Market Analysis, Insights and Forecast - By Country/Sub-region
- 14.1.1 GCC
- 14.1.2 South Africa
- 14.1.3 Rest of Middle East and Africa
- 15. South America Antisense & RNAi Therapeutics Market Analysis, Insights and Forecast, 2019-2031
- 15.1. Market Analysis, Insights and Forecast - By Country/Sub-region
- 15.1.1 Brazil
- 15.1.2 Argentina
- 15.1.3 Rest of South America
- 16. Competitive Analysis
- 16.1. Global Market Share Analysis 2024
- 16.2. Company Profiles
- 16.2.1 Silence Therapeutics
- 16.2.1.1. Overview
- 16.2.1.2. Products
- 16.2.1.3. SWOT Analysis
- 16.2.1.4. Recent Developments
- 16.2.1.5. Financials (Based on Availability)
- 16.2.2 Arrowhead Pharmaceuticals Inc
- 16.2.2.1. Overview
- 16.2.2.2. Products
- 16.2.2.3. SWOT Analysis
- 16.2.2.4. Recent Developments
- 16.2.2.5. Financials (Based on Availability)
- 16.2.3 Gene Signal International SA
- 16.2.3.1. Overview
- 16.2.3.2. Products
- 16.2.3.3. SWOT Analysis
- 16.2.3.4. Recent Developments
- 16.2.3.5. Financials (Based on Availability)
- 16.2.4 Alnylam Pharmaceuticals Inc
- 16.2.4.1. Overview
- 16.2.4.2. Products
- 16.2.4.3. SWOT Analysis
- 16.2.4.4. Recent Developments
- 16.2.4.5. Financials (Based on Availability)
- 16.2.5 Sarepta Therapeutics Inc
- 16.2.5.1. Overview
- 16.2.5.2. Products
- 16.2.5.3. SWOT Analysis
- 16.2.5.4. Recent Developments
- 16.2.5.5. Financials (Based on Availability)
- 16.2.6 Isarna Therapeutics GmbH
- 16.2.6.1. Overview
- 16.2.6.2. Products
- 16.2.6.3. SWOT Analysis
- 16.2.6.4. Recent Developments
- 16.2.6.5. Financials (Based on Availability)
- 16.2.7 Biogen Inc
- 16.2.7.1. Overview
- 16.2.7.2. Products
- 16.2.7.3. SWOT Analysis
- 16.2.7.4. Recent Developments
- 16.2.7.5. Financials (Based on Availability)
- 16.2.8 Arbutus Biopharma (Formerly Called Tekmira Pharmaceuticals)
- 16.2.8.1. Overview
- 16.2.8.2. Products
- 16.2.8.3. SWOT Analysis
- 16.2.8.4. Recent Developments
- 16.2.8.5. Financials (Based on Availability)
- 16.2.9 Benitec Biopharma Ltd
- 16.2.9.1. Overview
- 16.2.9.2. Products
- 16.2.9.3. SWOT Analysis
- 16.2.9.4. Recent Developments
- 16.2.9.5. Financials (Based on Availability)
- 16.2.10 Ionis Pharmaceuticals (Akcea Therapeutics Inc )
- 16.2.10.1. Overview
- 16.2.10.2. Products
- 16.2.10.3. SWOT Analysis
- 16.2.10.4. Recent Developments
- 16.2.10.5. Financials (Based on Availability)
- 16.2.1 Silence Therapeutics
List of Figures
- Figure 1: Global Antisense & RNAi Therapeutics Market Revenue Breakdown (Million, %) by Region 2024 & 2032
- Figure 2: Global Antisense & RNAi Therapeutics Market Volume Breakdown (K Unit, %) by Region 2024 & 2032
- Figure 3: North America Antisense & RNAi Therapeutics Market Revenue (Million), by Country 2024 & 2032
- Figure 4: North America Antisense & RNAi Therapeutics Market Volume (K Unit), by Country 2024 & 2032
- Figure 5: North America Antisense & RNAi Therapeutics Market Revenue Share (%), by Country 2024 & 2032
- Figure 6: North America Antisense & RNAi Therapeutics Market Volume Share (%), by Country 2024 & 2032
- Figure 7: Europe Antisense & RNAi Therapeutics Market Revenue (Million), by Country 2024 & 2032
- Figure 8: Europe Antisense & RNAi Therapeutics Market Volume (K Unit), by Country 2024 & 2032
- Figure 9: Europe Antisense & RNAi Therapeutics Market Revenue Share (%), by Country 2024 & 2032
- Figure 10: Europe Antisense & RNAi Therapeutics Market Volume Share (%), by Country 2024 & 2032
- Figure 11: Asia Pacific Antisense & RNAi Therapeutics Market Revenue (Million), by Country 2024 & 2032
- Figure 12: Asia Pacific Antisense & RNAi Therapeutics Market Volume (K Unit), by Country 2024 & 2032
- Figure 13: Asia Pacific Antisense & RNAi Therapeutics Market Revenue Share (%), by Country 2024 & 2032
- Figure 14: Asia Pacific Antisense & RNAi Therapeutics Market Volume Share (%), by Country 2024 & 2032
- Figure 15: Middle East and Africa Antisense & RNAi Therapeutics Market Revenue (Million), by Country 2024 & 2032
- Figure 16: Middle East and Africa Antisense & RNAi Therapeutics Market Volume (K Unit), by Country 2024 & 2032
- Figure 17: Middle East and Africa Antisense & RNAi Therapeutics Market Revenue Share (%), by Country 2024 & 2032
- Figure 18: Middle East and Africa Antisense & RNAi Therapeutics Market Volume Share (%), by Country 2024 & 2032
- Figure 19: South America Antisense & RNAi Therapeutics Market Revenue (Million), by Country 2024 & 2032
- Figure 20: South America Antisense & RNAi Therapeutics Market Volume (K Unit), by Country 2024 & 2032
- Figure 21: South America Antisense & RNAi Therapeutics Market Revenue Share (%), by Country 2024 & 2032
- Figure 22: South America Antisense & RNAi Therapeutics Market Volume Share (%), by Country 2024 & 2032
- Figure 23: North America Antisense & RNAi Therapeutics Market Revenue (Million), by Therapeutics 2024 & 2032
- Figure 24: North America Antisense & RNAi Therapeutics Market Volume (K Unit), by Therapeutics 2024 & 2032
- Figure 25: North America Antisense & RNAi Therapeutics Market Revenue Share (%), by Therapeutics 2024 & 2032
- Figure 26: North America Antisense & RNAi Therapeutics Market Volume Share (%), by Therapeutics 2024 & 2032
- Figure 27: North America Antisense & RNAi Therapeutics Market Revenue (Million), by Route of Administration 2024 & 2032
- Figure 28: North America Antisense & RNAi Therapeutics Market Volume (K Unit), by Route of Administration 2024 & 2032
- Figure 29: North America Antisense & RNAi Therapeutics Market Revenue Share (%), by Route of Administration 2024 & 2032
- Figure 30: North America Antisense & RNAi Therapeutics Market Volume Share (%), by Route of Administration 2024 & 2032
- Figure 31: North America Antisense & RNAi Therapeutics Market Revenue (Million), by Indication 2024 & 2032
- Figure 32: North America Antisense & RNAi Therapeutics Market Volume (K Unit), by Indication 2024 & 2032
- Figure 33: North America Antisense & RNAi Therapeutics Market Revenue Share (%), by Indication 2024 & 2032
- Figure 34: North America Antisense & RNAi Therapeutics Market Volume Share (%), by Indication 2024 & 2032
- Figure 35: North America Antisense & RNAi Therapeutics Market Revenue (Million), by Country 2024 & 2032
- Figure 36: North America Antisense & RNAi Therapeutics Market Volume (K Unit), by Country 2024 & 2032
- Figure 37: North America Antisense & RNAi Therapeutics Market Revenue Share (%), by Country 2024 & 2032
- Figure 38: North America Antisense & RNAi Therapeutics Market Volume Share (%), by Country 2024 & 2032
- Figure 39: Europe Antisense & RNAi Therapeutics Market Revenue (Million), by Therapeutics 2024 & 2032
- Figure 40: Europe Antisense & RNAi Therapeutics Market Volume (K Unit), by Therapeutics 2024 & 2032
- Figure 41: Europe Antisense & RNAi Therapeutics Market Revenue Share (%), by Therapeutics 2024 & 2032
- Figure 42: Europe Antisense & RNAi Therapeutics Market Volume Share (%), by Therapeutics 2024 & 2032
- Figure 43: Europe Antisense & RNAi Therapeutics Market Revenue (Million), by Route of Administration 2024 & 2032
- Figure 44: Europe Antisense & RNAi Therapeutics Market Volume (K Unit), by Route of Administration 2024 & 2032
- Figure 45: Europe Antisense & RNAi Therapeutics Market Revenue Share (%), by Route of Administration 2024 & 2032
- Figure 46: Europe Antisense & RNAi Therapeutics Market Volume Share (%), by Route of Administration 2024 & 2032
- Figure 47: Europe Antisense & RNAi Therapeutics Market Revenue (Million), by Indication 2024 & 2032
- Figure 48: Europe Antisense & RNAi Therapeutics Market Volume (K Unit), by Indication 2024 & 2032
- Figure 49: Europe Antisense & RNAi Therapeutics Market Revenue Share (%), by Indication 2024 & 2032
- Figure 50: Europe Antisense & RNAi Therapeutics Market Volume Share (%), by Indication 2024 & 2032
- Figure 51: Europe Antisense & RNAi Therapeutics Market Revenue (Million), by Country 2024 & 2032
- Figure 52: Europe Antisense & RNAi Therapeutics Market Volume (K Unit), by Country 2024 & 2032
- Figure 53: Europe Antisense & RNAi Therapeutics Market Revenue Share (%), by Country 2024 & 2032
- Figure 54: Europe Antisense & RNAi Therapeutics Market Volume Share (%), by Country 2024 & 2032
- Figure 55: Asia Pacific Antisense & RNAi Therapeutics Market Revenue (Million), by Therapeutics 2024 & 2032
- Figure 56: Asia Pacific Antisense & RNAi Therapeutics Market Volume (K Unit), by Therapeutics 2024 & 2032
- Figure 57: Asia Pacific Antisense & RNAi Therapeutics Market Revenue Share (%), by Therapeutics 2024 & 2032
- Figure 58: Asia Pacific Antisense & RNAi Therapeutics Market Volume Share (%), by Therapeutics 2024 & 2032
- Figure 59: Asia Pacific Antisense & RNAi Therapeutics Market Revenue (Million), by Route of Administration 2024 & 2032
- Figure 60: Asia Pacific Antisense & RNAi Therapeutics Market Volume (K Unit), by Route of Administration 2024 & 2032
- Figure 61: Asia Pacific Antisense & RNAi Therapeutics Market Revenue Share (%), by Route of Administration 2024 & 2032
- Figure 62: Asia Pacific Antisense & RNAi Therapeutics Market Volume Share (%), by Route of Administration 2024 & 2032
- Figure 63: Asia Pacific Antisense & RNAi Therapeutics Market Revenue (Million), by Indication 2024 & 2032
- Figure 64: Asia Pacific Antisense & RNAi Therapeutics Market Volume (K Unit), by Indication 2024 & 2032
- Figure 65: Asia Pacific Antisense & RNAi Therapeutics Market Revenue Share (%), by Indication 2024 & 2032
- Figure 66: Asia Pacific Antisense & RNAi Therapeutics Market Volume Share (%), by Indication 2024 & 2032
- Figure 67: Asia Pacific Antisense & RNAi Therapeutics Market Revenue (Million), by Country 2024 & 2032
- Figure 68: Asia Pacific Antisense & RNAi Therapeutics Market Volume (K Unit), by Country 2024 & 2032
- Figure 69: Asia Pacific Antisense & RNAi Therapeutics Market Revenue Share (%), by Country 2024 & 2032
- Figure 70: Asia Pacific Antisense & RNAi Therapeutics Market Volume Share (%), by Country 2024 & 2032
- Figure 71: Middle East and Africa Antisense & RNAi Therapeutics Market Revenue (Million), by Therapeutics 2024 & 2032
- Figure 72: Middle East and Africa Antisense & RNAi Therapeutics Market Volume (K Unit), by Therapeutics 2024 & 2032
- Figure 73: Middle East and Africa Antisense & RNAi Therapeutics Market Revenue Share (%), by Therapeutics 2024 & 2032
- Figure 74: Middle East and Africa Antisense & RNAi Therapeutics Market Volume Share (%), by Therapeutics 2024 & 2032
- Figure 75: Middle East and Africa Antisense & RNAi Therapeutics Market Revenue (Million), by Route of Administration 2024 & 2032
- Figure 76: Middle East and Africa Antisense & RNAi Therapeutics Market Volume (K Unit), by Route of Administration 2024 & 2032
- Figure 77: Middle East and Africa Antisense & RNAi Therapeutics Market Revenue Share (%), by Route of Administration 2024 & 2032
- Figure 78: Middle East and Africa Antisense & RNAi Therapeutics Market Volume Share (%), by Route of Administration 2024 & 2032
- Figure 79: Middle East and Africa Antisense & RNAi Therapeutics Market Revenue (Million), by Indication 2024 & 2032
- Figure 80: Middle East and Africa Antisense & RNAi Therapeutics Market Volume (K Unit), by Indication 2024 & 2032
- Figure 81: Middle East and Africa Antisense & RNAi Therapeutics Market Revenue Share (%), by Indication 2024 & 2032
- Figure 82: Middle East and Africa Antisense & RNAi Therapeutics Market Volume Share (%), by Indication 2024 & 2032
- Figure 83: Middle East and Africa Antisense & RNAi Therapeutics Market Revenue (Million), by Country 2024 & 2032
- Figure 84: Middle East and Africa Antisense & RNAi Therapeutics Market Volume (K Unit), by Country 2024 & 2032
- Figure 85: Middle East and Africa Antisense & RNAi Therapeutics Market Revenue Share (%), by Country 2024 & 2032
- Figure 86: Middle East and Africa Antisense & RNAi Therapeutics Market Volume Share (%), by Country 2024 & 2032
- Figure 87: South America Antisense & RNAi Therapeutics Market Revenue (Million), by Therapeutics 2024 & 2032
- Figure 88: South America Antisense & RNAi Therapeutics Market Volume (K Unit), by Therapeutics 2024 & 2032
- Figure 89: South America Antisense & RNAi Therapeutics Market Revenue Share (%), by Therapeutics 2024 & 2032
- Figure 90: South America Antisense & RNAi Therapeutics Market Volume Share (%), by Therapeutics 2024 & 2032
- Figure 91: South America Antisense & RNAi Therapeutics Market Revenue (Million), by Route of Administration 2024 & 2032
- Figure 92: South America Antisense & RNAi Therapeutics Market Volume (K Unit), by Route of Administration 2024 & 2032
- Figure 93: South America Antisense & RNAi Therapeutics Market Revenue Share (%), by Route of Administration 2024 & 2032
- Figure 94: South America Antisense & RNAi Therapeutics Market Volume Share (%), by Route of Administration 2024 & 2032
- Figure 95: South America Antisense & RNAi Therapeutics Market Revenue (Million), by Indication 2024 & 2032
- Figure 96: South America Antisense & RNAi Therapeutics Market Volume (K Unit), by Indication 2024 & 2032
- Figure 97: South America Antisense & RNAi Therapeutics Market Revenue Share (%), by Indication 2024 & 2032
- Figure 98: South America Antisense & RNAi Therapeutics Market Volume Share (%), by Indication 2024 & 2032
- Figure 99: South America Antisense & RNAi Therapeutics Market Revenue (Million), by Country 2024 & 2032
- Figure 100: South America Antisense & RNAi Therapeutics Market Volume (K Unit), by Country 2024 & 2032
- Figure 101: South America Antisense & RNAi Therapeutics Market Revenue Share (%), by Country 2024 & 2032
- Figure 102: South America Antisense & RNAi Therapeutics Market Volume Share (%), by Country 2024 & 2032
List of Tables
- Table 1: Global Antisense & RNAi Therapeutics Market Revenue Million Forecast, by Region 2019 & 2032
- Table 2: Global Antisense & RNAi Therapeutics Market Volume K Unit Forecast, by Region 2019 & 2032
- Table 3: Global Antisense & RNAi Therapeutics Market Revenue Million Forecast, by Therapeutics 2019 & 2032
- Table 4: Global Antisense & RNAi Therapeutics Market Volume K Unit Forecast, by Therapeutics 2019 & 2032
- Table 5: Global Antisense & RNAi Therapeutics Market Revenue Million Forecast, by Route of Administration 2019 & 2032
- Table 6: Global Antisense & RNAi Therapeutics Market Volume K Unit Forecast, by Route of Administration 2019 & 2032
- Table 7: Global Antisense & RNAi Therapeutics Market Revenue Million Forecast, by Indication 2019 & 2032
- Table 8: Global Antisense & RNAi Therapeutics Market Volume K Unit Forecast, by Indication 2019 & 2032
- Table 9: Global Antisense & RNAi Therapeutics Market Revenue Million Forecast, by Region 2019 & 2032
- Table 10: Global Antisense & RNAi Therapeutics Market Volume K Unit Forecast, by Region 2019 & 2032
- Table 11: Global Antisense & RNAi Therapeutics Market Revenue Million Forecast, by Country 2019 & 2032
- Table 12: Global Antisense & RNAi Therapeutics Market Volume K Unit Forecast, by Country 2019 & 2032
- Table 13: United States Antisense & RNAi Therapeutics Market Revenue (Million) Forecast, by Application 2019 & 2032
- Table 14: United States Antisense & RNAi Therapeutics Market Volume (K Unit) Forecast, by Application 2019 & 2032
- Table 15: Canada Antisense & RNAi Therapeutics Market Revenue (Million) Forecast, by Application 2019 & 2032
- Table 16: Canada Antisense & RNAi Therapeutics Market Volume (K Unit) Forecast, by Application 2019 & 2032
- Table 17: Mexico Antisense & RNAi Therapeutics Market Revenue (Million) Forecast, by Application 2019 & 2032
- Table 18: Mexico Antisense & RNAi Therapeutics Market Volume (K Unit) Forecast, by Application 2019 & 2032
- Table 19: Global Antisense & RNAi Therapeutics Market Revenue Million Forecast, by Country 2019 & 2032
- Table 20: Global Antisense & RNAi Therapeutics Market Volume K Unit Forecast, by Country 2019 & 2032
- Table 21: Germany Antisense & RNAi Therapeutics Market Revenue (Million) Forecast, by Application 2019 & 2032
- Table 22: Germany Antisense & RNAi Therapeutics Market Volume (K Unit) Forecast, by Application 2019 & 2032
- Table 23: United Kingdom Antisense & RNAi Therapeutics Market Revenue (Million) Forecast, by Application 2019 & 2032
- Table 24: United Kingdom Antisense & RNAi Therapeutics Market Volume (K Unit) Forecast, by Application 2019 & 2032
- Table 25: France Antisense & RNAi Therapeutics Market Revenue (Million) Forecast, by Application 2019 & 2032
- Table 26: France Antisense & RNAi Therapeutics Market Volume (K Unit) Forecast, by Application 2019 & 2032
- Table 27: Italy Antisense & RNAi Therapeutics Market Revenue (Million) Forecast, by Application 2019 & 2032
- Table 28: Italy Antisense & RNAi Therapeutics Market Volume (K Unit) Forecast, by Application 2019 & 2032
- Table 29: Spain Antisense & RNAi Therapeutics Market Revenue (Million) Forecast, by Application 2019 & 2032
- Table 30: Spain Antisense & RNAi Therapeutics Market Volume (K Unit) Forecast, by Application 2019 & 2032
- Table 31: Rest of Europe Antisense & RNAi Therapeutics Market Revenue (Million) Forecast, by Application 2019 & 2032
- Table 32: Rest of Europe Antisense & RNAi Therapeutics Market Volume (K Unit) Forecast, by Application 2019 & 2032
- Table 33: Global Antisense & RNAi Therapeutics Market Revenue Million Forecast, by Country 2019 & 2032
- Table 34: Global Antisense & RNAi Therapeutics Market Volume K Unit Forecast, by Country 2019 & 2032
- Table 35: China Antisense & RNAi Therapeutics Market Revenue (Million) Forecast, by Application 2019 & 2032
- Table 36: China Antisense & RNAi Therapeutics Market Volume (K Unit) Forecast, by Application 2019 & 2032
- Table 37: Japan Antisense & RNAi Therapeutics Market Revenue (Million) Forecast, by Application 2019 & 2032
- Table 38: Japan Antisense & RNAi Therapeutics Market Volume (K Unit) Forecast, by Application 2019 & 2032
- Table 39: India Antisense & RNAi Therapeutics Market Revenue (Million) Forecast, by Application 2019 & 2032
- Table 40: India Antisense & RNAi Therapeutics Market Volume (K Unit) Forecast, by Application 2019 & 2032
- Table 41: Australia Antisense & RNAi Therapeutics Market Revenue (Million) Forecast, by Application 2019 & 2032
- Table 42: Australia Antisense & RNAi Therapeutics Market Volume (K Unit) Forecast, by Application 2019 & 2032
- Table 43: South Korea Antisense & RNAi Therapeutics Market Revenue (Million) Forecast, by Application 2019 & 2032
- Table 44: South Korea Antisense & RNAi Therapeutics Market Volume (K Unit) Forecast, by Application 2019 & 2032
- Table 45: Rest of Asia Pacific Antisense & RNAi Therapeutics Market Revenue (Million) Forecast, by Application 2019 & 2032
- Table 46: Rest of Asia Pacific Antisense & RNAi Therapeutics Market Volume (K Unit) Forecast, by Application 2019 & 2032
- Table 47: Global Antisense & RNAi Therapeutics Market Revenue Million Forecast, by Country 2019 & 2032
- Table 48: Global Antisense & RNAi Therapeutics Market Volume K Unit Forecast, by Country 2019 & 2032
- Table 49: GCC Antisense & RNAi Therapeutics Market Revenue (Million) Forecast, by Application 2019 & 2032
- Table 50: GCC Antisense & RNAi Therapeutics Market Volume (K Unit) Forecast, by Application 2019 & 2032
- Table 51: South Africa Antisense & RNAi Therapeutics Market Revenue (Million) Forecast, by Application 2019 & 2032
- Table 52: South Africa Antisense & RNAi Therapeutics Market Volume (K Unit) Forecast, by Application 2019 & 2032
- Table 53: Rest of Middle East and Africa Antisense & RNAi Therapeutics Market Revenue (Million) Forecast, by Application 2019 & 2032
- Table 54: Rest of Middle East and Africa Antisense & RNAi Therapeutics Market Volume (K Unit) Forecast, by Application 2019 & 2032
- Table 55: Global Antisense & RNAi Therapeutics Market Revenue Million Forecast, by Country 2019 & 2032
- Table 56: Global Antisense & RNAi Therapeutics Market Volume K Unit Forecast, by Country 2019 & 2032
- Table 57: Brazil Antisense & RNAi Therapeutics Market Revenue (Million) Forecast, by Application 2019 & 2032
- Table 58: Brazil Antisense & RNAi Therapeutics Market Volume (K Unit) Forecast, by Application 2019 & 2032
- Table 59: Argentina Antisense & RNAi Therapeutics Market Revenue (Million) Forecast, by Application 2019 & 2032
- Table 60: Argentina Antisense & RNAi Therapeutics Market Volume (K Unit) Forecast, by Application 2019 & 2032
- Table 61: Rest of South America Antisense & RNAi Therapeutics Market Revenue (Million) Forecast, by Application 2019 & 2032
- Table 62: Rest of South America Antisense & RNAi Therapeutics Market Volume (K Unit) Forecast, by Application 2019 & 2032
- Table 63: Global Antisense & RNAi Therapeutics Market Revenue Million Forecast, by Therapeutics 2019 & 2032
- Table 64: Global Antisense & RNAi Therapeutics Market Volume K Unit Forecast, by Therapeutics 2019 & 2032
- Table 65: Global Antisense & RNAi Therapeutics Market Revenue Million Forecast, by Route of Administration 2019 & 2032
- Table 66: Global Antisense & RNAi Therapeutics Market Volume K Unit Forecast, by Route of Administration 2019 & 2032
- Table 67: Global Antisense & RNAi Therapeutics Market Revenue Million Forecast, by Indication 2019 & 2032
- Table 68: Global Antisense & RNAi Therapeutics Market Volume K Unit Forecast, by Indication 2019 & 2032
- Table 69: Global Antisense & RNAi Therapeutics Market Revenue Million Forecast, by Country 2019 & 2032
- Table 70: Global Antisense & RNAi Therapeutics Market Volume K Unit Forecast, by Country 2019 & 2032
- Table 71: United States Antisense & RNAi Therapeutics Market Revenue (Million) Forecast, by Application 2019 & 2032
- Table 72: United States Antisense & RNAi Therapeutics Market Volume (K Unit) Forecast, by Application 2019 & 2032
- Table 73: Canada Antisense & RNAi Therapeutics Market Revenue (Million) Forecast, by Application 2019 & 2032
- Table 74: Canada Antisense & RNAi Therapeutics Market Volume (K Unit) Forecast, by Application 2019 & 2032
- Table 75: Mexico Antisense & RNAi Therapeutics Market Revenue (Million) Forecast, by Application 2019 & 2032
- Table 76: Mexico Antisense & RNAi Therapeutics Market Volume (K Unit) Forecast, by Application 2019 & 2032
- Table 77: Global Antisense & RNAi Therapeutics Market Revenue Million Forecast, by Therapeutics 2019 & 2032
- Table 78: Global Antisense & RNAi Therapeutics Market Volume K Unit Forecast, by Therapeutics 2019 & 2032
- Table 79: Global Antisense & RNAi Therapeutics Market Revenue Million Forecast, by Route of Administration 2019 & 2032
- Table 80: Global Antisense & RNAi Therapeutics Market Volume K Unit Forecast, by Route of Administration 2019 & 2032
- Table 81: Global Antisense & RNAi Therapeutics Market Revenue Million Forecast, by Indication 2019 & 2032
- Table 82: Global Antisense & RNAi Therapeutics Market Volume K Unit Forecast, by Indication 2019 & 2032
- Table 83: Global Antisense & RNAi Therapeutics Market Revenue Million Forecast, by Country 2019 & 2032
- Table 84: Global Antisense & RNAi Therapeutics Market Volume K Unit Forecast, by Country 2019 & 2032
- Table 85: Germany Antisense & RNAi Therapeutics Market Revenue (Million) Forecast, by Application 2019 & 2032
- Table 86: Germany Antisense & RNAi Therapeutics Market Volume (K Unit) Forecast, by Application 2019 & 2032
- Table 87: United Kingdom Antisense & RNAi Therapeutics Market Revenue (Million) Forecast, by Application 2019 & 2032
- Table 88: United Kingdom Antisense & RNAi Therapeutics Market Volume (K Unit) Forecast, by Application 2019 & 2032
- Table 89: France Antisense & RNAi Therapeutics Market Revenue (Million) Forecast, by Application 2019 & 2032
- Table 90: France Antisense & RNAi Therapeutics Market Volume (K Unit) Forecast, by Application 2019 & 2032
- Table 91: Italy Antisense & RNAi Therapeutics Market Revenue (Million) Forecast, by Application 2019 & 2032
- Table 92: Italy Antisense & RNAi Therapeutics Market Volume (K Unit) Forecast, by Application 2019 & 2032
- Table 93: Spain Antisense & RNAi Therapeutics Market Revenue (Million) Forecast, by Application 2019 & 2032
- Table 94: Spain Antisense & RNAi Therapeutics Market Volume (K Unit) Forecast, by Application 2019 & 2032
- Table 95: Rest of Europe Antisense & RNAi Therapeutics Market Revenue (Million) Forecast, by Application 2019 & 2032
- Table 96: Rest of Europe Antisense & RNAi Therapeutics Market Volume (K Unit) Forecast, by Application 2019 & 2032
- Table 97: Global Antisense & RNAi Therapeutics Market Revenue Million Forecast, by Therapeutics 2019 & 2032
- Table 98: Global Antisense & RNAi Therapeutics Market Volume K Unit Forecast, by Therapeutics 2019 & 2032
- Table 99: Global Antisense & RNAi Therapeutics Market Revenue Million Forecast, by Route of Administration 2019 & 2032
- Table 100: Global Antisense & RNAi Therapeutics Market Volume K Unit Forecast, by Route of Administration 2019 & 2032
- Table 101: Global Antisense & RNAi Therapeutics Market Revenue Million Forecast, by Indication 2019 & 2032
- Table 102: Global Antisense & RNAi Therapeutics Market Volume K Unit Forecast, by Indication 2019 & 2032
- Table 103: Global Antisense & RNAi Therapeutics Market Revenue Million Forecast, by Country 2019 & 2032
- Table 104: Global Antisense & RNAi Therapeutics Market Volume K Unit Forecast, by Country 2019 & 2032
- Table 105: China Antisense & RNAi Therapeutics Market Revenue (Million) Forecast, by Application 2019 & 2032
- Table 106: China Antisense & RNAi Therapeutics Market Volume (K Unit) Forecast, by Application 2019 & 2032
- Table 107: Japan Antisense & RNAi Therapeutics Market Revenue (Million) Forecast, by Application 2019 & 2032
- Table 108: Japan Antisense & RNAi Therapeutics Market Volume (K Unit) Forecast, by Application 2019 & 2032
- Table 109: India Antisense & RNAi Therapeutics Market Revenue (Million) Forecast, by Application 2019 & 2032
- Table 110: India Antisense & RNAi Therapeutics Market Volume (K Unit) Forecast, by Application 2019 & 2032
- Table 111: Australia Antisense & RNAi Therapeutics Market Revenue (Million) Forecast, by Application 2019 & 2032
- Table 112: Australia Antisense & RNAi Therapeutics Market Volume (K Unit) Forecast, by Application 2019 & 2032
- Table 113: South Korea Antisense & RNAi Therapeutics Market Revenue (Million) Forecast, by Application 2019 & 2032
- Table 114: South Korea Antisense & RNAi Therapeutics Market Volume (K Unit) Forecast, by Application 2019 & 2032
- Table 115: Rest of Asia Pacific Antisense & RNAi Therapeutics Market Revenue (Million) Forecast, by Application 2019 & 2032
- Table 116: Rest of Asia Pacific Antisense & RNAi Therapeutics Market Volume (K Unit) Forecast, by Application 2019 & 2032
- Table 117: Global Antisense & RNAi Therapeutics Market Revenue Million Forecast, by Therapeutics 2019 & 2032
- Table 118: Global Antisense & RNAi Therapeutics Market Volume K Unit Forecast, by Therapeutics 2019 & 2032
- Table 119: Global Antisense & RNAi Therapeutics Market Revenue Million Forecast, by Route of Administration 2019 & 2032
- Table 120: Global Antisense & RNAi Therapeutics Market Volume K Unit Forecast, by Route of Administration 2019 & 2032
- Table 121: Global Antisense & RNAi Therapeutics Market Revenue Million Forecast, by Indication 2019 & 2032
- Table 122: Global Antisense & RNAi Therapeutics Market Volume K Unit Forecast, by Indication 2019 & 2032
- Table 123: Global Antisense & RNAi Therapeutics Market Revenue Million Forecast, by Country 2019 & 2032
- Table 124: Global Antisense & RNAi Therapeutics Market Volume K Unit Forecast, by Country 2019 & 2032
- Table 125: GCC Antisense & RNAi Therapeutics Market Revenue (Million) Forecast, by Application 2019 & 2032
- Table 126: GCC Antisense & RNAi Therapeutics Market Volume (K Unit) Forecast, by Application 2019 & 2032
- Table 127: South Africa Antisense & RNAi Therapeutics Market Revenue (Million) Forecast, by Application 2019 & 2032
- Table 128: South Africa Antisense & RNAi Therapeutics Market Volume (K Unit) Forecast, by Application 2019 & 2032
- Table 129: Rest of Middle East and Africa Antisense & RNAi Therapeutics Market Revenue (Million) Forecast, by Application 2019 & 2032
- Table 130: Rest of Middle East and Africa Antisense & RNAi Therapeutics Market Volume (K Unit) Forecast, by Application 2019 & 2032
- Table 131: Global Antisense & RNAi Therapeutics Market Revenue Million Forecast, by Therapeutics 2019 & 2032
- Table 132: Global Antisense & RNAi Therapeutics Market Volume K Unit Forecast, by Therapeutics 2019 & 2032
- Table 133: Global Antisense & RNAi Therapeutics Market Revenue Million Forecast, by Route of Administration 2019 & 2032
- Table 134: Global Antisense & RNAi Therapeutics Market Volume K Unit Forecast, by Route of Administration 2019 & 2032
- Table 135: Global Antisense & RNAi Therapeutics Market Revenue Million Forecast, by Indication 2019 & 2032
- Table 136: Global Antisense & RNAi Therapeutics Market Volume K Unit Forecast, by Indication 2019 & 2032
- Table 137: Global Antisense & RNAi Therapeutics Market Revenue Million Forecast, by Country 2019 & 2032
- Table 138: Global Antisense & RNAi Therapeutics Market Volume K Unit Forecast, by Country 2019 & 2032
- Table 139: Brazil Antisense & RNAi Therapeutics Market Revenue (Million) Forecast, by Application 2019 & 2032
- Table 140: Brazil Antisense & RNAi Therapeutics Market Volume (K Unit) Forecast, by Application 2019 & 2032
- Table 141: Argentina Antisense & RNAi Therapeutics Market Revenue (Million) Forecast, by Application 2019 & 2032
- Table 142: Argentina Antisense & RNAi Therapeutics Market Volume (K Unit) Forecast, by Application 2019 & 2032
- Table 143: Rest of South America Antisense & RNAi Therapeutics Market Revenue (Million) Forecast, by Application 2019 & 2032
- Table 144: Rest of South America Antisense & RNAi Therapeutics Market Volume (K Unit) Forecast, by Application 2019 & 2032
Frequently Asked Questions
1. What is the projected Compound Annual Growth Rate (CAGR) of the Antisense & RNAi Therapeutics Market?
The projected CAGR is approximately 7.10%.
2. Which companies are prominent players in the Antisense & RNAi Therapeutics Market?
Key companies in the market include Silence Therapeutics, Arrowhead Pharmaceuticals Inc, Gene Signal International SA, Alnylam Pharmaceuticals Inc, Sarepta Therapeutics Inc, Isarna Therapeutics GmbH, Biogen Inc, Arbutus Biopharma (Formerly Called Tekmira Pharmaceuticals), Benitec Biopharma Ltd, Ionis Pharmaceuticals (Akcea Therapeutics Inc ).
3. What are the main segments of the Antisense & RNAi Therapeutics Market?
The market segments include Therapeutics, Route of Administration, Indication.
4. Can you provide details about the market size?
The market size is estimated to be USD XX Million as of 2022.
5. What are some drivers contributing to market growth?
Better Therapeutic Outcomes for Rare Disease Due to Effective Gene Slicing Technology; Surge in R&D funding Coupled with Presence of Promising Pipeline Products.
6. What are the notable trends driving market growth?
RNA Antisense is Expected to Witness High Growth Over the Forecast Period.
7. Are there any restraints impacting market growth?
High Cost of Therapeutics.
8. Can you provide examples of recent developments in the market?
In December 2021, Novartis AG received Food and Drug Administration (FDA) approval for Leqvio (inclisiran). Furthermore, Leqvio is a small interfering RNA (siRNA) therapy approved for lowering low-density lipoprotein cholesterol (LDL).
9. What pricing options are available for accessing the report?
Pricing options include single-user, multi-user, and enterprise licenses priced at USD 4750, USD 5250, and USD 8750 respectively.
10. Is the market size provided in terms of value or volume?
The market size is provided in terms of value, measured in Million and volume, measured in K Unit.
11. Are there any specific market keywords associated with the report?
Yes, the market keyword associated with the report is "Antisense & RNAi Therapeutics Market," which aids in identifying and referencing the specific market segment covered.
12. How do I determine which pricing option suits my needs best?
The pricing options vary based on user requirements and access needs. Individual users may opt for single-user licenses, while businesses requiring broader access may choose multi-user or enterprise licenses for cost-effective access to the report.
13. Are there any additional resources or data provided in the Antisense & RNAi Therapeutics Market report?
While the report offers comprehensive insights, it's advisable to review the specific contents or supplementary materials provided to ascertain if additional resources or data are available.
14. How can I stay updated on further developments or reports in the Antisense & RNAi Therapeutics Market?
To stay informed about further developments, trends, and reports in the Antisense & RNAi Therapeutics Market, consider subscribing to industry newsletters, following relevant companies and organizations, or regularly checking reputable industry news sources and publications.
Methodology
Step 1 - Identification of Relevant Samples Size from Population Database


Step 2 - Approaches for Defining Global Market Size (Value, Volume* & Price*)

Note*: In applicable scenarios
Step 3 - Data Sources
Primary Research
- Web Analytics
- Survey Reports
- Research Institute
- Latest Research Reports
- Opinion Leaders
Secondary Research
- Annual Reports
- White Paper
- Latest Press Release
- Industry Association
- Paid Database
- Investor Presentations

Step 4 - Data Triangulation
Involves using different sources of information in order to increase the validity of a study
These sources are likely to be stakeholders in a program - participants, other researchers, program staff, other community members, and so on.
Then we put all data in single framework & apply various statistical tools to find out the dynamic on the market.
During the analysis stage, feedback from the stakeholder groups would be compared to determine areas of agreement as well as areas of divergence
