

Key Insights
The global oxygen therapy devices market is experiencing robust growth, projected to reach a substantial size driven by several key factors. The rising prevalence of chronic respiratory diseases like COPD and asthma, coupled with an aging global population increasingly susceptible to these conditions, significantly fuels market demand. Furthermore, advancements in oxygen therapy technology, such as portable oxygen concentrators and high-flow oxygen therapy systems, are improving patient comfort and convenience, leading to wider adoption. The increasing awareness of the benefits of early intervention and improved home healthcare infrastructure are also contributing to market expansion. Significant growth is anticipated in developing economies due to rising healthcare expenditure and improving access to healthcare services. However, the market faces challenges including the high cost of advanced oxygen therapy devices, particularly in low- and middle-income countries, limiting accessibility for a large segment of the population. Regulatory hurdles and reimbursement policies also influence market growth, although these are likely to be mitigated by increasing evidence supporting the clinical and cost-effectiveness of oxygen therapy. The market is segmented by application (e.g., COPD, pneumonia, sleep apnea) and product type (e.g., oxygen concentrators, oxygen cylinders, ventilators), offering opportunities for specialized device development and targeted marketing strategies. Competition is expected to remain intense, with established players focusing on innovation, strategic partnerships, and market expansion into emerging economies.
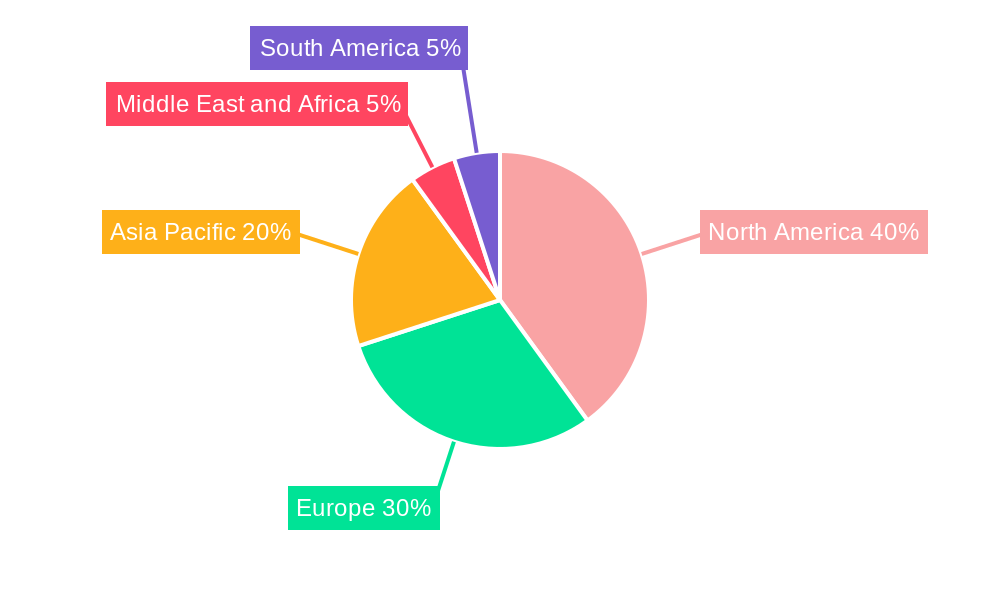
The market's segmentation offers strategic avenues for growth. The monoplace and multiplace hyperbaric oxygen therapy (HBOT) devices segment is experiencing significant traction due to their effectiveness in treating conditions like decompression sickness and diabetic foot ulcers. Technological advancements in HBOT, including improved safety features and user-friendly interfaces, are expanding its applications and driving adoption. While the topical HBOT devices segment holds considerable future potential, it is currently smaller compared to its counterparts. The North American market currently holds a dominant share, attributed to advanced healthcare infrastructure, high healthcare expenditure, and robust technological advancements. However, the Asia-Pacific region demonstrates significant growth potential due to rapid economic development, increasing healthcare awareness, and rising prevalence of respiratory diseases. This presents opportunities for market expansion and strategic investment in this region. The European market also holds a considerable share, characterized by stringent regulatory frameworks and a focus on innovative oxygen therapy solutions.
Oxygen Therapy Devices Industry Market Report: 2019-2033
This comprehensive report provides a detailed analysis of the Oxygen Therapy Devices market, encompassing historical data (2019-2024), current estimates (2025), and future projections (2025-2033). The report covers the parent market of Medical Devices and the child market of Hyperbaric Oxygen Therapy (HBOT) Devices, offering invaluable insights for industry professionals, investors, and strategic decision-makers. The global market size is expected to reach xx million units by 2033.
Oxygen Therapy Devices Industry Market Dynamics & Structure
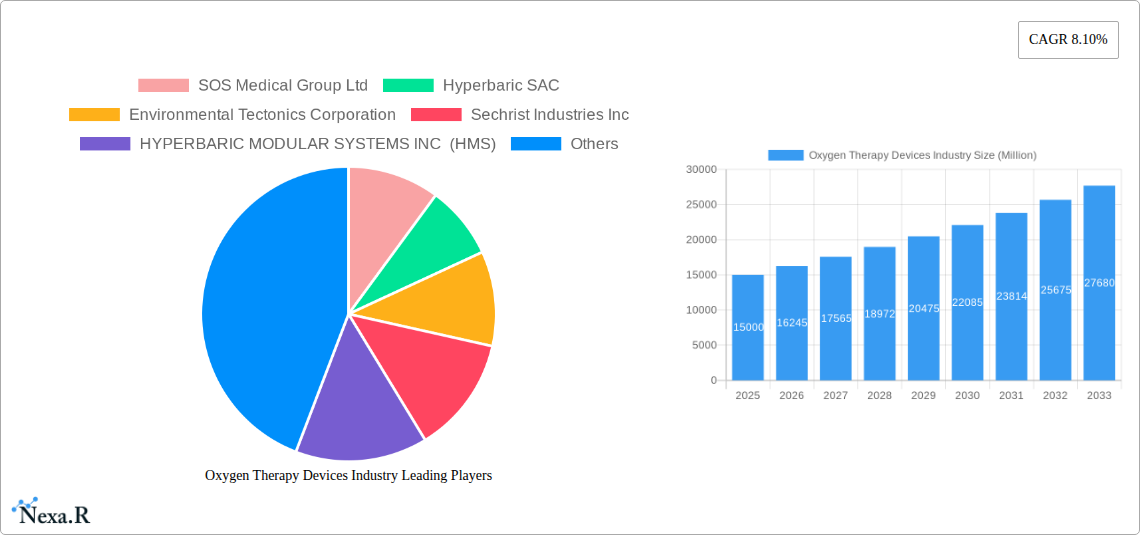
The Oxygen Therapy Devices market is characterized by a moderately concentrated landscape, with key players such as SOS Medical Group Ltd, Hyperbaric SAC, Environmental Tectonics Corporation, Sechrist Industries Inc, HYPERBARIC MODULAR SYSTEMS INC (HMS), Hearmec Co Ltd, Fink Engineering, HAUX-LIFE-SUPPORT GmbH, and Hpotech Hyperbaric Solutions vying for market share. Technological innovation, driven by advancements in HBOT chamber design and oxygen delivery systems, is a major growth driver. Stringent regulatory frameworks governing medical device approvals impact market entry and expansion. Competitive substitutes include alternative wound healing treatments, influencing market penetration. End-user demographics, largely focused on geriatric populations and patients with chronic wounds, shape market demand. M&A activity within the sector is moderate, with xx deals recorded in the historical period (2019-2024), indicating potential for consolidation.
- Market Concentration: Moderately concentrated, with the top 5 players holding approximately xx% of the market share in 2024.
- Technological Innovation: Advancements in chamber design, oxygen delivery, and monitoring systems.
- Regulatory Framework: Stringent FDA and other international regulatory approvals needed for market entry.
- Competitive Substitutes: Alternative wound-healing treatments and therapies impacting market share.
- End-User Demographics: Primarily focused on geriatric patients and those with chronic wounds.
- M&A Trends: Moderate M&A activity, with xx deals recorded from 2019-2024.
Oxygen Therapy Devices Industry Growth Trends & Insights
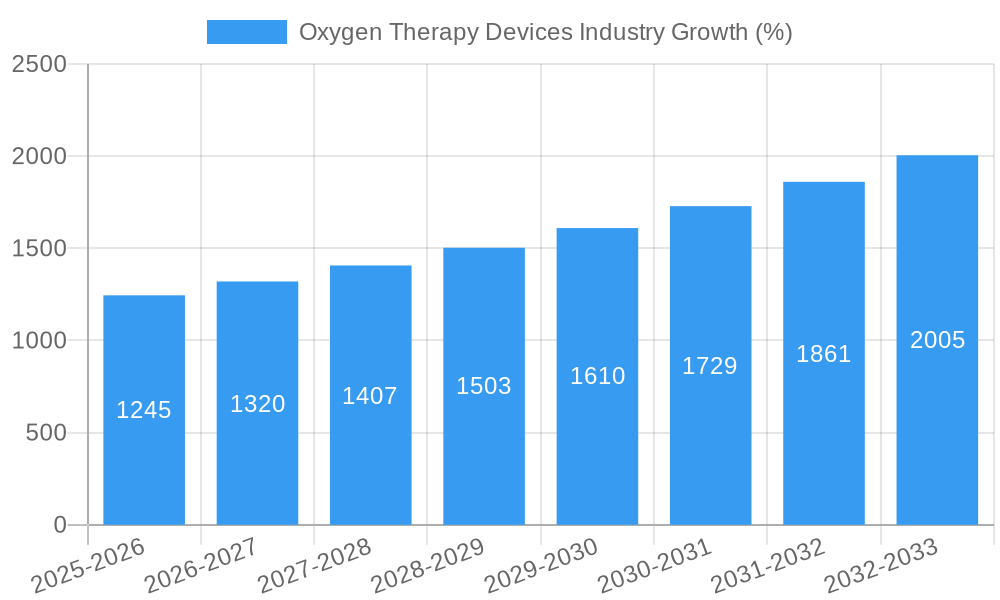
The Oxygen Therapy Devices market experienced substantial growth from 2019 to 2024, with a CAGR of xx%. This growth is attributed to increasing prevalence of chronic wounds (e.g., diabetic foot ulcers), rising awareness of HBOT's efficacy, and technological advancements improving treatment accessibility and affordability. The adoption rate of HBOT, particularly in developing economies, is steadily increasing, driven by improved healthcare infrastructure and rising disposable incomes. Technological disruptions are leading to smaller, more portable, and user-friendly HBOT devices. Consumer behavior shifts towards minimally invasive and effective treatments further fuel market growth. Market penetration in key regions is expected to reach xx% by 2033.
Dominant Regions, Countries, or Segments in Oxygen Therapy Devices Industry
North America currently dominates the global Oxygen Therapy Devices market, accounting for approximately xx% of the market share in 2024 due to high prevalence of chronic diseases, well-established healthcare infrastructure, and strong regulatory support. Within applications, Diabetic Foot Ulcers and Wound Healing represent the largest segments, driven by the growing diabetic population globally. Monoplace HBOT Devices currently hold the largest market share in the product type segment due to their cost-effectiveness and widespread availability. However, the Multiplace HBOT Devices segment is expected to witness significant growth owing to its ability to treat multiple patients simultaneously.
- Key Drivers (North America): Advanced healthcare infrastructure, high prevalence of chronic diseases, robust regulatory framework.
- Key Drivers (Diabetic Foot Ulcers/Wound Healing): Rising prevalence of diabetes and chronic wounds globally.
- Key Drivers (Monoplace HBOT Devices): Cost-effectiveness, ease of use, and widespread availability.
- Growth Potential: Multiplace HBOT Devices segment is poised for significant growth due to enhanced treatment capacity.
Oxygen Therapy Devices Industry Product Landscape
The Oxygen Therapy Devices market offers a range of products, including monoplace, multiplace, and topical HBOT devices. Innovations focus on enhancing chamber design for improved patient comfort and safety, incorporating advanced oxygen monitoring systems, and developing portable and user-friendly devices. Unique selling propositions include enhanced treatment efficacy, reduced treatment times, and improved patient outcomes. Technological advancements are continuously improving the safety, efficacy, and ease of use of HBOT systems.
Key Drivers, Barriers & Challenges in Oxygen Therapy Devices Industry
Key Drivers:
- Increasing prevalence of chronic wounds and conditions treatable by HBOT.
- Technological advancements leading to improved device efficacy and accessibility.
- Rising healthcare expenditure and insurance coverage for HBOT treatments.
Key Challenges:
- High initial investment costs associated with HBOT systems limiting accessibility.
- Stringent regulatory pathways hindering market entry for new players.
- Competition from alternative wound-healing treatments.
- Supply chain disruptions potentially impacting device availability. (xx% impact predicted in 2026 due to predicted material shortages.)
Emerging Opportunities in Oxygen Therapy Devices Industry
- Expanding into untapped markets in developing economies.
- Development of innovative HBOT applications for new therapeutic areas.
- Focus on personalized HBOT treatments based on patient-specific needs.
- Growing demand for telehealth integration for remote monitoring and treatment support.
Growth Accelerators in the Oxygen Therapy Devices Industry Industry
Technological breakthroughs, especially in miniaturization and portability of HBOT devices, are significant growth accelerators. Strategic partnerships between device manufacturers and healthcare providers expand market access. Expansion into new therapeutic areas beyond traditional applications (e.g., sports medicine) is driving long-term growth.
Key Players Shaping the Oxygen Therapy Devices Industry Market
- SOS Medical Group Ltd
- Hyperbaric SAC
- Environmental Tectonics Corporation
- Sechrist Industries Inc
- HYPERBARIC MODULAR SYSTEMS INC (HMS)
- Hearmec Co Ltd
- Fink Engineering
- HAUX-LIFE-SUPPORT GmbH
- Hpotech Hyperbaric Solutions
Notable Milestones in Oxygen Therapy Devices Industry Sector
- August 2022: HBOT-India launched a medical-grade hyperbaric oxygen therapy facility in Gurugram, Delhi NCR, highlighting increased market penetration in developing economies. This initiative demonstrated the significant impact of HBOT on reducing amputation risk (20-30%) and improving wound healing (9-10 times).
- February 2023: Maui Health's new outpatient facility in Hawaii offering comprehensive wound care, including HBOT, showcases the growing integration of HBOT into broader healthcare settings.
In-Depth Oxygen Therapy Devices Industry Market Outlook
The Oxygen Therapy Devices market is poised for continued robust growth, driven by technological innovation, increased adoption in emerging markets, and expanding applications in various therapeutic areas. Strategic partnerships, product diversification, and a focus on enhancing patient outcomes will be key success factors for players in this dynamic market. The market's future is bright, promising substantial growth and opportunity for those who can capitalize on the growing demand for effective and accessible HBOT solutions.
Oxygen Therapy Devices Industry Segmentation
-
1. Application
- 1.1. Decompression Sickness
- 1.2. Diabetic Foot Ulcers
- 1.3. Gas Embolism
- 1.4. Infection Treatment
- 1.5. Wound Healing
- 1.6. Other Applications
-
2. Product Type
- 2.1. Monoplace HBOT Devices
- 2.2. Multiplace HBOT Devices
- 2.3. Topical HBOT Devices
Oxygen Therapy Devices Industry Segmentation By Geography
-
1. North America
- 1.1. United States
- 1.2. Canada
- 1.3. Mexico
-
2. Europe
- 2.1. Germany
- 2.2. United Kingdom
- 2.3. France
- 2.4. Italy
- 2.5. Spain
- 2.6. Rest of Europe
-
3. Asia Pacific
- 3.1. China
- 3.2. Japan
- 3.3. India
- 3.4. Australia
- 3.5. South Korea
- 3.6. Rest of Asia Pacific
-
4. Middle East and Africa
- 4.1. GCC
- 4.2. South Africa
- 4.3. Rest of Middle East and Africa
-
5. South America
- 5.1. Brazil
- 5.2. Argentina
- 5.3. Rest of South America
Oxygen Therapy Devices Industry REPORT HIGHLIGHTS
| Aspects | Details |
|---|---|
| Study Period | 2019-2033 |
| Base Year | 2024 |
| Estimated Year | 2025 |
| Forecast Period | 2025-2033 |
| Historical Period | 2019-2024 |
| Growth Rate | CAGR of 8.10% from 2019-2033 |
| Segmentation |
|
Table of Contents
- 1. Introduction
- 1.1. Research Scope
- 1.2. Market Segmentation
- 1.3. Research Methodology
- 1.4. Definitions and Assumptions
- 2. Executive Summary
- 2.1. Introduction
- 3. Market Dynamics
- 3.1. Introduction
- 3.2. Market Drivers
- 3.2.1. Rising Burden of Acute and Chronic Wounds; Widening Application of HBOT Devices in Cosmetic Procedures and Wound Healing; Technological Advancements
- 3.3. Market Restrains
- 3.3.1. High Cost of Hyperbaric Oxygen Therapy; Widening Gap Between Off-label Uses and FDA-approved Uses
- 3.4. Market Trends
- 3.4.1. Monoplace HBOT Devices Segment is Expected to Witness Significant Growth Over the Forecast Period
- 4. Market Factor Analysis
- 4.1. Porters Five Forces
- 4.2. Supply/Value Chain
- 4.3. PESTEL analysis
- 4.4. Market Entropy
- 4.5. Patent/Trademark Analysis
- 5. Global Oxygen Therapy Devices Industry Analysis, Insights and Forecast, 2019-2031
- 5.1. Market Analysis, Insights and Forecast - by Application
- 5.1.1. Decompression Sickness
- 5.1.2. Diabetic Foot Ulcers
- 5.1.3. Gas Embolism
- 5.1.4. Infection Treatment
- 5.1.5. Wound Healing
- 5.1.6. Other Applications
- 5.2. Market Analysis, Insights and Forecast - by Product Type
- 5.2.1. Monoplace HBOT Devices
- 5.2.2. Multiplace HBOT Devices
- 5.2.3. Topical HBOT Devices
- 5.3. Market Analysis, Insights and Forecast - by Region
- 5.3.1. North America
- 5.3.2. Europe
- 5.3.3. Asia Pacific
- 5.3.4. Middle East and Africa
- 5.3.5. South America
- 5.1. Market Analysis, Insights and Forecast - by Application
- 6. North America Oxygen Therapy Devices Industry Analysis, Insights and Forecast, 2019-2031
- 6.1. Market Analysis, Insights and Forecast - by Application
- 6.1.1. Decompression Sickness
- 6.1.2. Diabetic Foot Ulcers
- 6.1.3. Gas Embolism
- 6.1.4. Infection Treatment
- 6.1.5. Wound Healing
- 6.1.6. Other Applications
- 6.2. Market Analysis, Insights and Forecast - by Product Type
- 6.2.1. Monoplace HBOT Devices
- 6.2.2. Multiplace HBOT Devices
- 6.2.3. Topical HBOT Devices
- 6.1. Market Analysis, Insights and Forecast - by Application
- 7. Europe Oxygen Therapy Devices Industry Analysis, Insights and Forecast, 2019-2031
- 7.1. Market Analysis, Insights and Forecast - by Application
- 7.1.1. Decompression Sickness
- 7.1.2. Diabetic Foot Ulcers
- 7.1.3. Gas Embolism
- 7.1.4. Infection Treatment
- 7.1.5. Wound Healing
- 7.1.6. Other Applications
- 7.2. Market Analysis, Insights and Forecast - by Product Type
- 7.2.1. Monoplace HBOT Devices
- 7.2.2. Multiplace HBOT Devices
- 7.2.3. Topical HBOT Devices
- 7.1. Market Analysis, Insights and Forecast - by Application
- 8. Asia Pacific Oxygen Therapy Devices Industry Analysis, Insights and Forecast, 2019-2031
- 8.1. Market Analysis, Insights and Forecast - by Application
- 8.1.1. Decompression Sickness
- 8.1.2. Diabetic Foot Ulcers
- 8.1.3. Gas Embolism
- 8.1.4. Infection Treatment
- 8.1.5. Wound Healing
- 8.1.6. Other Applications
- 8.2. Market Analysis, Insights and Forecast - by Product Type
- 8.2.1. Monoplace HBOT Devices
- 8.2.2. Multiplace HBOT Devices
- 8.2.3. Topical HBOT Devices
- 8.1. Market Analysis, Insights and Forecast - by Application
- 9. Middle East and Africa Oxygen Therapy Devices Industry Analysis, Insights and Forecast, 2019-2031
- 9.1. Market Analysis, Insights and Forecast - by Application
- 9.1.1. Decompression Sickness
- 9.1.2. Diabetic Foot Ulcers
- 9.1.3. Gas Embolism
- 9.1.4. Infection Treatment
- 9.1.5. Wound Healing
- 9.1.6. Other Applications
- 9.2. Market Analysis, Insights and Forecast - by Product Type
- 9.2.1. Monoplace HBOT Devices
- 9.2.2. Multiplace HBOT Devices
- 9.2.3. Topical HBOT Devices
- 9.1. Market Analysis, Insights and Forecast - by Application
- 10. South America Oxygen Therapy Devices Industry Analysis, Insights and Forecast, 2019-2031
- 10.1. Market Analysis, Insights and Forecast - by Application
- 10.1.1. Decompression Sickness
- 10.1.2. Diabetic Foot Ulcers
- 10.1.3. Gas Embolism
- 10.1.4. Infection Treatment
- 10.1.5. Wound Healing
- 10.1.6. Other Applications
- 10.2. Market Analysis, Insights and Forecast - by Product Type
- 10.2.1. Monoplace HBOT Devices
- 10.2.2. Multiplace HBOT Devices
- 10.2.3. Topical HBOT Devices
- 10.1. Market Analysis, Insights and Forecast - by Application
- 11. North America Oxygen Therapy Devices Industry Analysis, Insights and Forecast, 2019-2031
- 11.1. Market Analysis, Insights and Forecast - By Country/Sub-region
- 11.1.1 United States
- 11.1.2 Canada
- 11.1.3 Mexico
- 12. Europe Oxygen Therapy Devices Industry Analysis, Insights and Forecast, 2019-2031
- 12.1. Market Analysis, Insights and Forecast - By Country/Sub-region
- 12.1.1 Germany
- 12.1.2 United Kingdom
- 12.1.3 France
- 12.1.4 Italy
- 12.1.5 Spain
- 12.1.6 Rest of Europe
- 13. Asia Pacific Oxygen Therapy Devices Industry Analysis, Insights and Forecast, 2019-2031
- 13.1. Market Analysis, Insights and Forecast - By Country/Sub-region
- 13.1.1 China
- 13.1.2 Japan
- 13.1.3 India
- 13.1.4 Australia
- 13.1.5 South Korea
- 13.1.6 Rest of Asia Pacific
- 14. Middle East and Africa Oxygen Therapy Devices Industry Analysis, Insights and Forecast, 2019-2031
- 14.1. Market Analysis, Insights and Forecast - By Country/Sub-region
- 14.1.1 GCC
- 14.1.2 South Africa
- 14.1.3 Rest of Middle East and Africa
- 15. South America Oxygen Therapy Devices Industry Analysis, Insights and Forecast, 2019-2031
- 15.1. Market Analysis, Insights and Forecast - By Country/Sub-region
- 15.1.1 Brazil
- 15.1.2 Argentina
- 15.1.3 Rest of South America
- 16. Competitive Analysis
- 16.1. Global Market Share Analysis 2024
- 16.2. Company Profiles
- 16.2.1 SOS Medical Group Ltd
- 16.2.1.1. Overview
- 16.2.1.2. Products
- 16.2.1.3. SWOT Analysis
- 16.2.1.4. Recent Developments
- 16.2.1.5. Financials (Based on Availability)
- 16.2.2 Hyperbaric SAC
- 16.2.2.1. Overview
- 16.2.2.2. Products
- 16.2.2.3. SWOT Analysis
- 16.2.2.4. Recent Developments
- 16.2.2.5. Financials (Based on Availability)
- 16.2.3 Environmental Tectonics Corporation
- 16.2.3.1. Overview
- 16.2.3.2. Products
- 16.2.3.3. SWOT Analysis
- 16.2.3.4. Recent Developments
- 16.2.3.5. Financials (Based on Availability)
- 16.2.4 Sechrist Industries Inc
- 16.2.4.1. Overview
- 16.2.4.2. Products
- 16.2.4.3. SWOT Analysis
- 16.2.4.4. Recent Developments
- 16.2.4.5. Financials (Based on Availability)
- 16.2.5 HYPERBARIC MODULAR SYSTEMS INC (HMS)
- 16.2.5.1. Overview
- 16.2.5.2. Products
- 16.2.5.3. SWOT Analysis
- 16.2.5.4. Recent Developments
- 16.2.5.5. Financials (Based on Availability)
- 16.2.6 Hearmec Co Ltd
- 16.2.6.1. Overview
- 16.2.6.2. Products
- 16.2.6.3. SWOT Analysis
- 16.2.6.4. Recent Developments
- 16.2.6.5. Financials (Based on Availability)
- 16.2.7 Fink Engineering
- 16.2.7.1. Overview
- 16.2.7.2. Products
- 16.2.7.3. SWOT Analysis
- 16.2.7.4. Recent Developments
- 16.2.7.5. Financials (Based on Availability)
- 16.2.8 HAUX-LIFE-SUPPORT GmbH
- 16.2.8.1. Overview
- 16.2.8.2. Products
- 16.2.8.3. SWOT Analysis
- 16.2.8.4. Recent Developments
- 16.2.8.5. Financials (Based on Availability)
- 16.2.9 Hpotech Hyperbaric Solutions
- 16.2.9.1. Overview
- 16.2.9.2. Products
- 16.2.9.3. SWOT Analysis
- 16.2.9.4. Recent Developments
- 16.2.9.5. Financials (Based on Availability)
- 16.2.1 SOS Medical Group Ltd
List of Figures
- Figure 1: Global Oxygen Therapy Devices Industry Revenue Breakdown (Million, %) by Region 2024 & 2032
- Figure 2: Global Oxygen Therapy Devices Industry Volume Breakdown (K Unit, %) by Region 2024 & 2032
- Figure 3: North America Oxygen Therapy Devices Industry Revenue (Million), by Country 2024 & 2032
- Figure 4: North America Oxygen Therapy Devices Industry Volume (K Unit), by Country 2024 & 2032
- Figure 5: North America Oxygen Therapy Devices Industry Revenue Share (%), by Country 2024 & 2032
- Figure 6: North America Oxygen Therapy Devices Industry Volume Share (%), by Country 2024 & 2032
- Figure 7: Europe Oxygen Therapy Devices Industry Revenue (Million), by Country 2024 & 2032
- Figure 8: Europe Oxygen Therapy Devices Industry Volume (K Unit), by Country 2024 & 2032
- Figure 9: Europe Oxygen Therapy Devices Industry Revenue Share (%), by Country 2024 & 2032
- Figure 10: Europe Oxygen Therapy Devices Industry Volume Share (%), by Country 2024 & 2032
- Figure 11: Asia Pacific Oxygen Therapy Devices Industry Revenue (Million), by Country 2024 & 2032
- Figure 12: Asia Pacific Oxygen Therapy Devices Industry Volume (K Unit), by Country 2024 & 2032
- Figure 13: Asia Pacific Oxygen Therapy Devices Industry Revenue Share (%), by Country 2024 & 2032
- Figure 14: Asia Pacific Oxygen Therapy Devices Industry Volume Share (%), by Country 2024 & 2032
- Figure 15: Middle East and Africa Oxygen Therapy Devices Industry Revenue (Million), by Country 2024 & 2032
- Figure 16: Middle East and Africa Oxygen Therapy Devices Industry Volume (K Unit), by Country 2024 & 2032
- Figure 17: Middle East and Africa Oxygen Therapy Devices Industry Revenue Share (%), by Country 2024 & 2032
- Figure 18: Middle East and Africa Oxygen Therapy Devices Industry Volume Share (%), by Country 2024 & 2032
- Figure 19: South America Oxygen Therapy Devices Industry Revenue (Million), by Country 2024 & 2032
- Figure 20: South America Oxygen Therapy Devices Industry Volume (K Unit), by Country 2024 & 2032
- Figure 21: South America Oxygen Therapy Devices Industry Revenue Share (%), by Country 2024 & 2032
- Figure 22: South America Oxygen Therapy Devices Industry Volume Share (%), by Country 2024 & 2032
- Figure 23: North America Oxygen Therapy Devices Industry Revenue (Million), by Application 2024 & 2032
- Figure 24: North America Oxygen Therapy Devices Industry Volume (K Unit), by Application 2024 & 2032
- Figure 25: North America Oxygen Therapy Devices Industry Revenue Share (%), by Application 2024 & 2032
- Figure 26: North America Oxygen Therapy Devices Industry Volume Share (%), by Application 2024 & 2032
- Figure 27: North America Oxygen Therapy Devices Industry Revenue (Million), by Product Type 2024 & 2032
- Figure 28: North America Oxygen Therapy Devices Industry Volume (K Unit), by Product Type 2024 & 2032
- Figure 29: North America Oxygen Therapy Devices Industry Revenue Share (%), by Product Type 2024 & 2032
- Figure 30: North America Oxygen Therapy Devices Industry Volume Share (%), by Product Type 2024 & 2032
- Figure 31: North America Oxygen Therapy Devices Industry Revenue (Million), by Country 2024 & 2032
- Figure 32: North America Oxygen Therapy Devices Industry Volume (K Unit), by Country 2024 & 2032
- Figure 33: North America Oxygen Therapy Devices Industry Revenue Share (%), by Country 2024 & 2032
- Figure 34: North America Oxygen Therapy Devices Industry Volume Share (%), by Country 2024 & 2032
- Figure 35: Europe Oxygen Therapy Devices Industry Revenue (Million), by Application 2024 & 2032
- Figure 36: Europe Oxygen Therapy Devices Industry Volume (K Unit), by Application 2024 & 2032
- Figure 37: Europe Oxygen Therapy Devices Industry Revenue Share (%), by Application 2024 & 2032
- Figure 38: Europe Oxygen Therapy Devices Industry Volume Share (%), by Application 2024 & 2032
- Figure 39: Europe Oxygen Therapy Devices Industry Revenue (Million), by Product Type 2024 & 2032
- Figure 40: Europe Oxygen Therapy Devices Industry Volume (K Unit), by Product Type 2024 & 2032
- Figure 41: Europe Oxygen Therapy Devices Industry Revenue Share (%), by Product Type 2024 & 2032
- Figure 42: Europe Oxygen Therapy Devices Industry Volume Share (%), by Product Type 2024 & 2032
- Figure 43: Europe Oxygen Therapy Devices Industry Revenue (Million), by Country 2024 & 2032
- Figure 44: Europe Oxygen Therapy Devices Industry Volume (K Unit), by Country 2024 & 2032
- Figure 45: Europe Oxygen Therapy Devices Industry Revenue Share (%), by Country 2024 & 2032
- Figure 46: Europe Oxygen Therapy Devices Industry Volume Share (%), by Country 2024 & 2032
- Figure 47: Asia Pacific Oxygen Therapy Devices Industry Revenue (Million), by Application 2024 & 2032
- Figure 48: Asia Pacific Oxygen Therapy Devices Industry Volume (K Unit), by Application 2024 & 2032
- Figure 49: Asia Pacific Oxygen Therapy Devices Industry Revenue Share (%), by Application 2024 & 2032
- Figure 50: Asia Pacific Oxygen Therapy Devices Industry Volume Share (%), by Application 2024 & 2032
- Figure 51: Asia Pacific Oxygen Therapy Devices Industry Revenue (Million), by Product Type 2024 & 2032
- Figure 52: Asia Pacific Oxygen Therapy Devices Industry Volume (K Unit), by Product Type 2024 & 2032
- Figure 53: Asia Pacific Oxygen Therapy Devices Industry Revenue Share (%), by Product Type 2024 & 2032
- Figure 54: Asia Pacific Oxygen Therapy Devices Industry Volume Share (%), by Product Type 2024 & 2032
- Figure 55: Asia Pacific Oxygen Therapy Devices Industry Revenue (Million), by Country 2024 & 2032
- Figure 56: Asia Pacific Oxygen Therapy Devices Industry Volume (K Unit), by Country 2024 & 2032
- Figure 57: Asia Pacific Oxygen Therapy Devices Industry Revenue Share (%), by Country 2024 & 2032
- Figure 58: Asia Pacific Oxygen Therapy Devices Industry Volume Share (%), by Country 2024 & 2032
- Figure 59: Middle East and Africa Oxygen Therapy Devices Industry Revenue (Million), by Application 2024 & 2032
- Figure 60: Middle East and Africa Oxygen Therapy Devices Industry Volume (K Unit), by Application 2024 & 2032
- Figure 61: Middle East and Africa Oxygen Therapy Devices Industry Revenue Share (%), by Application 2024 & 2032
- Figure 62: Middle East and Africa Oxygen Therapy Devices Industry Volume Share (%), by Application 2024 & 2032
- Figure 63: Middle East and Africa Oxygen Therapy Devices Industry Revenue (Million), by Product Type 2024 & 2032
- Figure 64: Middle East and Africa Oxygen Therapy Devices Industry Volume (K Unit), by Product Type 2024 & 2032
- Figure 65: Middle East and Africa Oxygen Therapy Devices Industry Revenue Share (%), by Product Type 2024 & 2032
- Figure 66: Middle East and Africa Oxygen Therapy Devices Industry Volume Share (%), by Product Type 2024 & 2032
- Figure 67: Middle East and Africa Oxygen Therapy Devices Industry Revenue (Million), by Country 2024 & 2032
- Figure 68: Middle East and Africa Oxygen Therapy Devices Industry Volume (K Unit), by Country 2024 & 2032
- Figure 69: Middle East and Africa Oxygen Therapy Devices Industry Revenue Share (%), by Country 2024 & 2032
- Figure 70: Middle East and Africa Oxygen Therapy Devices Industry Volume Share (%), by Country 2024 & 2032
- Figure 71: South America Oxygen Therapy Devices Industry Revenue (Million), by Application 2024 & 2032
- Figure 72: South America Oxygen Therapy Devices Industry Volume (K Unit), by Application 2024 & 2032
- Figure 73: South America Oxygen Therapy Devices Industry Revenue Share (%), by Application 2024 & 2032
- Figure 74: South America Oxygen Therapy Devices Industry Volume Share (%), by Application 2024 & 2032
- Figure 75: South America Oxygen Therapy Devices Industry Revenue (Million), by Product Type 2024 & 2032
- Figure 76: South America Oxygen Therapy Devices Industry Volume (K Unit), by Product Type 2024 & 2032
- Figure 77: South America Oxygen Therapy Devices Industry Revenue Share (%), by Product Type 2024 & 2032
- Figure 78: South America Oxygen Therapy Devices Industry Volume Share (%), by Product Type 2024 & 2032
- Figure 79: South America Oxygen Therapy Devices Industry Revenue (Million), by Country 2024 & 2032
- Figure 80: South America Oxygen Therapy Devices Industry Volume (K Unit), by Country 2024 & 2032
- Figure 81: South America Oxygen Therapy Devices Industry Revenue Share (%), by Country 2024 & 2032
- Figure 82: South America Oxygen Therapy Devices Industry Volume Share (%), by Country 2024 & 2032
List of Tables
- Table 1: Global Oxygen Therapy Devices Industry Revenue Million Forecast, by Region 2019 & 2032
- Table 2: Global Oxygen Therapy Devices Industry Volume K Unit Forecast, by Region 2019 & 2032
- Table 3: Global Oxygen Therapy Devices Industry Revenue Million Forecast, by Application 2019 & 2032
- Table 4: Global Oxygen Therapy Devices Industry Volume K Unit Forecast, by Application 2019 & 2032
- Table 5: Global Oxygen Therapy Devices Industry Revenue Million Forecast, by Product Type 2019 & 2032
- Table 6: Global Oxygen Therapy Devices Industry Volume K Unit Forecast, by Product Type 2019 & 2032
- Table 7: Global Oxygen Therapy Devices Industry Revenue Million Forecast, by Region 2019 & 2032
- Table 8: Global Oxygen Therapy Devices Industry Volume K Unit Forecast, by Region 2019 & 2032
- Table 9: Global Oxygen Therapy Devices Industry Revenue Million Forecast, by Country 2019 & 2032
- Table 10: Global Oxygen Therapy Devices Industry Volume K Unit Forecast, by Country 2019 & 2032
- Table 11: United States Oxygen Therapy Devices Industry Revenue (Million) Forecast, by Application 2019 & 2032
- Table 12: United States Oxygen Therapy Devices Industry Volume (K Unit) Forecast, by Application 2019 & 2032
- Table 13: Canada Oxygen Therapy Devices Industry Revenue (Million) Forecast, by Application 2019 & 2032
- Table 14: Canada Oxygen Therapy Devices Industry Volume (K Unit) Forecast, by Application 2019 & 2032
- Table 15: Mexico Oxygen Therapy Devices Industry Revenue (Million) Forecast, by Application 2019 & 2032
- Table 16: Mexico Oxygen Therapy Devices Industry Volume (K Unit) Forecast, by Application 2019 & 2032
- Table 17: Global Oxygen Therapy Devices Industry Revenue Million Forecast, by Country 2019 & 2032
- Table 18: Global Oxygen Therapy Devices Industry Volume K Unit Forecast, by Country 2019 & 2032
- Table 19: Germany Oxygen Therapy Devices Industry Revenue (Million) Forecast, by Application 2019 & 2032
- Table 20: Germany Oxygen Therapy Devices Industry Volume (K Unit) Forecast, by Application 2019 & 2032
- Table 21: United Kingdom Oxygen Therapy Devices Industry Revenue (Million) Forecast, by Application 2019 & 2032
- Table 22: United Kingdom Oxygen Therapy Devices Industry Volume (K Unit) Forecast, by Application 2019 & 2032
- Table 23: France Oxygen Therapy Devices Industry Revenue (Million) Forecast, by Application 2019 & 2032
- Table 24: France Oxygen Therapy Devices Industry Volume (K Unit) Forecast, by Application 2019 & 2032
- Table 25: Italy Oxygen Therapy Devices Industry Revenue (Million) Forecast, by Application 2019 & 2032
- Table 26: Italy Oxygen Therapy Devices Industry Volume (K Unit) Forecast, by Application 2019 & 2032
- Table 27: Spain Oxygen Therapy Devices Industry Revenue (Million) Forecast, by Application 2019 & 2032
- Table 28: Spain Oxygen Therapy Devices Industry Volume (K Unit) Forecast, by Application 2019 & 2032
- Table 29: Rest of Europe Oxygen Therapy Devices Industry Revenue (Million) Forecast, by Application 2019 & 2032
- Table 30: Rest of Europe Oxygen Therapy Devices Industry Volume (K Unit) Forecast, by Application 2019 & 2032
- Table 31: Global Oxygen Therapy Devices Industry Revenue Million Forecast, by Country 2019 & 2032
- Table 32: Global Oxygen Therapy Devices Industry Volume K Unit Forecast, by Country 2019 & 2032
- Table 33: China Oxygen Therapy Devices Industry Revenue (Million) Forecast, by Application 2019 & 2032
- Table 34: China Oxygen Therapy Devices Industry Volume (K Unit) Forecast, by Application 2019 & 2032
- Table 35: Japan Oxygen Therapy Devices Industry Revenue (Million) Forecast, by Application 2019 & 2032
- Table 36: Japan Oxygen Therapy Devices Industry Volume (K Unit) Forecast, by Application 2019 & 2032
- Table 37: India Oxygen Therapy Devices Industry Revenue (Million) Forecast, by Application 2019 & 2032
- Table 38: India Oxygen Therapy Devices Industry Volume (K Unit) Forecast, by Application 2019 & 2032
- Table 39: Australia Oxygen Therapy Devices Industry Revenue (Million) Forecast, by Application 2019 & 2032
- Table 40: Australia Oxygen Therapy Devices Industry Volume (K Unit) Forecast, by Application 2019 & 2032
- Table 41: South Korea Oxygen Therapy Devices Industry Revenue (Million) Forecast, by Application 2019 & 2032
- Table 42: South Korea Oxygen Therapy Devices Industry Volume (K Unit) Forecast, by Application 2019 & 2032
- Table 43: Rest of Asia Pacific Oxygen Therapy Devices Industry Revenue (Million) Forecast, by Application 2019 & 2032
- Table 44: Rest of Asia Pacific Oxygen Therapy Devices Industry Volume (K Unit) Forecast, by Application 2019 & 2032
- Table 45: Global Oxygen Therapy Devices Industry Revenue Million Forecast, by Country 2019 & 2032
- Table 46: Global Oxygen Therapy Devices Industry Volume K Unit Forecast, by Country 2019 & 2032
- Table 47: GCC Oxygen Therapy Devices Industry Revenue (Million) Forecast, by Application 2019 & 2032
- Table 48: GCC Oxygen Therapy Devices Industry Volume (K Unit) Forecast, by Application 2019 & 2032
- Table 49: South Africa Oxygen Therapy Devices Industry Revenue (Million) Forecast, by Application 2019 & 2032
- Table 50: South Africa Oxygen Therapy Devices Industry Volume (K Unit) Forecast, by Application 2019 & 2032
- Table 51: Rest of Middle East and Africa Oxygen Therapy Devices Industry Revenue (Million) Forecast, by Application 2019 & 2032
- Table 52: Rest of Middle East and Africa Oxygen Therapy Devices Industry Volume (K Unit) Forecast, by Application 2019 & 2032
- Table 53: Global Oxygen Therapy Devices Industry Revenue Million Forecast, by Country 2019 & 2032
- Table 54: Global Oxygen Therapy Devices Industry Volume K Unit Forecast, by Country 2019 & 2032
- Table 55: Brazil Oxygen Therapy Devices Industry Revenue (Million) Forecast, by Application 2019 & 2032
- Table 56: Brazil Oxygen Therapy Devices Industry Volume (K Unit) Forecast, by Application 2019 & 2032
- Table 57: Argentina Oxygen Therapy Devices Industry Revenue (Million) Forecast, by Application 2019 & 2032
- Table 58: Argentina Oxygen Therapy Devices Industry Volume (K Unit) Forecast, by Application 2019 & 2032
- Table 59: Rest of South America Oxygen Therapy Devices Industry Revenue (Million) Forecast, by Application 2019 & 2032
- Table 60: Rest of South America Oxygen Therapy Devices Industry Volume (K Unit) Forecast, by Application 2019 & 2032
- Table 61: Global Oxygen Therapy Devices Industry Revenue Million Forecast, by Application 2019 & 2032
- Table 62: Global Oxygen Therapy Devices Industry Volume K Unit Forecast, by Application 2019 & 2032
- Table 63: Global Oxygen Therapy Devices Industry Revenue Million Forecast, by Product Type 2019 & 2032
- Table 64: Global Oxygen Therapy Devices Industry Volume K Unit Forecast, by Product Type 2019 & 2032
- Table 65: Global Oxygen Therapy Devices Industry Revenue Million Forecast, by Country 2019 & 2032
- Table 66: Global Oxygen Therapy Devices Industry Volume K Unit Forecast, by Country 2019 & 2032
- Table 67: United States Oxygen Therapy Devices Industry Revenue (Million) Forecast, by Application 2019 & 2032
- Table 68: United States Oxygen Therapy Devices Industry Volume (K Unit) Forecast, by Application 2019 & 2032
- Table 69: Canada Oxygen Therapy Devices Industry Revenue (Million) Forecast, by Application 2019 & 2032
- Table 70: Canada Oxygen Therapy Devices Industry Volume (K Unit) Forecast, by Application 2019 & 2032
- Table 71: Mexico Oxygen Therapy Devices Industry Revenue (Million) Forecast, by Application 2019 & 2032
- Table 72: Mexico Oxygen Therapy Devices Industry Volume (K Unit) Forecast, by Application 2019 & 2032
- Table 73: Global Oxygen Therapy Devices Industry Revenue Million Forecast, by Application 2019 & 2032
- Table 74: Global Oxygen Therapy Devices Industry Volume K Unit Forecast, by Application 2019 & 2032
- Table 75: Global Oxygen Therapy Devices Industry Revenue Million Forecast, by Product Type 2019 & 2032
- Table 76: Global Oxygen Therapy Devices Industry Volume K Unit Forecast, by Product Type 2019 & 2032
- Table 77: Global Oxygen Therapy Devices Industry Revenue Million Forecast, by Country 2019 & 2032
- Table 78: Global Oxygen Therapy Devices Industry Volume K Unit Forecast, by Country 2019 & 2032
- Table 79: Germany Oxygen Therapy Devices Industry Revenue (Million) Forecast, by Application 2019 & 2032
- Table 80: Germany Oxygen Therapy Devices Industry Volume (K Unit) Forecast, by Application 2019 & 2032
- Table 81: United Kingdom Oxygen Therapy Devices Industry Revenue (Million) Forecast, by Application 2019 & 2032
- Table 82: United Kingdom Oxygen Therapy Devices Industry Volume (K Unit) Forecast, by Application 2019 & 2032
- Table 83: France Oxygen Therapy Devices Industry Revenue (Million) Forecast, by Application 2019 & 2032
- Table 84: France Oxygen Therapy Devices Industry Volume (K Unit) Forecast, by Application 2019 & 2032
- Table 85: Italy Oxygen Therapy Devices Industry Revenue (Million) Forecast, by Application 2019 & 2032
- Table 86: Italy Oxygen Therapy Devices Industry Volume (K Unit) Forecast, by Application 2019 & 2032
- Table 87: Spain Oxygen Therapy Devices Industry Revenue (Million) Forecast, by Application 2019 & 2032
- Table 88: Spain Oxygen Therapy Devices Industry Volume (K Unit) Forecast, by Application 2019 & 2032
- Table 89: Rest of Europe Oxygen Therapy Devices Industry Revenue (Million) Forecast, by Application 2019 & 2032
- Table 90: Rest of Europe Oxygen Therapy Devices Industry Volume (K Unit) Forecast, by Application 2019 & 2032
- Table 91: Global Oxygen Therapy Devices Industry Revenue Million Forecast, by Application 2019 & 2032
- Table 92: Global Oxygen Therapy Devices Industry Volume K Unit Forecast, by Application 2019 & 2032
- Table 93: Global Oxygen Therapy Devices Industry Revenue Million Forecast, by Product Type 2019 & 2032
- Table 94: Global Oxygen Therapy Devices Industry Volume K Unit Forecast, by Product Type 2019 & 2032
- Table 95: Global Oxygen Therapy Devices Industry Revenue Million Forecast, by Country 2019 & 2032
- Table 96: Global Oxygen Therapy Devices Industry Volume K Unit Forecast, by Country 2019 & 2032
- Table 97: China Oxygen Therapy Devices Industry Revenue (Million) Forecast, by Application 2019 & 2032
- Table 98: China Oxygen Therapy Devices Industry Volume (K Unit) Forecast, by Application 2019 & 2032
- Table 99: Japan Oxygen Therapy Devices Industry Revenue (Million) Forecast, by Application 2019 & 2032
- Table 100: Japan Oxygen Therapy Devices Industry Volume (K Unit) Forecast, by Application 2019 & 2032
- Table 101: India Oxygen Therapy Devices Industry Revenue (Million) Forecast, by Application 2019 & 2032
- Table 102: India Oxygen Therapy Devices Industry Volume (K Unit) Forecast, by Application 2019 & 2032
- Table 103: Australia Oxygen Therapy Devices Industry Revenue (Million) Forecast, by Application 2019 & 2032
- Table 104: Australia Oxygen Therapy Devices Industry Volume (K Unit) Forecast, by Application 2019 & 2032
- Table 105: South Korea Oxygen Therapy Devices Industry Revenue (Million) Forecast, by Application 2019 & 2032
- Table 106: South Korea Oxygen Therapy Devices Industry Volume (K Unit) Forecast, by Application 2019 & 2032
- Table 107: Rest of Asia Pacific Oxygen Therapy Devices Industry Revenue (Million) Forecast, by Application 2019 & 2032
- Table 108: Rest of Asia Pacific Oxygen Therapy Devices Industry Volume (K Unit) Forecast, by Application 2019 & 2032
- Table 109: Global Oxygen Therapy Devices Industry Revenue Million Forecast, by Application 2019 & 2032
- Table 110: Global Oxygen Therapy Devices Industry Volume K Unit Forecast, by Application 2019 & 2032
- Table 111: Global Oxygen Therapy Devices Industry Revenue Million Forecast, by Product Type 2019 & 2032
- Table 112: Global Oxygen Therapy Devices Industry Volume K Unit Forecast, by Product Type 2019 & 2032
- Table 113: Global Oxygen Therapy Devices Industry Revenue Million Forecast, by Country 2019 & 2032
- Table 114: Global Oxygen Therapy Devices Industry Volume K Unit Forecast, by Country 2019 & 2032
- Table 115: GCC Oxygen Therapy Devices Industry Revenue (Million) Forecast, by Application 2019 & 2032
- Table 116: GCC Oxygen Therapy Devices Industry Volume (K Unit) Forecast, by Application 2019 & 2032
- Table 117: South Africa Oxygen Therapy Devices Industry Revenue (Million) Forecast, by Application 2019 & 2032
- Table 118: South Africa Oxygen Therapy Devices Industry Volume (K Unit) Forecast, by Application 2019 & 2032
- Table 119: Rest of Middle East and Africa Oxygen Therapy Devices Industry Revenue (Million) Forecast, by Application 2019 & 2032
- Table 120: Rest of Middle East and Africa Oxygen Therapy Devices Industry Volume (K Unit) Forecast, by Application 2019 & 2032
- Table 121: Global Oxygen Therapy Devices Industry Revenue Million Forecast, by Application 2019 & 2032
- Table 122: Global Oxygen Therapy Devices Industry Volume K Unit Forecast, by Application 2019 & 2032
- Table 123: Global Oxygen Therapy Devices Industry Revenue Million Forecast, by Product Type 2019 & 2032
- Table 124: Global Oxygen Therapy Devices Industry Volume K Unit Forecast, by Product Type 2019 & 2032
- Table 125: Global Oxygen Therapy Devices Industry Revenue Million Forecast, by Country 2019 & 2032
- Table 126: Global Oxygen Therapy Devices Industry Volume K Unit Forecast, by Country 2019 & 2032
- Table 127: Brazil Oxygen Therapy Devices Industry Revenue (Million) Forecast, by Application 2019 & 2032
- Table 128: Brazil Oxygen Therapy Devices Industry Volume (K Unit) Forecast, by Application 2019 & 2032
- Table 129: Argentina Oxygen Therapy Devices Industry Revenue (Million) Forecast, by Application 2019 & 2032
- Table 130: Argentina Oxygen Therapy Devices Industry Volume (K Unit) Forecast, by Application 2019 & 2032
- Table 131: Rest of South America Oxygen Therapy Devices Industry Revenue (Million) Forecast, by Application 2019 & 2032
- Table 132: Rest of South America Oxygen Therapy Devices Industry Volume (K Unit) Forecast, by Application 2019 & 2032
Frequently Asked Questions
1. What is the projected Compound Annual Growth Rate (CAGR) of the Oxygen Therapy Devices Industry?
The projected CAGR is approximately 8.10%.
2. Which companies are prominent players in the Oxygen Therapy Devices Industry?
Key companies in the market include SOS Medical Group Ltd, Hyperbaric SAC, Environmental Tectonics Corporation, Sechrist Industries Inc, HYPERBARIC MODULAR SYSTEMS INC (HMS), Hearmec Co Ltd, Fink Engineering, HAUX-LIFE-SUPPORT GmbH, Hpotech Hyperbaric Solutions.
3. What are the main segments of the Oxygen Therapy Devices Industry?
The market segments include Application, Product Type.
4. Can you provide details about the market size?
The market size is estimated to be USD XX Million as of 2022.
5. What are some drivers contributing to market growth?
Rising Burden of Acute and Chronic Wounds; Widening Application of HBOT Devices in Cosmetic Procedures and Wound Healing; Technological Advancements.
6. What are the notable trends driving market growth?
Monoplace HBOT Devices Segment is Expected to Witness Significant Growth Over the Forecast Period.
7. Are there any restraints impacting market growth?
High Cost of Hyperbaric Oxygen Therapy; Widening Gap Between Off-label Uses and FDA-approved Uses.
8. Can you provide examples of recent developments in the market?
February 2023: Maui Health opened a new outpatient facility in Hawaii that will offer a comprehensive approach for patients with nonhealing wounds, with treatments including hyperbaric oxygen therapy.
9. What pricing options are available for accessing the report?
Pricing options include single-user, multi-user, and enterprise licenses priced at USD 4750, USD 5250, and USD 8750 respectively.
10. Is the market size provided in terms of value or volume?
The market size is provided in terms of value, measured in Million and volume, measured in K Unit.
11. Are there any specific market keywords associated with the report?
Yes, the market keyword associated with the report is "Oxygen Therapy Devices Industry," which aids in identifying and referencing the specific market segment covered.
12. How do I determine which pricing option suits my needs best?
The pricing options vary based on user requirements and access needs. Individual users may opt for single-user licenses, while businesses requiring broader access may choose multi-user or enterprise licenses for cost-effective access to the report.
13. Are there any additional resources or data provided in the Oxygen Therapy Devices Industry report?
While the report offers comprehensive insights, it's advisable to review the specific contents or supplementary materials provided to ascertain if additional resources or data are available.
14. How can I stay updated on further developments or reports in the Oxygen Therapy Devices Industry?
To stay informed about further developments, trends, and reports in the Oxygen Therapy Devices Industry, consider subscribing to industry newsletters, following relevant companies and organizations, or regularly checking reputable industry news sources and publications.
Methodology
Step 1 - Identification of Relevant Samples Size from Population Database


Step 2 - Approaches for Defining Global Market Size (Value, Volume* & Price*)

Note*: In applicable scenarios
Step 3 - Data Sources
Primary Research
- Web Analytics
- Survey Reports
- Research Institute
- Latest Research Reports
- Opinion Leaders
Secondary Research
- Annual Reports
- White Paper
- Latest Press Release
- Industry Association
- Paid Database
- Investor Presentations

Step 4 - Data Triangulation
Involves using different sources of information in order to increase the validity of a study
These sources are likely to be stakeholders in a program - participants, other researchers, program staff, other community members, and so on.
Then we put all data in single framework & apply various statistical tools to find out the dynamic on the market.
During the analysis stage, feedback from the stakeholder groups would be compared to determine areas of agreement as well as areas of divergence
