

Key Insights
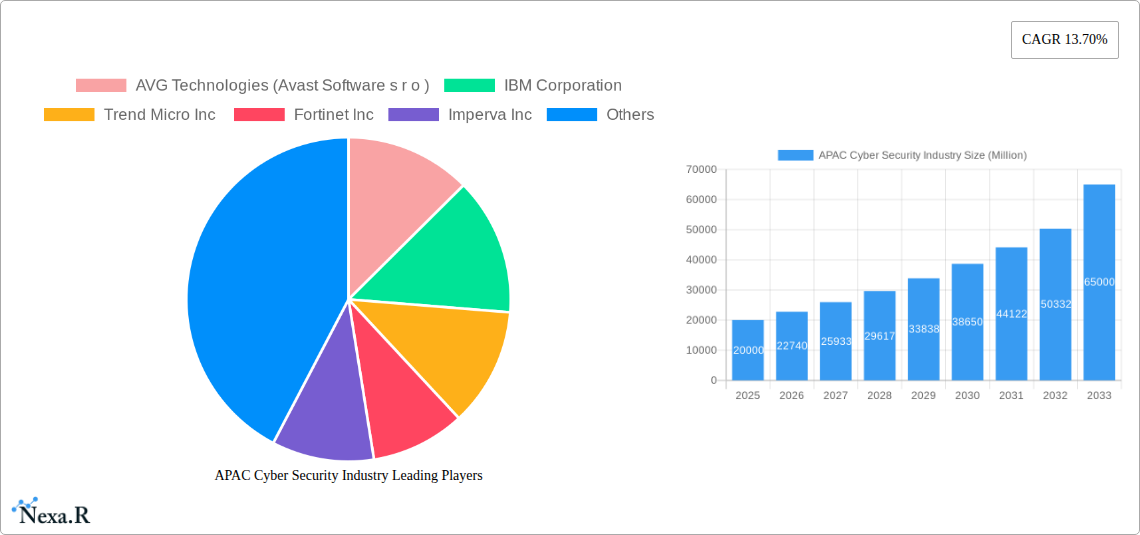
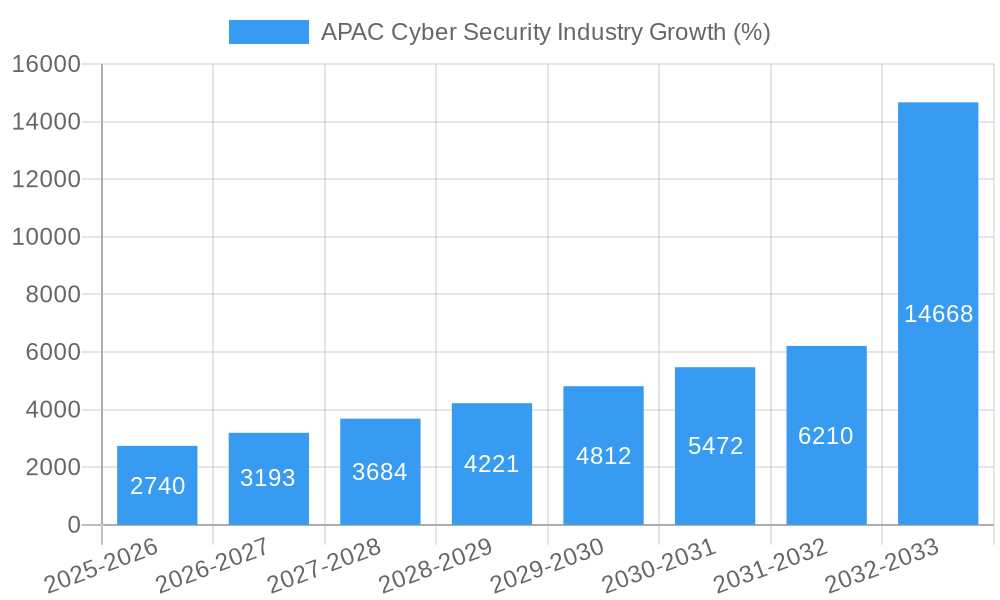
The Asia-Pacific (APAC) cybersecurity market, valued at approximately $20 billion in 2025, is experiencing robust growth, projected to reach $65 billion by 2033, exhibiting a Compound Annual Growth Rate (CAGR) of 13.70%. This expansion is fueled by several key drivers. The region's rapidly increasing digitalization, coupled with a surge in internet and mobile penetration, creates a fertile ground for cyber threats. Furthermore, the rising adoption of cloud computing, IoT devices, and the increasing sophistication of cyberattacks necessitate robust cybersecurity solutions. Governments across APAC are also actively investing in cybersecurity infrastructure and regulations, further stimulating market growth. Key trends include a shift towards cloud-based security solutions, the growing adoption of Artificial Intelligence (AI) and Machine Learning (ML) for threat detection, and increased focus on proactive security measures such as threat intelligence and vulnerability management. While the market faces challenges like a shortage of skilled cybersecurity professionals and the complexities of managing diverse cybersecurity solutions across heterogeneous environments, the overall growth trajectory remains strongly positive, driven by the region's relentless technological advancement and growing awareness of cyber risks.
Within the APAC region, China, India, Japan, and South Korea represent significant market segments. China and India, with their vast populations and burgeoning digital economies, are leading the charge. The strong government support for digital infrastructure and initiatives to strengthen cybersecurity posture in these countries significantly contributes to their dominance in the market. Japan and South Korea, known for their technological advancements and robust IT infrastructure, are also key contributors. The "Rest of Asia Pacific" segment, encompassing emerging economies in Southeast Asia and Oceania, presents a substantial growth opportunity, particularly as these nations continue to invest in digital transformation and adopt more advanced technologies. The market segmentation by product type (solutions and services) and deployment (on-cloud and on-premises) highlights the evolving needs and preferences of organizations in the region. The shift towards cloud-based solutions is particularly notable, driven by its scalability, cost-effectiveness, and ease of management.
This comprehensive report provides a detailed analysis of the Asia-Pacific (APAC) cybersecurity industry, covering market dynamics, growth trends, dominant segments, and key players. With a study period spanning 2019-2033, a base year of 2025, and a forecast period of 2025-2033, this report offers invaluable insights for industry professionals, investors, and strategic decision-makers. The report delves into parent and child markets, offering granular data on market segments by end-user industry, country, product type, and deployment model.
APAC Cyber Security Industry Market Dynamics & Structure
This section analyzes the competitive landscape of the APAC cybersecurity market, examining market concentration, technological innovation, regulatory frameworks, competitive substitutes, end-user demographics, and merger & acquisition (M&A) trends. The APAC cybersecurity market is characterized by a moderately concentrated structure with several key players holding significant market share. However, the market is also witnessing increased competition from smaller, niche players offering specialized solutions.
- Market Concentration: The top 5 players hold approximately xx% of the market share in 2025.
- Technological Innovation: The market is driven by continuous advancements in areas such as AI, machine learning, and cloud security. However, high R&D costs and talent acquisition challenges represent significant barriers to innovation.
- Regulatory Frameworks: Varying data privacy regulations across APAC countries impact market dynamics and create complexities for vendors.
- Competitive Substitutes: Open-source security tools pose a competitive threat to commercial offerings, particularly for smaller organizations.
- End-User Demographics: The increasing adoption of digital technologies across various sectors like BFSI and healthcare fuels demand for robust cybersecurity solutions.
- M&A Trends: The number of M&A deals in the APAC cybersecurity sector increased by xx% from 2020 to 2024, primarily driven by consolidation and expansion efforts of larger players. The total deal value in 2024 reached approximately xx million.
APAC Cyber Security Industry Growth Trends & Insights
The APAC cybersecurity market is experiencing robust growth, driven by factors such as increasing cyber threats, rising digital adoption, and stringent government regulations. The market size was valued at xx million in 2024 and is projected to reach xx million by 2033, exhibiting a Compound Annual Growth Rate (CAGR) of xx% during the forecast period. This growth is fueled by expanding internet and mobile penetration, heightened awareness of data breaches, and increased investment in cybersecurity infrastructure across diverse sectors. Adoption rates are particularly high in countries with advanced digital economies like Japan and South Korea. Technological disruptions, like the widespread adoption of cloud computing and IoT, are constantly reshaping the market. Consumer behavior shifts toward greater demand for user-friendly and integrated security solutions.
Dominant Regions, Countries, or Segments in APAC Cyber Security Industry
China, India, and Japan are the dominant countries in the APAC cybersecurity market, representing a combined market share of xx% in 2025. Within market segments:
By End-user Industry: The Banking, Financial Services, and Insurance (BFSI) sector exhibits the highest growth rate, followed by IT and Telecommunication. The Aerospace and Defense sector also shows significant potential.
By Country: China leads in market size due to its large digital economy and government initiatives. India is experiencing rapid growth driven by increasing internet penetration and digital transformation. Japan benefits from a highly developed IT infrastructure.
By Product Type: Solutions (including software and hardware) constitute the largest segment, with services (managed security services, consulting) showing strong growth potential.
By Deployment: On-cloud deployment is gaining momentum, driven by the increasing adoption of cloud-based services and infrastructure.
Key Drivers:
- Government regulations promoting cybersecurity adoption.
- Growing digital infrastructure and increasing internet penetration.
- Rising investments in cybersecurity by organizations across different sectors.
- Increased awareness of cyber threats and data breaches.
APAC Cyber Security Industry Product Landscape
The APAC cybersecurity market offers a diverse range of products, encompassing endpoint protection, network security, cloud security, data security, and identity and access management (IAM) solutions. Significant innovations include AI-powered threat detection and response systems, advanced threat intelligence platforms, and cloud-native security solutions. Products are differentiated by their unique selling propositions (USPs), such as ease of use, advanced analytics capabilities, and comprehensive protection against evolving threats. Technological advancements, including automation and orchestration, are enabling more efficient and effective security operations.
Key Drivers, Barriers & Challenges in APAC Cyber Security Industry
Key Drivers: Increasing cyberattacks, government regulations (like the GDPR and similar data privacy laws), and rising digital transformation initiatives across various sectors are major drivers.
Key Challenges:
- Supply chain vulnerabilities: Disruptions in the global supply chain affect the availability and timely delivery of cybersecurity products.
- Regulatory hurdles: Navigating the diverse and evolving regulatory landscape across different APAC countries presents a significant challenge.
- Competitive pressures: Intense competition among established players and new entrants impacts pricing and profitability. The market is experiencing price erosion in some segments.
Emerging Opportunities in APAC Cyber Security Industry
The APAC cybersecurity market presents substantial opportunities in areas such as:
- Expansion into underserved markets: Many smaller businesses and organizations in rural areas lack adequate cybersecurity protection.
- Development of specialized solutions: The need for cybersecurity solutions tailored to specific industry needs, like IoT security in manufacturing or healthcare data protection.
- Leveraging AI and machine learning: AI-driven threat intelligence and automation promise enhanced security effectiveness and reduced operational costs.
Growth Accelerators in the APAC Cyber Security Industry Industry
Strategic partnerships between technology providers and managed security service providers (MSSPs) are driving market expansion. Furthermore, technological breakthroughs in areas such as AI and blockchain are bolstering the development of innovative cybersecurity solutions, creating substantial growth opportunities. The increasing adoption of cloud computing is also contributing to the expansion of the market.
Key Players Shaping the APAC Cyber Security Industry Market
- AVG Technologies (Avast Software s r o )
- IBM Corporation
- Trend Micro Inc
- Fortinet Inc
- Imperva Inc
- Check Point Software Technologies Ltd
- Cisco Systems Inc
- Broadcom Inc
- Proofpoint Inc
- Rapid7 Inc
- Cyber Ark Software Ltd
- Intel Security (Intel Corporation)
- Dell Technologies Inc
- Palo Alto Networks Inc
Notable Milestones in APAC Cyber Security Industry Sector
- December 2022: VI Business launched VI Secure, a comprehensive cybersecurity portfolio in India.
- July 2022: Cyware and CyberQ Group partnered to strengthen cybersecurity capabilities in the APAC region.
In-Depth APAC Cyber Security Industry Market Outlook
The APAC cybersecurity market is poised for continued strong growth, driven by persistent digital transformation, escalating cyber threats, and supportive government policies. Strategic investments in advanced security technologies and talent development are crucial for capitalizing on the numerous opportunities in this dynamic market. Companies that can adapt to evolving security threats and offer innovative solutions will be best positioned to succeed.
APAC Cyber Security Industry Segmentation
-
1. Product Type
-
1.1. Solutions
- 1.1.1. Identity and Access Management
- 1.1.2. Threat D
- 1.1.3. Security and Vulnerability Management
- 1.1.4. DDoS Mitigation
- 1.1.5. Next Generation Firewall
- 1.1.6. IDS/IPS
- 1.1.7. Security Information and Event Management
- 1.1.8. Other Solutions
- 1.2. Services
-
1.1. Solutions
-
2. Deployment
- 2.1. On-cloud
- 2.2. On-premises
-
3. End-user Industry
- 3.1. Aerospace and Defense
- 3.2. Banking, Financial Services, and Insurance
- 3.3. Healthcare
- 3.4. Manufacturing
- 3.5. Retail
- 3.6. IT and Telecommunication
- 3.7. Other End-user Industries
APAC Cyber Security Industry Segmentation By Geography
-
1. North America
- 1.1. United States
- 1.2. Canada
- 1.3. Mexico
-
2. South America
- 2.1. Brazil
- 2.2. Argentina
- 2.3. Rest of South America
-
3. Europe
- 3.1. United Kingdom
- 3.2. Germany
- 3.3. France
- 3.4. Italy
- 3.5. Spain
- 3.6. Russia
- 3.7. Benelux
- 3.8. Nordics
- 3.9. Rest of Europe
-
4. Middle East & Africa
- 4.1. Turkey
- 4.2. Israel
- 4.3. GCC
- 4.4. North Africa
- 4.5. South Africa
- 4.6. Rest of Middle East & Africa
-
5. Asia Pacific
- 5.1. China
- 5.2. India
- 5.3. Japan
- 5.4. South Korea
- 5.5. ASEAN
- 5.6. Oceania
- 5.7. Rest of Asia Pacific
APAC Cyber Security Industry REPORT HIGHLIGHTS
| Aspects | Details |
|---|---|
| Study Period | 2019-2033 |
| Base Year | 2024 |
| Estimated Year | 2025 |
| Forecast Period | 2025-2033 |
| Historical Period | 2019-2024 |
| Growth Rate | CAGR of 13.70% from 2019-2033 |
| Segmentation |
|
Table of Contents
- 1. Introduction
- 1.1. Research Scope
- 1.2. Market Segmentation
- 1.3. Research Methodology
- 1.4. Definitions and Assumptions
- 2. Executive Summary
- 2.1. Introduction
- 3. Market Dynamics
- 3.1. Introduction
- 3.2. Market Drivers
- 3.2.1. Rapidly Increasing Cybersecurity Incidents and Regulations Requiring Their Reporting; Growing M2M/IoT Connections Demanding Strengthened Cybersecurity in Enterprises
- 3.3. Market Restrains
- 3.3.1. Lack of Cybersecurity Professionals; High Reliance on Traditional Authentication Methods and Low Preparedness
- 3.4. Market Trends
- 3.4.1. Cloud Deployment Drives Market Growth
- 4. Market Factor Analysis
- 4.1. Porters Five Forces
- 4.2. Supply/Value Chain
- 4.3. PESTEL analysis
- 4.4. Market Entropy
- 4.5. Patent/Trademark Analysis
- 5. Global APAC Cyber Security Industry Analysis, Insights and Forecast, 2019-2031
- 5.1. Market Analysis, Insights and Forecast - by Product Type
- 5.1.1. Solutions
- 5.1.1.1. Identity and Access Management
- 5.1.1.2. Threat D
- 5.1.1.3. Security and Vulnerability Management
- 5.1.1.4. DDoS Mitigation
- 5.1.1.5. Next Generation Firewall
- 5.1.1.6. IDS/IPS
- 5.1.1.7. Security Information and Event Management
- 5.1.1.8. Other Solutions
- 5.1.2. Services
- 5.1.1. Solutions
- 5.2. Market Analysis, Insights and Forecast - by Deployment
- 5.2.1. On-cloud
- 5.2.2. On-premises
- 5.3. Market Analysis, Insights and Forecast - by End-user Industry
- 5.3.1. Aerospace and Defense
- 5.3.2. Banking, Financial Services, and Insurance
- 5.3.3. Healthcare
- 5.3.4. Manufacturing
- 5.3.5. Retail
- 5.3.6. IT and Telecommunication
- 5.3.7. Other End-user Industries
- 5.4. Market Analysis, Insights and Forecast - by Region
- 5.4.1. North America
- 5.4.2. South America
- 5.4.3. Europe
- 5.4.4. Middle East & Africa
- 5.4.5. Asia Pacific
- 5.1. Market Analysis, Insights and Forecast - by Product Type
- 6. North America APAC Cyber Security Industry Analysis, Insights and Forecast, 2019-2031
- 6.1. Market Analysis, Insights and Forecast - by Product Type
- 6.1.1. Solutions
- 6.1.1.1. Identity and Access Management
- 6.1.1.2. Threat D
- 6.1.1.3. Security and Vulnerability Management
- 6.1.1.4. DDoS Mitigation
- 6.1.1.5. Next Generation Firewall
- 6.1.1.6. IDS/IPS
- 6.1.1.7. Security Information and Event Management
- 6.1.1.8. Other Solutions
- 6.1.2. Services
- 6.1.1. Solutions
- 6.2. Market Analysis, Insights and Forecast - by Deployment
- 6.2.1. On-cloud
- 6.2.2. On-premises
- 6.3. Market Analysis, Insights and Forecast - by End-user Industry
- 6.3.1. Aerospace and Defense
- 6.3.2. Banking, Financial Services, and Insurance
- 6.3.3. Healthcare
- 6.3.4. Manufacturing
- 6.3.5. Retail
- 6.3.6. IT and Telecommunication
- 6.3.7. Other End-user Industries
- 6.1. Market Analysis, Insights and Forecast - by Product Type
- 7. South America APAC Cyber Security Industry Analysis, Insights and Forecast, 2019-2031
- 7.1. Market Analysis, Insights and Forecast - by Product Type
- 7.1.1. Solutions
- 7.1.1.1. Identity and Access Management
- 7.1.1.2. Threat D
- 7.1.1.3. Security and Vulnerability Management
- 7.1.1.4. DDoS Mitigation
- 7.1.1.5. Next Generation Firewall
- 7.1.1.6. IDS/IPS
- 7.1.1.7. Security Information and Event Management
- 7.1.1.8. Other Solutions
- 7.1.2. Services
- 7.1.1. Solutions
- 7.2. Market Analysis, Insights and Forecast - by Deployment
- 7.2.1. On-cloud
- 7.2.2. On-premises
- 7.3. Market Analysis, Insights and Forecast - by End-user Industry
- 7.3.1. Aerospace and Defense
- 7.3.2. Banking, Financial Services, and Insurance
- 7.3.3. Healthcare
- 7.3.4. Manufacturing
- 7.3.5. Retail
- 7.3.6. IT and Telecommunication
- 7.3.7. Other End-user Industries
- 7.1. Market Analysis, Insights and Forecast - by Product Type
- 8. Europe APAC Cyber Security Industry Analysis, Insights and Forecast, 2019-2031
- 8.1. Market Analysis, Insights and Forecast - by Product Type
- 8.1.1. Solutions
- 8.1.1.1. Identity and Access Management
- 8.1.1.2. Threat D
- 8.1.1.3. Security and Vulnerability Management
- 8.1.1.4. DDoS Mitigation
- 8.1.1.5. Next Generation Firewall
- 8.1.1.6. IDS/IPS
- 8.1.1.7. Security Information and Event Management
- 8.1.1.8. Other Solutions
- 8.1.2. Services
- 8.1.1. Solutions
- 8.2. Market Analysis, Insights and Forecast - by Deployment
- 8.2.1. On-cloud
- 8.2.2. On-premises
- 8.3. Market Analysis, Insights and Forecast - by End-user Industry
- 8.3.1. Aerospace and Defense
- 8.3.2. Banking, Financial Services, and Insurance
- 8.3.3. Healthcare
- 8.3.4. Manufacturing
- 8.3.5. Retail
- 8.3.6. IT and Telecommunication
- 8.3.7. Other End-user Industries
- 8.1. Market Analysis, Insights and Forecast - by Product Type
- 9. Middle East & Africa APAC Cyber Security Industry Analysis, Insights and Forecast, 2019-2031
- 9.1. Market Analysis, Insights and Forecast - by Product Type
- 9.1.1. Solutions
- 9.1.1.1. Identity and Access Management
- 9.1.1.2. Threat D
- 9.1.1.3. Security and Vulnerability Management
- 9.1.1.4. DDoS Mitigation
- 9.1.1.5. Next Generation Firewall
- 9.1.1.6. IDS/IPS
- 9.1.1.7. Security Information and Event Management
- 9.1.1.8. Other Solutions
- 9.1.2. Services
- 9.1.1. Solutions
- 9.2. Market Analysis, Insights and Forecast - by Deployment
- 9.2.1. On-cloud
- 9.2.2. On-premises
- 9.3. Market Analysis, Insights and Forecast - by End-user Industry
- 9.3.1. Aerospace and Defense
- 9.3.2. Banking, Financial Services, and Insurance
- 9.3.3. Healthcare
- 9.3.4. Manufacturing
- 9.3.5. Retail
- 9.3.6. IT and Telecommunication
- 9.3.7. Other End-user Industries
- 9.1. Market Analysis, Insights and Forecast - by Product Type
- 10. Asia Pacific APAC Cyber Security Industry Analysis, Insights and Forecast, 2019-2031
- 10.1. Market Analysis, Insights and Forecast - by Product Type
- 10.1.1. Solutions
- 10.1.1.1. Identity and Access Management
- 10.1.1.2. Threat D
- 10.1.1.3. Security and Vulnerability Management
- 10.1.1.4. DDoS Mitigation
- 10.1.1.5. Next Generation Firewall
- 10.1.1.6. IDS/IPS
- 10.1.1.7. Security Information and Event Management
- 10.1.1.8. Other Solutions
- 10.1.2. Services
- 10.1.1. Solutions
- 10.2. Market Analysis, Insights and Forecast - by Deployment
- 10.2.1. On-cloud
- 10.2.2. On-premises
- 10.3. Market Analysis, Insights and Forecast - by End-user Industry
- 10.3.1. Aerospace and Defense
- 10.3.2. Banking, Financial Services, and Insurance
- 10.3.3. Healthcare
- 10.3.4. Manufacturing
- 10.3.5. Retail
- 10.3.6. IT and Telecommunication
- 10.3.7. Other End-user Industries
- 10.1. Market Analysis, Insights and Forecast - by Product Type
- 11. North America APAC Cyber Security Industry Analysis, Insights and Forecast, 2019-2031
- 11.1. Market Analysis, Insights and Forecast - By Country/Sub-region
- 11.1.1.
- 12. Europe APAC Cyber Security Industry Analysis, Insights and Forecast, 2019-2031
- 12.1. Market Analysis, Insights and Forecast - By Country/Sub-region
- 12.1.1.
- 13. Asia Pacific APAC Cyber Security Industry Analysis, Insights and Forecast, 2019-2031
- 13.1. Market Analysis, Insights and Forecast - By Country/Sub-region
- 13.1.1.
- 14. Latin America APAC Cyber Security Industry Analysis, Insights and Forecast, 2019-2031
- 14.1. Market Analysis, Insights and Forecast - By Country/Sub-region
- 14.1.1.
- 15. Middle East and Africa APAC Cyber Security Industry Analysis, Insights and Forecast, 2019-2031
- 15.1. Market Analysis, Insights and Forecast - By Country/Sub-region
- 15.1.1.
- 16. Competitive Analysis
- 16.1. Global Market Share Analysis 2024
- 16.2. Company Profiles
- 16.2.1 AVG Technologies (Avast Software s r o )
- 16.2.1.1. Overview
- 16.2.1.2. Products
- 16.2.1.3. SWOT Analysis
- 16.2.1.4. Recent Developments
- 16.2.1.5. Financials (Based on Availability)
- 16.2.2 IBM Corporation
- 16.2.2.1. Overview
- 16.2.2.2. Products
- 16.2.2.3. SWOT Analysis
- 16.2.2.4. Recent Developments
- 16.2.2.5. Financials (Based on Availability)
- 16.2.3 Trend Micro Inc
- 16.2.3.1. Overview
- 16.2.3.2. Products
- 16.2.3.3. SWOT Analysis
- 16.2.3.4. Recent Developments
- 16.2.3.5. Financials (Based on Availability)
- 16.2.4 Fortinet Inc
- 16.2.4.1. Overview
- 16.2.4.2. Products
- 16.2.4.3. SWOT Analysis
- 16.2.4.4. Recent Developments
- 16.2.4.5. Financials (Based on Availability)
- 16.2.5 Imperva Inc
- 16.2.5.1. Overview
- 16.2.5.2. Products
- 16.2.5.3. SWOT Analysis
- 16.2.5.4. Recent Developments
- 16.2.5.5. Financials (Based on Availability)
- 16.2.6 Check Point Software Technologies Ltd
- 16.2.6.1. Overview
- 16.2.6.2. Products
- 16.2.6.3. SWOT Analysis
- 16.2.6.4. Recent Developments
- 16.2.6.5. Financials (Based on Availability)
- 16.2.7 Cisco Systems Inc
- 16.2.7.1. Overview
- 16.2.7.2. Products
- 16.2.7.3. SWOT Analysis
- 16.2.7.4. Recent Developments
- 16.2.7.5. Financials (Based on Availability)
- 16.2.8 Broadcom Inc
- 16.2.8.1. Overview
- 16.2.8.2. Products
- 16.2.8.3. SWOT Analysis
- 16.2.8.4. Recent Developments
- 16.2.8.5. Financials (Based on Availability)
- 16.2.9 Proofpoint Inc
- 16.2.9.1. Overview
- 16.2.9.2. Products
- 16.2.9.3. SWOT Analysis
- 16.2.9.4. Recent Developments
- 16.2.9.5. Financials (Based on Availability)
- 16.2.10 Rapid7 Inc
- 16.2.10.1. Overview
- 16.2.10.2. Products
- 16.2.10.3. SWOT Analysis
- 16.2.10.4. Recent Developments
- 16.2.10.5. Financials (Based on Availability)
- 16.2.11 Cyber Ark Software Ltd
- 16.2.11.1. Overview
- 16.2.11.2. Products
- 16.2.11.3. SWOT Analysis
- 16.2.11.4. Recent Developments
- 16.2.11.5. Financials (Based on Availability)
- 16.2.12 Intel Security (Intel Corporation)
- 16.2.12.1. Overview
- 16.2.12.2. Products
- 16.2.12.3. SWOT Analysis
- 16.2.12.4. Recent Developments
- 16.2.12.5. Financials (Based on Availability)
- 16.2.13 Dell Technologies Inc
- 16.2.13.1. Overview
- 16.2.13.2. Products
- 16.2.13.3. SWOT Analysis
- 16.2.13.4. Recent Developments
- 16.2.13.5. Financials (Based on Availability)
- 16.2.14 Fireeye Inc
- 16.2.14.1. Overview
- 16.2.14.2. Products
- 16.2.14.3. SWOT Analysis
- 16.2.14.4. Recent Developments
- 16.2.14.5. Financials (Based on Availability)
- 16.2.15 Palo Alto Networks Inc
- 16.2.15.1. Overview
- 16.2.15.2. Products
- 16.2.15.3. SWOT Analysis
- 16.2.15.4. Recent Developments
- 16.2.15.5. Financials (Based on Availability)
- 16.2.1 AVG Technologies (Avast Software s r o )
List of Figures
- Figure 1: Global APAC Cyber Security Industry Revenue Breakdown (Million, %) by Region 2024 & 2032
- Figure 2: Global APAC Cyber Security Industry Volume Breakdown (K Unit, %) by Region 2024 & 2032
- Figure 3: North America APAC Cyber Security Industry Revenue (Million), by Country 2024 & 2032
- Figure 4: North America APAC Cyber Security Industry Volume (K Unit), by Country 2024 & 2032
- Figure 5: North America APAC Cyber Security Industry Revenue Share (%), by Country 2024 & 2032
- Figure 6: North America APAC Cyber Security Industry Volume Share (%), by Country 2024 & 2032
- Figure 7: Europe APAC Cyber Security Industry Revenue (Million), by Country 2024 & 2032
- Figure 8: Europe APAC Cyber Security Industry Volume (K Unit), by Country 2024 & 2032
- Figure 9: Europe APAC Cyber Security Industry Revenue Share (%), by Country 2024 & 2032
- Figure 10: Europe APAC Cyber Security Industry Volume Share (%), by Country 2024 & 2032
- Figure 11: Asia Pacific APAC Cyber Security Industry Revenue (Million), by Country 2024 & 2032
- Figure 12: Asia Pacific APAC Cyber Security Industry Volume (K Unit), by Country 2024 & 2032
- Figure 13: Asia Pacific APAC Cyber Security Industry Revenue Share (%), by Country 2024 & 2032
- Figure 14: Asia Pacific APAC Cyber Security Industry Volume Share (%), by Country 2024 & 2032
- Figure 15: Latin America APAC Cyber Security Industry Revenue (Million), by Country 2024 & 2032
- Figure 16: Latin America APAC Cyber Security Industry Volume (K Unit), by Country 2024 & 2032
- Figure 17: Latin America APAC Cyber Security Industry Revenue Share (%), by Country 2024 & 2032
- Figure 18: Latin America APAC Cyber Security Industry Volume Share (%), by Country 2024 & 2032
- Figure 19: Middle East and Africa APAC Cyber Security Industry Revenue (Million), by Country 2024 & 2032
- Figure 20: Middle East and Africa APAC Cyber Security Industry Volume (K Unit), by Country 2024 & 2032
- Figure 21: Middle East and Africa APAC Cyber Security Industry Revenue Share (%), by Country 2024 & 2032
- Figure 22: Middle East and Africa APAC Cyber Security Industry Volume Share (%), by Country 2024 & 2032
- Figure 23: North America APAC Cyber Security Industry Revenue (Million), by Product Type 2024 & 2032
- Figure 24: North America APAC Cyber Security Industry Volume (K Unit), by Product Type 2024 & 2032
- Figure 25: North America APAC Cyber Security Industry Revenue Share (%), by Product Type 2024 & 2032
- Figure 26: North America APAC Cyber Security Industry Volume Share (%), by Product Type 2024 & 2032
- Figure 27: North America APAC Cyber Security Industry Revenue (Million), by Deployment 2024 & 2032
- Figure 28: North America APAC Cyber Security Industry Volume (K Unit), by Deployment 2024 & 2032
- Figure 29: North America APAC Cyber Security Industry Revenue Share (%), by Deployment 2024 & 2032
- Figure 30: North America APAC Cyber Security Industry Volume Share (%), by Deployment 2024 & 2032
- Figure 31: North America APAC Cyber Security Industry Revenue (Million), by End-user Industry 2024 & 2032
- Figure 32: North America APAC Cyber Security Industry Volume (K Unit), by End-user Industry 2024 & 2032
- Figure 33: North America APAC Cyber Security Industry Revenue Share (%), by End-user Industry 2024 & 2032
- Figure 34: North America APAC Cyber Security Industry Volume Share (%), by End-user Industry 2024 & 2032
- Figure 35: North America APAC Cyber Security Industry Revenue (Million), by Country 2024 & 2032
- Figure 36: North America APAC Cyber Security Industry Volume (K Unit), by Country 2024 & 2032
- Figure 37: North America APAC Cyber Security Industry Revenue Share (%), by Country 2024 & 2032
- Figure 38: North America APAC Cyber Security Industry Volume Share (%), by Country 2024 & 2032
- Figure 39: South America APAC Cyber Security Industry Revenue (Million), by Product Type 2024 & 2032
- Figure 40: South America APAC Cyber Security Industry Volume (K Unit), by Product Type 2024 & 2032
- Figure 41: South America APAC Cyber Security Industry Revenue Share (%), by Product Type 2024 & 2032
- Figure 42: South America APAC Cyber Security Industry Volume Share (%), by Product Type 2024 & 2032
- Figure 43: South America APAC Cyber Security Industry Revenue (Million), by Deployment 2024 & 2032
- Figure 44: South America APAC Cyber Security Industry Volume (K Unit), by Deployment 2024 & 2032
- Figure 45: South America APAC Cyber Security Industry Revenue Share (%), by Deployment 2024 & 2032
- Figure 46: South America APAC Cyber Security Industry Volume Share (%), by Deployment 2024 & 2032
- Figure 47: South America APAC Cyber Security Industry Revenue (Million), by End-user Industry 2024 & 2032
- Figure 48: South America APAC Cyber Security Industry Volume (K Unit), by End-user Industry 2024 & 2032
- Figure 49: South America APAC Cyber Security Industry Revenue Share (%), by End-user Industry 2024 & 2032
- Figure 50: South America APAC Cyber Security Industry Volume Share (%), by End-user Industry 2024 & 2032
- Figure 51: South America APAC Cyber Security Industry Revenue (Million), by Country 2024 & 2032
- Figure 52: South America APAC Cyber Security Industry Volume (K Unit), by Country 2024 & 2032
- Figure 53: South America APAC Cyber Security Industry Revenue Share (%), by Country 2024 & 2032
- Figure 54: South America APAC Cyber Security Industry Volume Share (%), by Country 2024 & 2032
- Figure 55: Europe APAC Cyber Security Industry Revenue (Million), by Product Type 2024 & 2032
- Figure 56: Europe APAC Cyber Security Industry Volume (K Unit), by Product Type 2024 & 2032
- Figure 57: Europe APAC Cyber Security Industry Revenue Share (%), by Product Type 2024 & 2032
- Figure 58: Europe APAC Cyber Security Industry Volume Share (%), by Product Type 2024 & 2032
- Figure 59: Europe APAC Cyber Security Industry Revenue (Million), by Deployment 2024 & 2032
- Figure 60: Europe APAC Cyber Security Industry Volume (K Unit), by Deployment 2024 & 2032
- Figure 61: Europe APAC Cyber Security Industry Revenue Share (%), by Deployment 2024 & 2032
- Figure 62: Europe APAC Cyber Security Industry Volume Share (%), by Deployment 2024 & 2032
- Figure 63: Europe APAC Cyber Security Industry Revenue (Million), by End-user Industry 2024 & 2032
- Figure 64: Europe APAC Cyber Security Industry Volume (K Unit), by End-user Industry 2024 & 2032
- Figure 65: Europe APAC Cyber Security Industry Revenue Share (%), by End-user Industry 2024 & 2032
- Figure 66: Europe APAC Cyber Security Industry Volume Share (%), by End-user Industry 2024 & 2032
- Figure 67: Europe APAC Cyber Security Industry Revenue (Million), by Country 2024 & 2032
- Figure 68: Europe APAC Cyber Security Industry Volume (K Unit), by Country 2024 & 2032
- Figure 69: Europe APAC Cyber Security Industry Revenue Share (%), by Country 2024 & 2032
- Figure 70: Europe APAC Cyber Security Industry Volume Share (%), by Country 2024 & 2032
- Figure 71: Middle East & Africa APAC Cyber Security Industry Revenue (Million), by Product Type 2024 & 2032
- Figure 72: Middle East & Africa APAC Cyber Security Industry Volume (K Unit), by Product Type 2024 & 2032
- Figure 73: Middle East & Africa APAC Cyber Security Industry Revenue Share (%), by Product Type 2024 & 2032
- Figure 74: Middle East & Africa APAC Cyber Security Industry Volume Share (%), by Product Type 2024 & 2032
- Figure 75: Middle East & Africa APAC Cyber Security Industry Revenue (Million), by Deployment 2024 & 2032
- Figure 76: Middle East & Africa APAC Cyber Security Industry Volume (K Unit), by Deployment 2024 & 2032
- Figure 77: Middle East & Africa APAC Cyber Security Industry Revenue Share (%), by Deployment 2024 & 2032
- Figure 78: Middle East & Africa APAC Cyber Security Industry Volume Share (%), by Deployment 2024 & 2032
- Figure 79: Middle East & Africa APAC Cyber Security Industry Revenue (Million), by End-user Industry 2024 & 2032
- Figure 80: Middle East & Africa APAC Cyber Security Industry Volume (K Unit), by End-user Industry 2024 & 2032
- Figure 81: Middle East & Africa APAC Cyber Security Industry Revenue Share (%), by End-user Industry 2024 & 2032
- Figure 82: Middle East & Africa APAC Cyber Security Industry Volume Share (%), by End-user Industry 2024 & 2032
- Figure 83: Middle East & Africa APAC Cyber Security Industry Revenue (Million), by Country 2024 & 2032
- Figure 84: Middle East & Africa APAC Cyber Security Industry Volume (K Unit), by Country 2024 & 2032
- Figure 85: Middle East & Africa APAC Cyber Security Industry Revenue Share (%), by Country 2024 & 2032
- Figure 86: Middle East & Africa APAC Cyber Security Industry Volume Share (%), by Country 2024 & 2032
- Figure 87: Asia Pacific APAC Cyber Security Industry Revenue (Million), by Product Type 2024 & 2032
- Figure 88: Asia Pacific APAC Cyber Security Industry Volume (K Unit), by Product Type 2024 & 2032
- Figure 89: Asia Pacific APAC Cyber Security Industry Revenue Share (%), by Product Type 2024 & 2032
- Figure 90: Asia Pacific APAC Cyber Security Industry Volume Share (%), by Product Type 2024 & 2032
- Figure 91: Asia Pacific APAC Cyber Security Industry Revenue (Million), by Deployment 2024 & 2032
- Figure 92: Asia Pacific APAC Cyber Security Industry Volume (K Unit), by Deployment 2024 & 2032
- Figure 93: Asia Pacific APAC Cyber Security Industry Revenue Share (%), by Deployment 2024 & 2032
- Figure 94: Asia Pacific APAC Cyber Security Industry Volume Share (%), by Deployment 2024 & 2032
- Figure 95: Asia Pacific APAC Cyber Security Industry Revenue (Million), by End-user Industry 2024 & 2032
- Figure 96: Asia Pacific APAC Cyber Security Industry Volume (K Unit), by End-user Industry 2024 & 2032
- Figure 97: Asia Pacific APAC Cyber Security Industry Revenue Share (%), by End-user Industry 2024 & 2032
- Figure 98: Asia Pacific APAC Cyber Security Industry Volume Share (%), by End-user Industry 2024 & 2032
- Figure 99: Asia Pacific APAC Cyber Security Industry Revenue (Million), by Country 2024 & 2032
- Figure 100: Asia Pacific APAC Cyber Security Industry Volume (K Unit), by Country 2024 & 2032
- Figure 101: Asia Pacific APAC Cyber Security Industry Revenue Share (%), by Country 2024 & 2032
- Figure 102: Asia Pacific APAC Cyber Security Industry Volume Share (%), by Country 2024 & 2032
List of Tables
- Table 1: Global APAC Cyber Security Industry Revenue Million Forecast, by Region 2019 & 2032
- Table 2: Global APAC Cyber Security Industry Volume K Unit Forecast, by Region 2019 & 2032
- Table 3: Global APAC Cyber Security Industry Revenue Million Forecast, by Product Type 2019 & 2032
- Table 4: Global APAC Cyber Security Industry Volume K Unit Forecast, by Product Type 2019 & 2032
- Table 5: Global APAC Cyber Security Industry Revenue Million Forecast, by Deployment 2019 & 2032
- Table 6: Global APAC Cyber Security Industry Volume K Unit Forecast, by Deployment 2019 & 2032
- Table 7: Global APAC Cyber Security Industry Revenue Million Forecast, by End-user Industry 2019 & 2032
- Table 8: Global APAC Cyber Security Industry Volume K Unit Forecast, by End-user Industry 2019 & 2032
- Table 9: Global APAC Cyber Security Industry Revenue Million Forecast, by Region 2019 & 2032
- Table 10: Global APAC Cyber Security Industry Volume K Unit Forecast, by Region 2019 & 2032
- Table 11: Global APAC Cyber Security Industry Revenue Million Forecast, by Country 2019 & 2032
- Table 12: Global APAC Cyber Security Industry Volume K Unit Forecast, by Country 2019 & 2032
- Table 13: APAC Cyber Security Industry Revenue (Million) Forecast, by Application 2019 & 2032
- Table 14: APAC Cyber Security Industry Volume (K Unit) Forecast, by Application 2019 & 2032
- Table 15: Global APAC Cyber Security Industry Revenue Million Forecast, by Country 2019 & 2032
- Table 16: Global APAC Cyber Security Industry Volume K Unit Forecast, by Country 2019 & 2032
- Table 17: APAC Cyber Security Industry Revenue (Million) Forecast, by Application 2019 & 2032
- Table 18: APAC Cyber Security Industry Volume (K Unit) Forecast, by Application 2019 & 2032
- Table 19: Global APAC Cyber Security Industry Revenue Million Forecast, by Country 2019 & 2032
- Table 20: Global APAC Cyber Security Industry Volume K Unit Forecast, by Country 2019 & 2032
- Table 21: APAC Cyber Security Industry Revenue (Million) Forecast, by Application 2019 & 2032
- Table 22: APAC Cyber Security Industry Volume (K Unit) Forecast, by Application 2019 & 2032
- Table 23: Global APAC Cyber Security Industry Revenue Million Forecast, by Country 2019 & 2032
- Table 24: Global APAC Cyber Security Industry Volume K Unit Forecast, by Country 2019 & 2032
- Table 25: APAC Cyber Security Industry Revenue (Million) Forecast, by Application 2019 & 2032
- Table 26: APAC Cyber Security Industry Volume (K Unit) Forecast, by Application 2019 & 2032
- Table 27: Global APAC Cyber Security Industry Revenue Million Forecast, by Country 2019 & 2032
- Table 28: Global APAC Cyber Security Industry Volume K Unit Forecast, by Country 2019 & 2032
- Table 29: APAC Cyber Security Industry Revenue (Million) Forecast, by Application 2019 & 2032
- Table 30: APAC Cyber Security Industry Volume (K Unit) Forecast, by Application 2019 & 2032
- Table 31: Global APAC Cyber Security Industry Revenue Million Forecast, by Product Type 2019 & 2032
- Table 32: Global APAC Cyber Security Industry Volume K Unit Forecast, by Product Type 2019 & 2032
- Table 33: Global APAC Cyber Security Industry Revenue Million Forecast, by Deployment 2019 & 2032
- Table 34: Global APAC Cyber Security Industry Volume K Unit Forecast, by Deployment 2019 & 2032
- Table 35: Global APAC Cyber Security Industry Revenue Million Forecast, by End-user Industry 2019 & 2032
- Table 36: Global APAC Cyber Security Industry Volume K Unit Forecast, by End-user Industry 2019 & 2032
- Table 37: Global APAC Cyber Security Industry Revenue Million Forecast, by Country 2019 & 2032
- Table 38: Global APAC Cyber Security Industry Volume K Unit Forecast, by Country 2019 & 2032
- Table 39: United States APAC Cyber Security Industry Revenue (Million) Forecast, by Application 2019 & 2032
- Table 40: United States APAC Cyber Security Industry Volume (K Unit) Forecast, by Application 2019 & 2032
- Table 41: Canada APAC Cyber Security Industry Revenue (Million) Forecast, by Application 2019 & 2032
- Table 42: Canada APAC Cyber Security Industry Volume (K Unit) Forecast, by Application 2019 & 2032
- Table 43: Mexico APAC Cyber Security Industry Revenue (Million) Forecast, by Application 2019 & 2032
- Table 44: Mexico APAC Cyber Security Industry Volume (K Unit) Forecast, by Application 2019 & 2032
- Table 45: Global APAC Cyber Security Industry Revenue Million Forecast, by Product Type 2019 & 2032
- Table 46: Global APAC Cyber Security Industry Volume K Unit Forecast, by Product Type 2019 & 2032
- Table 47: Global APAC Cyber Security Industry Revenue Million Forecast, by Deployment 2019 & 2032
- Table 48: Global APAC Cyber Security Industry Volume K Unit Forecast, by Deployment 2019 & 2032
- Table 49: Global APAC Cyber Security Industry Revenue Million Forecast, by End-user Industry 2019 & 2032
- Table 50: Global APAC Cyber Security Industry Volume K Unit Forecast, by End-user Industry 2019 & 2032
- Table 51: Global APAC Cyber Security Industry Revenue Million Forecast, by Country 2019 & 2032
- Table 52: Global APAC Cyber Security Industry Volume K Unit Forecast, by Country 2019 & 2032
- Table 53: Brazil APAC Cyber Security Industry Revenue (Million) Forecast, by Application 2019 & 2032
- Table 54: Brazil APAC Cyber Security Industry Volume (K Unit) Forecast, by Application 2019 & 2032
- Table 55: Argentina APAC Cyber Security Industry Revenue (Million) Forecast, by Application 2019 & 2032
- Table 56: Argentina APAC Cyber Security Industry Volume (K Unit) Forecast, by Application 2019 & 2032
- Table 57: Rest of South America APAC Cyber Security Industry Revenue (Million) Forecast, by Application 2019 & 2032
- Table 58: Rest of South America APAC Cyber Security Industry Volume (K Unit) Forecast, by Application 2019 & 2032
- Table 59: Global APAC Cyber Security Industry Revenue Million Forecast, by Product Type 2019 & 2032
- Table 60: Global APAC Cyber Security Industry Volume K Unit Forecast, by Product Type 2019 & 2032
- Table 61: Global APAC Cyber Security Industry Revenue Million Forecast, by Deployment 2019 & 2032
- Table 62: Global APAC Cyber Security Industry Volume K Unit Forecast, by Deployment 2019 & 2032
- Table 63: Global APAC Cyber Security Industry Revenue Million Forecast, by End-user Industry 2019 & 2032
- Table 64: Global APAC Cyber Security Industry Volume K Unit Forecast, by End-user Industry 2019 & 2032
- Table 65: Global APAC Cyber Security Industry Revenue Million Forecast, by Country 2019 & 2032
- Table 66: Global APAC Cyber Security Industry Volume K Unit Forecast, by Country 2019 & 2032
- Table 67: United Kingdom APAC Cyber Security Industry Revenue (Million) Forecast, by Application 2019 & 2032
- Table 68: United Kingdom APAC Cyber Security Industry Volume (K Unit) Forecast, by Application 2019 & 2032
- Table 69: Germany APAC Cyber Security Industry Revenue (Million) Forecast, by Application 2019 & 2032
- Table 70: Germany APAC Cyber Security Industry Volume (K Unit) Forecast, by Application 2019 & 2032
- Table 71: France APAC Cyber Security Industry Revenue (Million) Forecast, by Application 2019 & 2032
- Table 72: France APAC Cyber Security Industry Volume (K Unit) Forecast, by Application 2019 & 2032
- Table 73: Italy APAC Cyber Security Industry Revenue (Million) Forecast, by Application 2019 & 2032
- Table 74: Italy APAC Cyber Security Industry Volume (K Unit) Forecast, by Application 2019 & 2032
- Table 75: Spain APAC Cyber Security Industry Revenue (Million) Forecast, by Application 2019 & 2032
- Table 76: Spain APAC Cyber Security Industry Volume (K Unit) Forecast, by Application 2019 & 2032
- Table 77: Russia APAC Cyber Security Industry Revenue (Million) Forecast, by Application 2019 & 2032
- Table 78: Russia APAC Cyber Security Industry Volume (K Unit) Forecast, by Application 2019 & 2032
- Table 79: Benelux APAC Cyber Security Industry Revenue (Million) Forecast, by Application 2019 & 2032
- Table 80: Benelux APAC Cyber Security Industry Volume (K Unit) Forecast, by Application 2019 & 2032
- Table 81: Nordics APAC Cyber Security Industry Revenue (Million) Forecast, by Application 2019 & 2032
- Table 82: Nordics APAC Cyber Security Industry Volume (K Unit) Forecast, by Application 2019 & 2032
- Table 83: Rest of Europe APAC Cyber Security Industry Revenue (Million) Forecast, by Application 2019 & 2032
- Table 84: Rest of Europe APAC Cyber Security Industry Volume (K Unit) Forecast, by Application 2019 & 2032
- Table 85: Global APAC Cyber Security Industry Revenue Million Forecast, by Product Type 2019 & 2032
- Table 86: Global APAC Cyber Security Industry Volume K Unit Forecast, by Product Type 2019 & 2032
- Table 87: Global APAC Cyber Security Industry Revenue Million Forecast, by Deployment 2019 & 2032
- Table 88: Global APAC Cyber Security Industry Volume K Unit Forecast, by Deployment 2019 & 2032
- Table 89: Global APAC Cyber Security Industry Revenue Million Forecast, by End-user Industry 2019 & 2032
- Table 90: Global APAC Cyber Security Industry Volume K Unit Forecast, by End-user Industry 2019 & 2032
- Table 91: Global APAC Cyber Security Industry Revenue Million Forecast, by Country 2019 & 2032
- Table 92: Global APAC Cyber Security Industry Volume K Unit Forecast, by Country 2019 & 2032
- Table 93: Turkey APAC Cyber Security Industry Revenue (Million) Forecast, by Application 2019 & 2032
- Table 94: Turkey APAC Cyber Security Industry Volume (K Unit) Forecast, by Application 2019 & 2032
- Table 95: Israel APAC Cyber Security Industry Revenue (Million) Forecast, by Application 2019 & 2032
- Table 96: Israel APAC Cyber Security Industry Volume (K Unit) Forecast, by Application 2019 & 2032
- Table 97: GCC APAC Cyber Security Industry Revenue (Million) Forecast, by Application 2019 & 2032
- Table 98: GCC APAC Cyber Security Industry Volume (K Unit) Forecast, by Application 2019 & 2032
- Table 99: North Africa APAC Cyber Security Industry Revenue (Million) Forecast, by Application 2019 & 2032
- Table 100: North Africa APAC Cyber Security Industry Volume (K Unit) Forecast, by Application 2019 & 2032
- Table 101: South Africa APAC Cyber Security Industry Revenue (Million) Forecast, by Application 2019 & 2032
- Table 102: South Africa APAC Cyber Security Industry Volume (K Unit) Forecast, by Application 2019 & 2032
- Table 103: Rest of Middle East & Africa APAC Cyber Security Industry Revenue (Million) Forecast, by Application 2019 & 2032
- Table 104: Rest of Middle East & Africa APAC Cyber Security Industry Volume (K Unit) Forecast, by Application 2019 & 2032
- Table 105: Global APAC Cyber Security Industry Revenue Million Forecast, by Product Type 2019 & 2032
- Table 106: Global APAC Cyber Security Industry Volume K Unit Forecast, by Product Type 2019 & 2032
- Table 107: Global APAC Cyber Security Industry Revenue Million Forecast, by Deployment 2019 & 2032
- Table 108: Global APAC Cyber Security Industry Volume K Unit Forecast, by Deployment 2019 & 2032
- Table 109: Global APAC Cyber Security Industry Revenue Million Forecast, by End-user Industry 2019 & 2032
- Table 110: Global APAC Cyber Security Industry Volume K Unit Forecast, by End-user Industry 2019 & 2032
- Table 111: Global APAC Cyber Security Industry Revenue Million Forecast, by Country 2019 & 2032
- Table 112: Global APAC Cyber Security Industry Volume K Unit Forecast, by Country 2019 & 2032
- Table 113: China APAC Cyber Security Industry Revenue (Million) Forecast, by Application 2019 & 2032
- Table 114: China APAC Cyber Security Industry Volume (K Unit) Forecast, by Application 2019 & 2032
- Table 115: India APAC Cyber Security Industry Revenue (Million) Forecast, by Application 2019 & 2032
- Table 116: India APAC Cyber Security Industry Volume (K Unit) Forecast, by Application 2019 & 2032
- Table 117: Japan APAC Cyber Security Industry Revenue (Million) Forecast, by Application 2019 & 2032
- Table 118: Japan APAC Cyber Security Industry Volume (K Unit) Forecast, by Application 2019 & 2032
- Table 119: South Korea APAC Cyber Security Industry Revenue (Million) Forecast, by Application 2019 & 2032
- Table 120: South Korea APAC Cyber Security Industry Volume (K Unit) Forecast, by Application 2019 & 2032
- Table 121: ASEAN APAC Cyber Security Industry Revenue (Million) Forecast, by Application 2019 & 2032
- Table 122: ASEAN APAC Cyber Security Industry Volume (K Unit) Forecast, by Application 2019 & 2032
- Table 123: Oceania APAC Cyber Security Industry Revenue (Million) Forecast, by Application 2019 & 2032
- Table 124: Oceania APAC Cyber Security Industry Volume (K Unit) Forecast, by Application 2019 & 2032
- Table 125: Rest of Asia Pacific APAC Cyber Security Industry Revenue (Million) Forecast, by Application 2019 & 2032
- Table 126: Rest of Asia Pacific APAC Cyber Security Industry Volume (K Unit) Forecast, by Application 2019 & 2032
Frequently Asked Questions
1. What is the projected Compound Annual Growth Rate (CAGR) of the APAC Cyber Security Industry?
The projected CAGR is approximately 13.70%.
2. Which companies are prominent players in the APAC Cyber Security Industry?
Key companies in the market include AVG Technologies (Avast Software s r o ), IBM Corporation, Trend Micro Inc , Fortinet Inc, Imperva Inc, Check Point Software Technologies Ltd, Cisco Systems Inc, Broadcom Inc, Proofpoint Inc, Rapid7 Inc, Cyber Ark Software Ltd, Intel Security (Intel Corporation), Dell Technologies Inc, Fireeye Inc, Palo Alto Networks Inc.
3. What are the main segments of the APAC Cyber Security Industry?
The market segments include Product Type, Deployment, End-user Industry.
4. Can you provide details about the market size?
The market size is estimated to be USD 65.28 Million as of 2022.
5. What are some drivers contributing to market growth?
Rapidly Increasing Cybersecurity Incidents and Regulations Requiring Their Reporting; Growing M2M/IoT Connections Demanding Strengthened Cybersecurity in Enterprises.
6. What are the notable trends driving market growth?
Cloud Deployment Drives Market Growth.
7. Are there any restraints impacting market growth?
Lack of Cybersecurity Professionals; High Reliance on Traditional Authentication Methods and Low Preparedness.
8. Can you provide examples of recent developments in the market?
December 2022: VI Business introduced VI Secure, a new cybersecurity offering for enterprises, which has been developed as a complete cybersecurity portfolio with various trustworthy solutions that protect against several threats originating from networks, clouds, and endpoints in India. Additionally, the company has planned to provide email, web, and virtualized firewall protection using Cisco's FirstWave CyberCision platform.
9. What pricing options are available for accessing the report?
Pricing options include single-user, multi-user, and enterprise licenses priced at USD 3800, USD 4500, and USD 5800 respectively.
10. Is the market size provided in terms of value or volume?
The market size is provided in terms of value, measured in Million and volume, measured in K Unit.
11. Are there any specific market keywords associated with the report?
Yes, the market keyword associated with the report is "APAC Cyber Security Industry," which aids in identifying and referencing the specific market segment covered.
12. How do I determine which pricing option suits my needs best?
The pricing options vary based on user requirements and access needs. Individual users may opt for single-user licenses, while businesses requiring broader access may choose multi-user or enterprise licenses for cost-effective access to the report.
13. Are there any additional resources or data provided in the APAC Cyber Security Industry report?
While the report offers comprehensive insights, it's advisable to review the specific contents or supplementary materials provided to ascertain if additional resources or data are available.
14. How can I stay updated on further developments or reports in the APAC Cyber Security Industry?
To stay informed about further developments, trends, and reports in the APAC Cyber Security Industry, consider subscribing to industry newsletters, following relevant companies and organizations, or regularly checking reputable industry news sources and publications.
Methodology
Step 1 - Identification of Relevant Samples Size from Population Database


Step 2 - Approaches for Defining Global Market Size (Value, Volume* & Price*)

Note*: In applicable scenarios
Step 3 - Data Sources
Primary Research
- Web Analytics
- Survey Reports
- Research Institute
- Latest Research Reports
- Opinion Leaders
Secondary Research
- Annual Reports
- White Paper
- Latest Press Release
- Industry Association
- Paid Database
- Investor Presentations

Step 4 - Data Triangulation
Involves using different sources of information in order to increase the validity of a study
These sources are likely to be stakeholders in a program - participants, other researchers, program staff, other community members, and so on.
Then we put all data in single framework & apply various statistical tools to find out the dynamic on the market.
During the analysis stage, feedback from the stakeholder groups would be compared to determine areas of agreement as well as areas of divergence
