

Key Insights
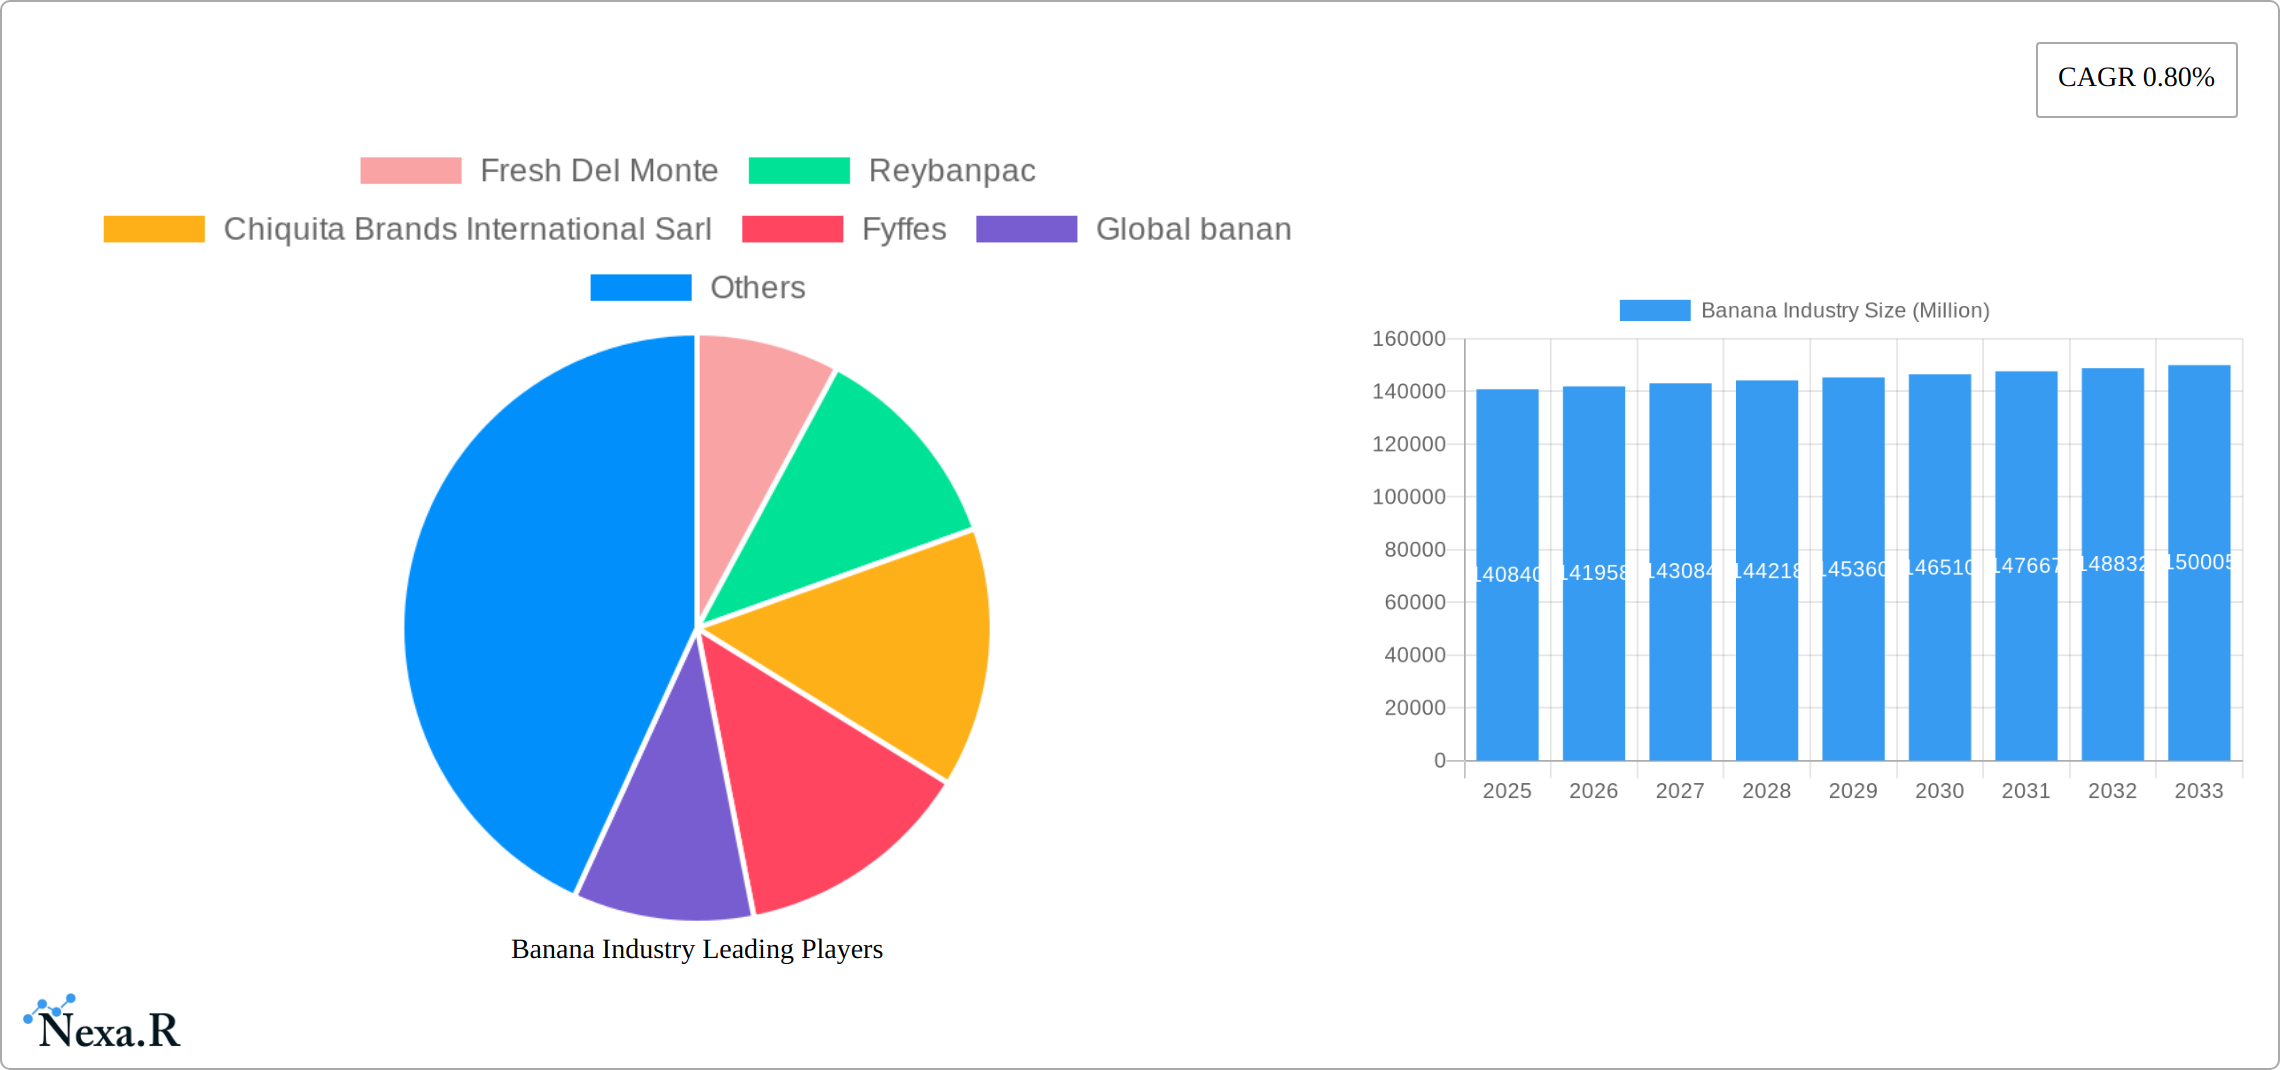
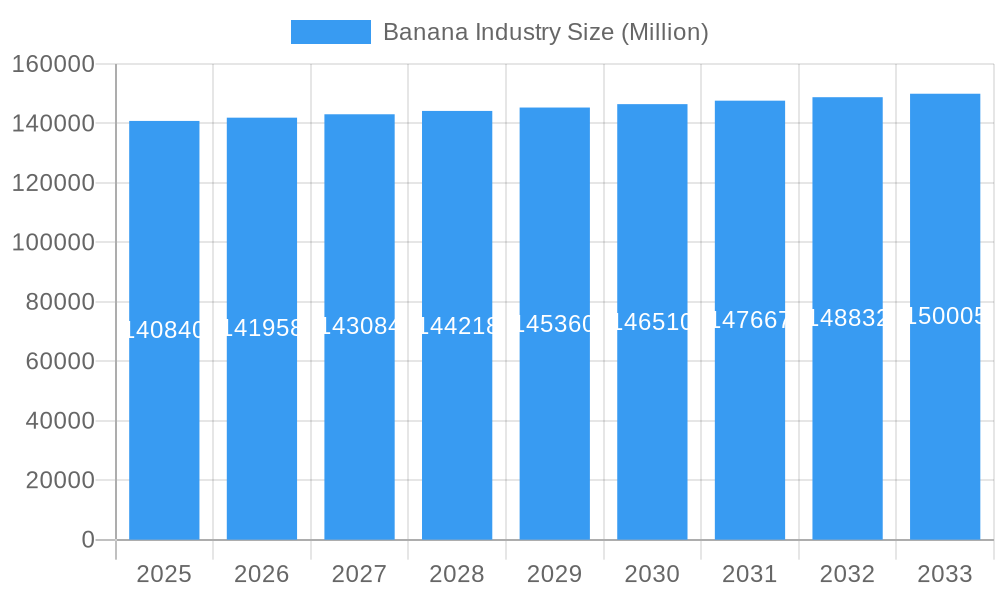
The global banana industry, valued at $140.84 billion in 2025, exhibits a steady growth trajectory with a Compound Annual Growth Rate (CAGR) of 0.80%. This relatively low CAGR suggests a mature market, but significant opportunities exist within specific segments and regions. Driving growth are increasing consumer demand for convenient and healthy snack options, fueled by rising disposable incomes in developing economies and growing awareness of bananas' nutritional benefits. Expanding retail channels, particularly e-commerce platforms, and the increasing popularity of banana-based products like flour, smoothies, and desserts, further contribute to market expansion. However, challenges exist, primarily stemming from fluctuating weather patterns affecting yields, increased transportation costs, and the vulnerability of the industry to pests and diseases. The industry's sensitivity to global economic conditions also poses a potential restraint. Segmentation reveals a dominance of fresh bananas, but processed and banana-based products are witnessing a notable rise in popularity, driven by innovation in food processing and the emergence of health-conscious consumers. The retail segment constitutes a significant share of the market, although food service and wholesale channels are also substantial contributors. Geographical analysis points to North America and Europe as established markets, while Asia-Pacific holds significant growth potential due to its burgeoning population and rising middle class. Competition is fierce, with major players like Dole Food Company, Chiquita Brands International, and Del Monte Fresh Produce vying for market share, employing diverse strategies focusing on sustainability, brand building, and innovative product development.
Banana Industry Market Size (In Billion)
The forecast period (2025-2033) suggests continued, albeit moderate, expansion. Factors such as investments in sustainable farming practices, advancements in post-harvest technologies to reduce waste, and strategic partnerships along the supply chain are expected to shape market dynamics. A focus on traceability and transparency within the supply chain, alongside efforts to reduce the industry's environmental footprint, will be increasingly important to cater to the growing consumer preference for ethically sourced and environmentally friendly products. Successful players will be those who can adapt to shifting consumer preferences, invest in innovation, and effectively manage risks associated with climate change and global supply chain disruptions. Further research into niche markets within banana-based products and exploring opportunities in emerging economies will be key to unlocking future growth within this established, yet dynamic industry.
Banana Industry Company Market Share
Banana Industry Market Report: 2019-2033
This comprehensive report provides an in-depth analysis of the global banana industry, encompassing market dynamics, growth trends, competitive landscape, and future outlook. With a focus on both fresh and processed banana products across retail, wholesale, and food service end-user segments, this report is an essential resource for industry professionals, investors, and anyone seeking to understand this dynamic market. The study period covers 2019-2033, with a base year of 2025 and a forecast period of 2025-2033. Market values are presented in millions of units.
Banana Industry Market Dynamics & Structure
The global banana market exhibits a moderately concentrated structure, dominated by major players such as Dole Food Company, Chiquita Brands International Sarl, and Fyffes, who collectively control a substantial market share. This concentration stems from the significant economies of scale inherent in banana production, distribution, and ripening infrastructure. Market dynamics are significantly shaped by continuous technological advancements. Precision agriculture, automated harvesting technologies, and improved ripening techniques are driving efficiency gains and influencing overall productivity. Stringent regulatory frameworks encompassing food safety standards, ethical labor practices, and environmental sustainability considerations profoundly impact operational costs and strategies. The presence of competitive substitute fruits necessitates robust product differentiation and the development of value-added offerings to maintain market competitiveness. Global demand for bananas is substantial, although regional consumption patterns and affordability significantly influence market variations. Consistent mergers and acquisitions (M&A) activity, with larger companies strategically acquiring smaller businesses, broadens geographical reach and diversifies product portfolios.
- Market Concentration: High (Specific Percentage Needed), with the top 5 players controlling (Specific Percentage Needed) of the market.
- M&A Activity (2019-2024): (Specific Number) deals, totaling (Specific Value in USD or other relevant currency) in value.
- Innovation Barriers: High initial capital investment requirements, navigating complex regulatory hurdles, and overcoming intricate supply chain complexities.
- Key Regulatory Factors: Stringent food safety standards, comprehensive labor regulations, and robust environmental protection policies.
Banana Industry Growth Trends & Insights
The global banana market has demonstrated consistent growth from 2019 to 2024, fueled by a rising global population, increasing disposable incomes in developing economies, and a surge in demand for convenient and healthy snack options. Market expansion is projected to continue at a Compound Annual Growth Rate (CAGR) of (Specific Percentage Needed) during the forecast period (2025-2033), reaching an estimated market size of (Specific Value in Units Needed) by 2033. Technological disruptions, such as streamlined supply chain management and enhanced ripening technologies, have significantly improved efficiency and minimized post-harvest losses. A notable shift in consumer preferences towards organic and sustainably sourced products is also influencing growth trajectories. While market penetration remains high in established markets, future growth is anticipated primarily through expansion into new, untapped markets and increased consumption in developing nations. The processed banana segment is poised for faster growth compared to the fresh segment, driven by the increasing demand for convenient foods and value-added products.
Dominant Regions, Countries, or Segments in Banana Industry
Latin America retains its position as the dominant region in banana production and export, commanding (Specific Percentage Needed) of the global market share in 2024. Ecuador, Costa Rica, and Colombia are key players, benefiting from favorable climatic conditions and well-established export infrastructure. The fresh banana segment holds the largest share of the product type market, accounting for (Specific Percentage Needed), while the processed banana segment experiences continuous growth. The retail segment constitutes the largest end-user market, followed by the wholesale and food service sectors.
- Key Drivers in Latin America: Favorable climate conditions, robust existing infrastructure, and convenient access to global export markets.
- Growth Potential: Africa and Asia present significant growth opportunities due to their rapidly expanding populations and rising disposable incomes.
- Retail Segment Dominance: This dominance is primarily driven by consumer preference for the convenience and readily available nature of fresh produce.
Banana Industry Product Landscape
The banana industry offers a range of products, from fresh bananas of different varieties (Cavendish, Gros Michel, etc.) to processed products like banana chips, banana flour, and banana puree. Product innovation centers on enhancing convenience, extending shelf life, and catering to specific dietary needs (e.g., organic, fair-trade). Technological advancements in processing techniques have improved product quality and reduced waste. Unique selling propositions often include certifications (e.g., organic, fair trade) and focus on sustainability.
Key Drivers, Barriers & Challenges in Banana Industry
Key Drivers:
- Increasing global population and rising disposable incomes.
- Growing demand for convenient and healthy snacks.
- Technological advancements in production and processing.
Challenges:
- Climate change and its impact on banana production (e.g., diseases, extreme weather).
- Fluctuations in currency exchange rates and global commodity prices.
- Competition from other fruits and snack options.
- Supply chain disruptions and transportation costs.
- xx% loss in yield due to disease outbreaks in key regions (estimated).
Emerging Opportunities in Banana Industry
- Expanding into untapped markets in Asia and Africa.
- Developing new value-added products like banana-based functional foods and dietary supplements.
- Leveraging e-commerce platforms for direct-to-consumer sales.
- Increased focus on sustainable and ethical sourcing practices.
Growth Accelerators in the Banana Industry
The long-term growth trajectory of the banana industry will be significantly influenced by technological innovation focused on enhancing yield, minimizing post-harvest losses, and optimizing processing efficiency. The establishment of strategic partnerships throughout the supply chain, including collaborations with farmers and retailers, is crucial for streamlining operations and expanding market reach. Successful penetration into new markets with emerging consumer demand will play a pivotal role in accelerating market growth.
Key Players Shaping the Banana Industry Market
- Fresh Del Monte
- Reybanpac
- Chiquita Brands International Sarl
- Fyffes
- Global banan
- Dole Food Company
- One Banana
- Bonita Banana (Noboa Group)
Notable Milestones in Banana Industry Sector
- March 2022: Fyffes inaugurated a new distribution and ripening center in Ireland, substantially boosting its distribution capacity.
- August 2022: An investment of USD 8.7 million was channeled into banana farms in the Philippines, leading to a notable increase in production capacity.
- October 2022: Greenikk launched a comprehensive end-to-end supply chain platform in India, effectively connecting farmers, traders, and exporters.
In-Depth Banana Industry Market Outlook
The banana industry is poised for continued growth, driven by factors such as rising global demand, technological advancements, and opportunities in emerging markets. Strategic investments in sustainable farming practices, technological innovations, and supply chain optimization will be crucial for maximizing market potential. The industry's ability to adapt to climate change and address consumer concerns about sustainability will play a significant role in shaping its future trajectory. Focus on value-added products and diversification will be key to long-term success.
Banana Industry Segmentation
- 1. Production Analysis
- 2. Consumption Analysis
- 3. Import Market Analysis (Value & Volume)
- 4. Export Market Analysis (Value & Volume)
- 5. Price Trend Analysis
Banana Industry Segmentation By Geography
-
1. North America
- 1.1. United States
- 1.2. Canada
- 1.3. Mexico
-
2. South America
- 2.1. Brazil
- 2.2. Argentina
- 2.3. Rest of South America
-
3. Europe
- 3.1. United Kingdom
- 3.2. Germany
- 3.3. France
- 3.4. Italy
- 3.5. Spain
- 3.6. Russia
- 3.7. Benelux
- 3.8. Nordics
- 3.9. Rest of Europe
-
4. Middle East & Africa
- 4.1. Turkey
- 4.2. Israel
- 4.3. GCC
- 4.4. North Africa
- 4.5. South Africa
- 4.6. Rest of Middle East & Africa
-
5. Asia Pacific
- 5.1. China
- 5.2. India
- 5.3. Japan
- 5.4. South Korea
- 5.5. ASEAN
- 5.6. Oceania
- 5.7. Rest of Asia Pacific
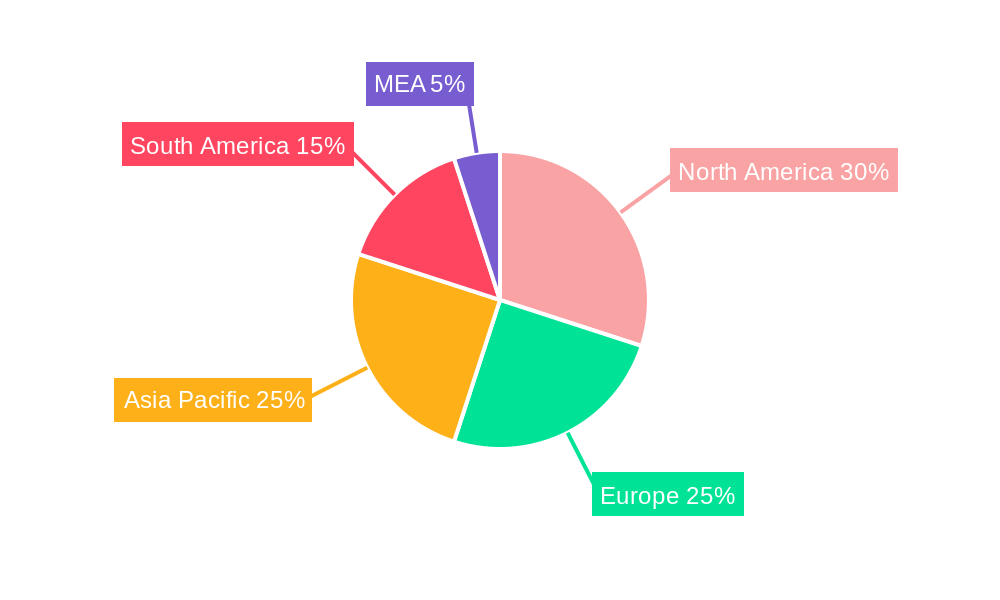
Banana Industry Regional Market Share
Geographic Coverage of Banana Industry
Banana Industry REPORT HIGHLIGHTS
| Aspects | Details |
|---|---|
| Study Period | 2020-2034 |
| Base Year | 2025 |
| Estimated Year | 2026 |
| Forecast Period | 2026-2034 |
| Historical Period | 2020-2025 |
| Growth Rate | CAGR of 0.80% from 2020-2034 |
| Segmentation |
|
Table of Contents
- 1. Introduction
- 1.1. Research Scope
- 1.2. Market Segmentation
- 1.3. Research Objective
- 1.4. Definitions and Assumptions
- 2. Executive Summary
- 2.1. Market Snapshot
- 3. Market Dynamics
- 3.1. Market Drivers
- 3.2. Market Restrains
- 3.3. Market Trends
- 3.4. Market Opportunities
- 4. Market Factor Analysis
- 4.1. Porters Five Forces
- 4.1.1. Bargaining Power of Suppliers
- 4.1.2. Bargaining Power of Buyers
- 4.1.3. Threat of New Entrants
- 4.1.4. Threat of Substitutes
- 4.1.5. Competitive Rivalry
- 4.2. PESTEL analysis
- 4.3. BCG Analysis
- 4.3.1. Stars (High Growth, High Market Share)
- 4.3.2. Cash Cows (Low Growth, High Market Share)
- 4.3.3. Question Mark (High Growth, Low Market Share)
- 4.3.4. Dogs (Low Growth, Low Market Share)
- 4.4. Ansoff Matrix Analysis
- 4.5. Supply Chain Analysis
- 4.6. Regulatory Landscape
- 4.7. Current Market Potential and Opportunity Assessment (TAM–SAM–SOM Framework)
- 4.8. NRP Analyst Note
- 4.1. Porters Five Forces
- 5. Market Analysis, Insights and Forecast 2021-2033
- 5.1. Market Analysis, Insights and Forecast - by Production Analysis
- 5.2. Market Analysis, Insights and Forecast - by Consumption Analysis
- 5.3. Market Analysis, Insights and Forecast - by Import Market Analysis (Value & Volume)
- 5.4. Market Analysis, Insights and Forecast - by Export Market Analysis (Value & Volume)
- 5.5. Market Analysis, Insights and Forecast - by Price Trend Analysis
- 5.6. Market Analysis, Insights and Forecast - by Region
- 5.6.1. North America
- 5.6.2. South America
- 5.6.3. Europe
- 5.6.4. Middle East & Africa
- 5.6.5. Asia Pacific
- 6. Global Banana Industry Analysis, Insights and Forecast, 2021-2033
- 6.1. Market Analysis, Insights and Forecast - by Production Analysis
- 6.2. Market Analysis, Insights and Forecast - by Consumption Analysis
- 6.3. Market Analysis, Insights and Forecast - by Import Market Analysis (Value & Volume)
- 6.4. Market Analysis, Insights and Forecast - by Export Market Analysis (Value & Volume)
- 6.5. Market Analysis, Insights and Forecast - by Price Trend Analysis
- 7. North America Banana Industry Analysis, Insights and Forecast, 2020-2032
- 7.1. Market Analysis, Insights and Forecast - by Production Analysis
- 7.2. Market Analysis, Insights and Forecast - by Consumption Analysis
- 7.3. Market Analysis, Insights and Forecast - by Import Market Analysis (Value & Volume)
- 7.4. Market Analysis, Insights and Forecast - by Export Market Analysis (Value & Volume)
- 7.5. Market Analysis, Insights and Forecast - by Price Trend Analysis
- 8. South America Banana Industry Analysis, Insights and Forecast, 2020-2032
- 8.1. Market Analysis, Insights and Forecast - by Production Analysis
- 8.2. Market Analysis, Insights and Forecast - by Consumption Analysis
- 8.3. Market Analysis, Insights and Forecast - by Import Market Analysis (Value & Volume)
- 8.4. Market Analysis, Insights and Forecast - by Export Market Analysis (Value & Volume)
- 8.5. Market Analysis, Insights and Forecast - by Price Trend Analysis
- 9. Europe Banana Industry Analysis, Insights and Forecast, 2020-2032
- 9.1. Market Analysis, Insights and Forecast - by Production Analysis
- 9.2. Market Analysis, Insights and Forecast - by Consumption Analysis
- 9.3. Market Analysis, Insights and Forecast - by Import Market Analysis (Value & Volume)
- 9.4. Market Analysis, Insights and Forecast - by Export Market Analysis (Value & Volume)
- 9.5. Market Analysis, Insights and Forecast - by Price Trend Analysis
- 10. Middle East & Africa Banana Industry Analysis, Insights and Forecast, 2020-2032
- 10.1. Market Analysis, Insights and Forecast - by Production Analysis
- 10.2. Market Analysis, Insights and Forecast - by Consumption Analysis
- 10.3. Market Analysis, Insights and Forecast - by Import Market Analysis (Value & Volume)
- 10.4. Market Analysis, Insights and Forecast - by Export Market Analysis (Value & Volume)
- 10.5. Market Analysis, Insights and Forecast - by Price Trend Analysis
- 11. Asia Pacific Banana Industry Analysis, Insights and Forecast, 2020-2032
- 11.1. Market Analysis, Insights and Forecast - by Production Analysis
- 11.2. Market Analysis, Insights and Forecast - by Consumption Analysis
- 11.3. Market Analysis, Insights and Forecast - by Import Market Analysis (Value & Volume)
- 11.4. Market Analysis, Insights and Forecast - by Export Market Analysis (Value & Volume)
- 11.5. Market Analysis, Insights and Forecast - by Price Trend Analysis
- 12. Competitive Analysis
- 12.1. Company Profiles
- 12.1.1 Fresh Del Monte
- 12.1.1.1. Company Overview
- 12.1.1.2. Products
- 12.1.1.3. Company Financials
- 12.1.1.4. SWOT Analysis
- 12.1.2 Reybanpac
- 12.1.2.1. Company Overview
- 12.1.2.2. Products
- 12.1.2.3. Company Financials
- 12.1.2.4. SWOT Analysis
- 12.1.3 Chiquita Brands International Sarl
- 12.1.3.1. Company Overview
- 12.1.3.2. Products
- 12.1.3.3. Company Financials
- 12.1.3.4. SWOT Analysis
- 12.1.4 Fyffes
- 12.1.4.1. Company Overview
- 12.1.4.2. Products
- 12.1.4.3. Company Financials
- 12.1.4.4. SWOT Analysis
- 12.1.5 Global banan
- 12.1.5.1. Company Overview
- 12.1.5.2. Products
- 12.1.5.3. Company Financials
- 12.1.5.4. SWOT Analysis
- 12.1.6 Dole Food Company
- 12.1.6.1. Company Overview
- 12.1.6.2. Products
- 12.1.6.3. Company Financials
- 12.1.6.4. SWOT Analysis
- 12.1.7 One Banana
- 12.1.7.1. Company Overview
- 12.1.7.2. Products
- 12.1.7.3. Company Financials
- 12.1.7.4. SWOT Analysis
- 12.1.8 Bonita Banana (Noboa Group)
- 12.1.8.1. Company Overview
- 12.1.8.2. Products
- 12.1.8.3. Company Financials
- 12.1.8.4. SWOT Analysis
- 12.1.1 Fresh Del Monte
- 12.2. Market Entropy
- 12.2.1 Company's Key Areas Served
- 12.2.2 Recent Developments
- 12.3. Company Market Share Analysis 2025
- 12.3.1 Top 5 Companies Market Share Analysis
- 12.3.2 Top 3 Companies Market Share Analysis
- 12.4. List of Potential Customers
- 13. Research Methodology
List of Figures
- Figure 1: Global Banana Industry Revenue Breakdown (Million, %) by Region 2025 & 2033
- Figure 2: North America Banana Industry Revenue (Million), by Production Analysis 2025 & 2033
- Figure 3: North America Banana Industry Revenue Share (%), by Production Analysis 2025 & 2033
- Figure 4: North America Banana Industry Revenue (Million), by Consumption Analysis 2025 & 2033
- Figure 5: North America Banana Industry Revenue Share (%), by Consumption Analysis 2025 & 2033
- Figure 6: North America Banana Industry Revenue (Million), by Import Market Analysis (Value & Volume) 2025 & 2033
- Figure 7: North America Banana Industry Revenue Share (%), by Import Market Analysis (Value & Volume) 2025 & 2033
- Figure 8: North America Banana Industry Revenue (Million), by Export Market Analysis (Value & Volume) 2025 & 2033
- Figure 9: North America Banana Industry Revenue Share (%), by Export Market Analysis (Value & Volume) 2025 & 2033
- Figure 10: North America Banana Industry Revenue (Million), by Price Trend Analysis 2025 & 2033
- Figure 11: North America Banana Industry Revenue Share (%), by Price Trend Analysis 2025 & 2033
- Figure 12: North America Banana Industry Revenue (Million), by Country 2025 & 2033
- Figure 13: North America Banana Industry Revenue Share (%), by Country 2025 & 2033
- Figure 14: South America Banana Industry Revenue (Million), by Production Analysis 2025 & 2033
- Figure 15: South America Banana Industry Revenue Share (%), by Production Analysis 2025 & 2033
- Figure 16: South America Banana Industry Revenue (Million), by Consumption Analysis 2025 & 2033
- Figure 17: South America Banana Industry Revenue Share (%), by Consumption Analysis 2025 & 2033
- Figure 18: South America Banana Industry Revenue (Million), by Import Market Analysis (Value & Volume) 2025 & 2033
- Figure 19: South America Banana Industry Revenue Share (%), by Import Market Analysis (Value & Volume) 2025 & 2033
- Figure 20: South America Banana Industry Revenue (Million), by Export Market Analysis (Value & Volume) 2025 & 2033
- Figure 21: South America Banana Industry Revenue Share (%), by Export Market Analysis (Value & Volume) 2025 & 2033
- Figure 22: South America Banana Industry Revenue (Million), by Price Trend Analysis 2025 & 2033
- Figure 23: South America Banana Industry Revenue Share (%), by Price Trend Analysis 2025 & 2033
- Figure 24: South America Banana Industry Revenue (Million), by Country 2025 & 2033
- Figure 25: South America Banana Industry Revenue Share (%), by Country 2025 & 2033
- Figure 26: Europe Banana Industry Revenue (Million), by Production Analysis 2025 & 2033
- Figure 27: Europe Banana Industry Revenue Share (%), by Production Analysis 2025 & 2033
- Figure 28: Europe Banana Industry Revenue (Million), by Consumption Analysis 2025 & 2033
- Figure 29: Europe Banana Industry Revenue Share (%), by Consumption Analysis 2025 & 2033
- Figure 30: Europe Banana Industry Revenue (Million), by Import Market Analysis (Value & Volume) 2025 & 2033
- Figure 31: Europe Banana Industry Revenue Share (%), by Import Market Analysis (Value & Volume) 2025 & 2033
- Figure 32: Europe Banana Industry Revenue (Million), by Export Market Analysis (Value & Volume) 2025 & 2033
- Figure 33: Europe Banana Industry Revenue Share (%), by Export Market Analysis (Value & Volume) 2025 & 2033
- Figure 34: Europe Banana Industry Revenue (Million), by Price Trend Analysis 2025 & 2033
- Figure 35: Europe Banana Industry Revenue Share (%), by Price Trend Analysis 2025 & 2033
- Figure 36: Europe Banana Industry Revenue (Million), by Country 2025 & 2033
- Figure 37: Europe Banana Industry Revenue Share (%), by Country 2025 & 2033
- Figure 38: Middle East & Africa Banana Industry Revenue (Million), by Production Analysis 2025 & 2033
- Figure 39: Middle East & Africa Banana Industry Revenue Share (%), by Production Analysis 2025 & 2033
- Figure 40: Middle East & Africa Banana Industry Revenue (Million), by Consumption Analysis 2025 & 2033
- Figure 41: Middle East & Africa Banana Industry Revenue Share (%), by Consumption Analysis 2025 & 2033
- Figure 42: Middle East & Africa Banana Industry Revenue (Million), by Import Market Analysis (Value & Volume) 2025 & 2033
- Figure 43: Middle East & Africa Banana Industry Revenue Share (%), by Import Market Analysis (Value & Volume) 2025 & 2033
- Figure 44: Middle East & Africa Banana Industry Revenue (Million), by Export Market Analysis (Value & Volume) 2025 & 2033
- Figure 45: Middle East & Africa Banana Industry Revenue Share (%), by Export Market Analysis (Value & Volume) 2025 & 2033
- Figure 46: Middle East & Africa Banana Industry Revenue (Million), by Price Trend Analysis 2025 & 2033
- Figure 47: Middle East & Africa Banana Industry Revenue Share (%), by Price Trend Analysis 2025 & 2033
- Figure 48: Middle East & Africa Banana Industry Revenue (Million), by Country 2025 & 2033
- Figure 49: Middle East & Africa Banana Industry Revenue Share (%), by Country 2025 & 2033
- Figure 50: Asia Pacific Banana Industry Revenue (Million), by Production Analysis 2025 & 2033
- Figure 51: Asia Pacific Banana Industry Revenue Share (%), by Production Analysis 2025 & 2033
- Figure 52: Asia Pacific Banana Industry Revenue (Million), by Consumption Analysis 2025 & 2033
- Figure 53: Asia Pacific Banana Industry Revenue Share (%), by Consumption Analysis 2025 & 2033
- Figure 54: Asia Pacific Banana Industry Revenue (Million), by Import Market Analysis (Value & Volume) 2025 & 2033
- Figure 55: Asia Pacific Banana Industry Revenue Share (%), by Import Market Analysis (Value & Volume) 2025 & 2033
- Figure 56: Asia Pacific Banana Industry Revenue (Million), by Export Market Analysis (Value & Volume) 2025 & 2033
- Figure 57: Asia Pacific Banana Industry Revenue Share (%), by Export Market Analysis (Value & Volume) 2025 & 2033
- Figure 58: Asia Pacific Banana Industry Revenue (Million), by Price Trend Analysis 2025 & 2033
- Figure 59: Asia Pacific Banana Industry Revenue Share (%), by Price Trend Analysis 2025 & 2033
- Figure 60: Asia Pacific Banana Industry Revenue (Million), by Country 2025 & 2033
- Figure 61: Asia Pacific Banana Industry Revenue Share (%), by Country 2025 & 2033
List of Tables
- Table 1: Global Banana Industry Revenue Million Forecast, by Production Analysis 2020 & 2033
- Table 2: Global Banana Industry Revenue Million Forecast, by Consumption Analysis 2020 & 2033
- Table 3: Global Banana Industry Revenue Million Forecast, by Import Market Analysis (Value & Volume) 2020 & 2033
- Table 4: Global Banana Industry Revenue Million Forecast, by Export Market Analysis (Value & Volume) 2020 & 2033
- Table 5: Global Banana Industry Revenue Million Forecast, by Price Trend Analysis 2020 & 2033
- Table 6: Global Banana Industry Revenue Million Forecast, by Region 2020 & 2033
- Table 7: Global Banana Industry Revenue Million Forecast, by Production Analysis 2020 & 2033
- Table 8: Global Banana Industry Revenue Million Forecast, by Consumption Analysis 2020 & 2033
- Table 9: Global Banana Industry Revenue Million Forecast, by Import Market Analysis (Value & Volume) 2020 & 2033
- Table 10: Global Banana Industry Revenue Million Forecast, by Export Market Analysis (Value & Volume) 2020 & 2033
- Table 11: Global Banana Industry Revenue Million Forecast, by Price Trend Analysis 2020 & 2033
- Table 12: Global Banana Industry Revenue Million Forecast, by Country 2020 & 2033
- Table 13: United States Banana Industry Revenue (Million) Forecast, by Application 2020 & 2033
- Table 14: Canada Banana Industry Revenue (Million) Forecast, by Application 2020 & 2033
- Table 15: Mexico Banana Industry Revenue (Million) Forecast, by Application 2020 & 2033
- Table 16: Global Banana Industry Revenue Million Forecast, by Production Analysis 2020 & 2033
- Table 17: Global Banana Industry Revenue Million Forecast, by Consumption Analysis 2020 & 2033
- Table 18: Global Banana Industry Revenue Million Forecast, by Import Market Analysis (Value & Volume) 2020 & 2033
- Table 19: Global Banana Industry Revenue Million Forecast, by Export Market Analysis (Value & Volume) 2020 & 2033
- Table 20: Global Banana Industry Revenue Million Forecast, by Price Trend Analysis 2020 & 2033
- Table 21: Global Banana Industry Revenue Million Forecast, by Country 2020 & 2033
- Table 22: Brazil Banana Industry Revenue (Million) Forecast, by Application 2020 & 2033
- Table 23: Argentina Banana Industry Revenue (Million) Forecast, by Application 2020 & 2033
- Table 24: Rest of South America Banana Industry Revenue (Million) Forecast, by Application 2020 & 2033
- Table 25: Global Banana Industry Revenue Million Forecast, by Production Analysis 2020 & 2033
- Table 26: Global Banana Industry Revenue Million Forecast, by Consumption Analysis 2020 & 2033
- Table 27: Global Banana Industry Revenue Million Forecast, by Import Market Analysis (Value & Volume) 2020 & 2033
- Table 28: Global Banana Industry Revenue Million Forecast, by Export Market Analysis (Value & Volume) 2020 & 2033
- Table 29: Global Banana Industry Revenue Million Forecast, by Price Trend Analysis 2020 & 2033
- Table 30: Global Banana Industry Revenue Million Forecast, by Country 2020 & 2033
- Table 31: United Kingdom Banana Industry Revenue (Million) Forecast, by Application 2020 & 2033
- Table 32: Germany Banana Industry Revenue (Million) Forecast, by Application 2020 & 2033
- Table 33: France Banana Industry Revenue (Million) Forecast, by Application 2020 & 2033
- Table 34: Italy Banana Industry Revenue (Million) Forecast, by Application 2020 & 2033
- Table 35: Spain Banana Industry Revenue (Million) Forecast, by Application 2020 & 2033
- Table 36: Russia Banana Industry Revenue (Million) Forecast, by Application 2020 & 2033
- Table 37: Benelux Banana Industry Revenue (Million) Forecast, by Application 2020 & 2033
- Table 38: Nordics Banana Industry Revenue (Million) Forecast, by Application 2020 & 2033
- Table 39: Rest of Europe Banana Industry Revenue (Million) Forecast, by Application 2020 & 2033
- Table 40: Global Banana Industry Revenue Million Forecast, by Production Analysis 2020 & 2033
- Table 41: Global Banana Industry Revenue Million Forecast, by Consumption Analysis 2020 & 2033
- Table 42: Global Banana Industry Revenue Million Forecast, by Import Market Analysis (Value & Volume) 2020 & 2033
- Table 43: Global Banana Industry Revenue Million Forecast, by Export Market Analysis (Value & Volume) 2020 & 2033
- Table 44: Global Banana Industry Revenue Million Forecast, by Price Trend Analysis 2020 & 2033
- Table 45: Global Banana Industry Revenue Million Forecast, by Country 2020 & 2033
- Table 46: Turkey Banana Industry Revenue (Million) Forecast, by Application 2020 & 2033
- Table 47: Israel Banana Industry Revenue (Million) Forecast, by Application 2020 & 2033
- Table 48: GCC Banana Industry Revenue (Million) Forecast, by Application 2020 & 2033
- Table 49: North Africa Banana Industry Revenue (Million) Forecast, by Application 2020 & 2033
- Table 50: South Africa Banana Industry Revenue (Million) Forecast, by Application 2020 & 2033
- Table 51: Rest of Middle East & Africa Banana Industry Revenue (Million) Forecast, by Application 2020 & 2033
- Table 52: Global Banana Industry Revenue Million Forecast, by Production Analysis 2020 & 2033
- Table 53: Global Banana Industry Revenue Million Forecast, by Consumption Analysis 2020 & 2033
- Table 54: Global Banana Industry Revenue Million Forecast, by Import Market Analysis (Value & Volume) 2020 & 2033
- Table 55: Global Banana Industry Revenue Million Forecast, by Export Market Analysis (Value & Volume) 2020 & 2033
- Table 56: Global Banana Industry Revenue Million Forecast, by Price Trend Analysis 2020 & 2033
- Table 57: Global Banana Industry Revenue Million Forecast, by Country 2020 & 2033
- Table 58: China Banana Industry Revenue (Million) Forecast, by Application 2020 & 2033
- Table 59: India Banana Industry Revenue (Million) Forecast, by Application 2020 & 2033
- Table 60: Japan Banana Industry Revenue (Million) Forecast, by Application 2020 & 2033
- Table 61: South Korea Banana Industry Revenue (Million) Forecast, by Application 2020 & 2033
- Table 62: ASEAN Banana Industry Revenue (Million) Forecast, by Application 2020 & 2033
- Table 63: Oceania Banana Industry Revenue (Million) Forecast, by Application 2020 & 2033
- Table 64: Rest of Asia Pacific Banana Industry Revenue (Million) Forecast, by Application 2020 & 2033
Frequently Asked Questions
1. What is the projected Compound Annual Growth Rate (CAGR) of the Banana Industry?
The projected CAGR is approximately 0.80%.
2. Which companies are prominent players in the Banana Industry?
Key companies in the market include Fresh Del Monte, Reybanpac, Chiquita Brands International Sarl, Fyffes, Global banan, Dole Food Company, One Banana, Bonita Banana (Noboa Group).
3. What are the main segments of the Banana Industry?
The market segments include Production Analysis, Consumption Analysis, Import Market Analysis (Value & Volume), Export Market Analysis (Value & Volume), Price Trend Analysis.
4. Can you provide details about the market size?
The market size is estimated to be USD 140.84 Million as of 2022.
5. What are some drivers contributing to market growth?
Need for Custom Product Development; Use of CROs for Regulatory Services.
6. What are the notable trends driving market growth?
Increasing Health Consciousness is Driving the Banana Market.
7. Are there any restraints impacting market growth?
Data and Cyber Security Concerns; Lack of Experts and Professionals in this Industry.
8. Can you provide examples of recent developments in the market?
October 2022: Greenikk, a Kerala-based agribusiness startup in India, launched an end-to-end supply chain aimed at connecting banana cultivators, traders, and exporters on a single platform. The startup has built Enablement Centers (EC) in the major banana-producing agriculture belts in the states of Kerala, Tamil Nadu, and Karnataka in India to provide farmers with production and market-related support.
9. What pricing options are available for accessing the report?
Pricing options include single-user, multi-user, and enterprise licenses priced at USD 4750, USD 5250, and USD 8750 respectively.
10. Is the market size provided in terms of value or volume?
The market size is provided in terms of value, measured in Million.
11. Are there any specific market keywords associated with the report?
Yes, the market keyword associated with the report is "Banana Industry," which aids in identifying and referencing the specific market segment covered.
12. How do I determine which pricing option suits my needs best?
The pricing options vary based on user requirements and access needs. Individual users may opt for single-user licenses, while businesses requiring broader access may choose multi-user or enterprise licenses for cost-effective access to the report.
13. Are there any additional resources or data provided in the Banana Industry report?
While the report offers comprehensive insights, it's advisable to review the specific contents or supplementary materials provided to ascertain if additional resources or data are available.
14. How can I stay updated on further developments or reports in the Banana Industry?
To stay informed about further developments, trends, and reports in the Banana Industry, consider subscribing to industry newsletters, following relevant companies and organizations, or regularly checking reputable industry news sources and publications.
Methodology
Step 1 - Identification of Relevant Samples Size from Population Database


Step 2 - Approaches for Defining Global Market Size (Value, Volume* & Price*)

Note*: In applicable scenarios
Step 3 - Data Sources
Primary Research
- Web Analytics
- Survey Reports
- Research Institute
- Latest Research Reports
- Opinion Leaders
Secondary Research
- Annual Reports
- White Paper
- Latest Press Release
- Industry Association
- Paid Database
- Investor Presentations

Step 4 - Data Triangulation
Involves using different sources of information in order to increase the validity of a study
These sources are likely to be stakeholders in a program - participants, other researchers, program staff, other community members, and so on.
Then we put all data in single framework & apply various statistical tools to find out the dynamic on the market.
During the analysis stage, feedback from the stakeholder groups would be compared to determine areas of agreement as well as areas of divergence