

Key Insights
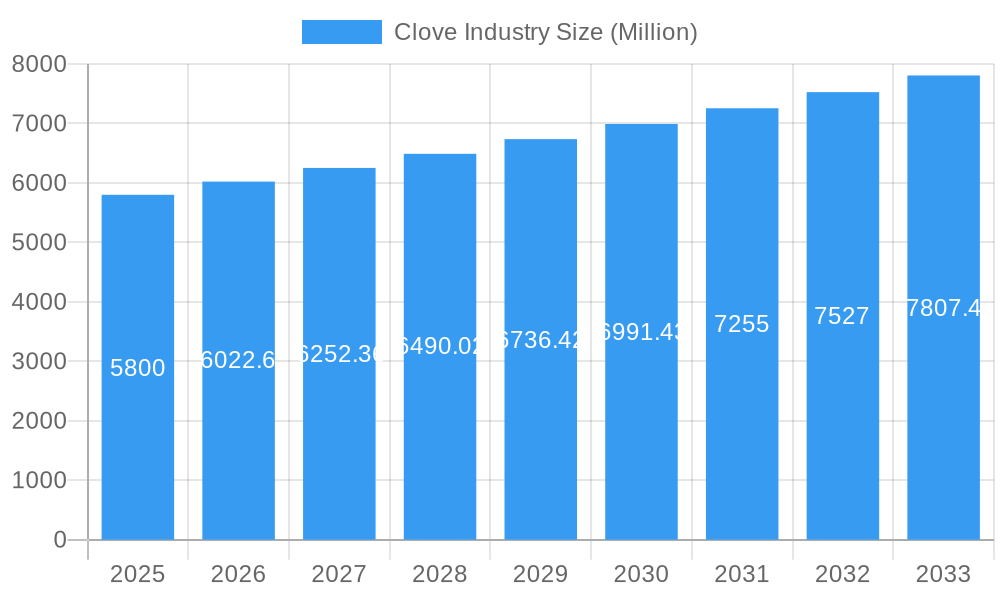
The global clove industry, valued at $5.80 billion in 2025, is projected to experience steady growth, driven primarily by increasing demand in the culinary and medicinal sectors. The rising popularity of clove-infused foods and beverages, coupled with its traditional use in various medicinal applications, particularly in Asian and Middle Eastern countries, fuels market expansion. Furthermore, the growing awareness of clove's antioxidant and antimicrobial properties is bolstering its use in health and wellness products, creating new avenues for growth. While fluctuating prices of raw cloves and potential supply chain disruptions pose challenges, the industry's diversification into value-added products, such as clove oil, is mitigating these risks. The Asia-Pacific region, particularly Indonesia, is expected to remain the dominant market due to its substantial clove production and consumption. However, increasing demand from North America and Europe for high-quality clove products presents significant opportunities for expansion and market diversification for producers. The competitive landscape is characterized by a mix of large-scale producers and smaller, regional players, with increasing focus on sustainable and ethical sourcing practices driving industry dynamics. Projected CAGR of 3.70% suggests a consistent, albeit moderate, growth trajectory over the forecast period.
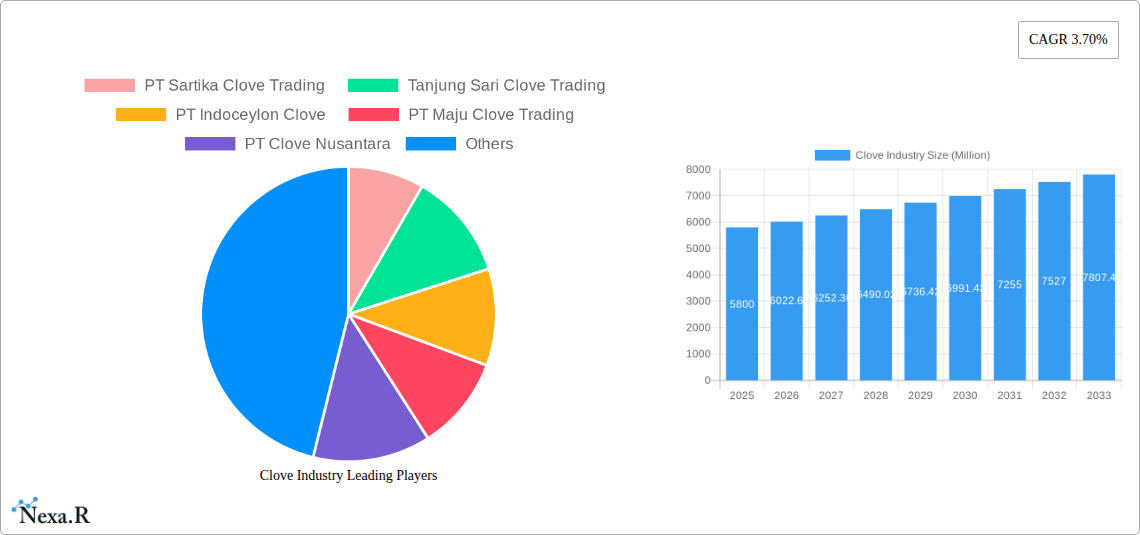
Clove Industry Market Size (In Billion)
The segmentation of the clove market into clove buds and clove oil reflects the diverse applications and value chains. Clove oil, with its higher value and versatility, is experiencing faster growth than clove buds. The medicinal segment, leveraging clove's inherent properties, is a key growth driver and presents opportunities for innovation in pharmaceutical and nutraceutical applications. Regional growth will vary based on cultural consumption patterns and economic factors, with developing economies in Asia and Africa potentially witnessing faster expansion than mature markets in North America and Europe. The successful players will be those that focus on consistent quality control, sustainable sourcing, and meeting the evolving demands of a globalized consumer base. Future growth will hinge on innovation in product development, effective branding, and a proactive approach to supply chain management.
Clove Industry Company Market Share
Clove Industry Market Report: 2019-2033
This comprehensive report provides a detailed analysis of the global clove industry, encompassing market dynamics, growth trends, key players, and future outlook. The study period covers 2019-2033, with 2025 as the base and estimated year. The forecast period spans 2025-2033, and the historical period encompasses 2019-2024. This report is crucial for businesses operating in the spice and herbal products markets (parent market) and specifically within the clove buds and clove oil segments (child market). We analyze the market across culinary and medicinal applications, providing invaluable insights for strategic decision-making. The report values are presented in Million units.
Clove Industry Market Dynamics & Structure
The global clove market, valued at xx Million in 2024, is characterized by moderate concentration, with a few dominant players and numerous smaller regional producers. Technological innovation, primarily in extraction and processing techniques for clove oil, is a key driver. Regulatory frameworks concerning food safety and pesticide residues significantly impact production and trade. Competitive substitutes include other spices with similar flavor profiles, limiting market expansion for clove in certain applications. End-user demographics show a preference for clove in traditional cuisines and medicinal remedies, particularly in Asia and the Middle East. Mergers and acquisitions (M&A) activity has been relatively low in recent years, with xx deals recorded between 2019 and 2024, indicating a potential for consolidation in the future.
- Market Concentration: Moderately concentrated, with top 5 players holding xx% market share in 2024.
- Technological Innovation: Focus on efficient extraction methods for clove oil, improving yield and quality.
- Regulatory Landscape: Stringent regulations on pesticide residues and food safety standards.
- Competitive Substitutes: Cinnamon, nutmeg, allspice pose a competitive threat.
- End-User Demographics: Strong demand from Asian and Middle Eastern markets driven by traditional use.
- M&A Activity: xx deals recorded between 2019 and 2024, hinting at potential future consolidation.
Clove Industry Growth Trends & Insights
The clove market experienced a Compound Annual Growth Rate (CAGR) of xx% during the historical period (2019-2024), reaching a value of xx Million in 2024. Growth is driven by increasing demand for natural flavors and health-conscious consumers seeking the medicinal properties of cloves. Technological advancements in extraction methods are improving the quality and yield of clove oil, further stimulating growth. Shifting consumer preferences towards natural and organic products are positively impacting the market. Market penetration remains relatively low in some regions, presenting significant untapped potential. The forecast period (2025-2033) projects a CAGR of xx%, leading to a market value of xx Million by 2033. This growth is expected to be fuelled by increasing awareness of cloves' health benefits and expansion into new markets.
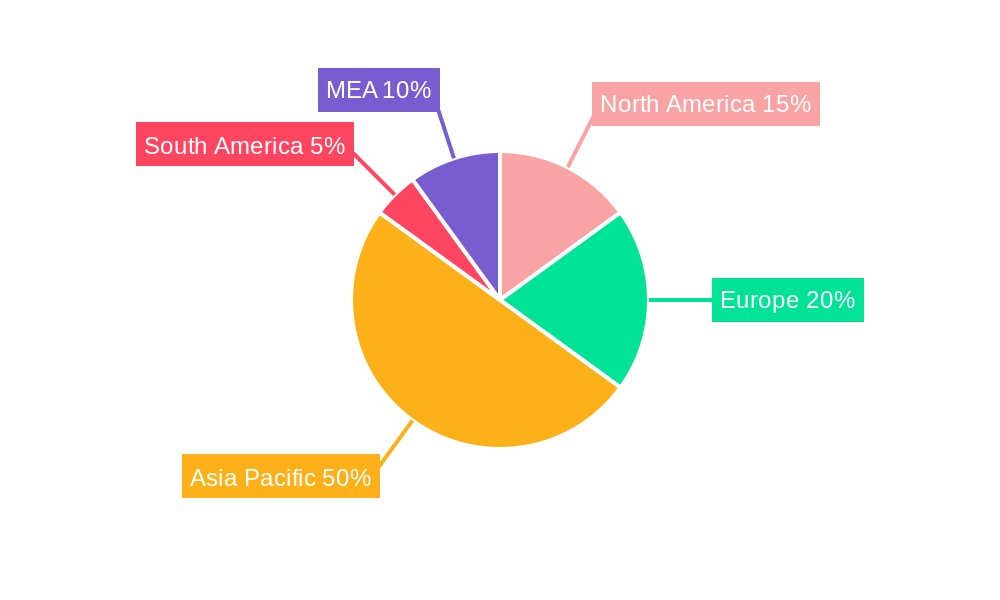
Dominant Regions, Countries, or Segments in Clove Industry
Indonesia remains the dominant producer and exporter of cloves globally, holding a market share of approximately xx% in 2024. This dominance is attributed to favorable climatic conditions, established cultivation practices, and government support for the clove industry. The Clove Buds segment commands a larger market share compared to Clove Oil, driven by its extensive use in culinary applications. The culinary application segment also demonstrates significant dominance, benefiting from the increasing popularity of global cuisines incorporating cloves.
- Key Drivers for Indonesia's Dominance: Favorable climate, established infrastructure, government support.
- Clove Buds Segment Dominance: Wider culinary applications compared to Clove Oil.
- Culinary Application Dominance: Growth in global cuisines utilizing cloves as a spice.
- Growth Potential: Untapped potential in markets with growing interest in natural and organic products.
Clove Industry Product Landscape
The clove industry offers two primary product types: clove buds and clove oil. Innovations focus on improving extraction techniques for clove oil to enhance its purity and yield. Furthermore, there's a growing trend towards value-added products like clove extracts and essential oil blends, catering to diverse applications in the food, beverage, pharmaceutical, and cosmetic industries. Unique selling propositions include the distinct aroma and flavor profiles, along with established medicinal uses. Technological advancements are improving processing efficiency and product quality.
Key Drivers, Barriers & Challenges in Clove Industry
Key Drivers:
- Growing demand for natural flavorings and spices.
- Increasing awareness of cloves' health benefits.
- Expansion of global cuisines incorporating cloves.
- Technological advancements in extraction and processing.
Challenges:
- Fluctuations in clove production due to climate variability.
- Competition from other spices and flavoring agents.
- Regulatory hurdles related to food safety and pesticide residues.
- Supply chain inefficiencies resulting in increased costs. These inefficiencies cost the industry approximately xx Million annually.
Emerging Opportunities in Clove Industry
- Growing demand for organic and sustainably sourced cloves.
- Expansion into new markets with increasing interest in natural health products.
- Development of value-added products, such as clove extracts and essential oil blends for diverse applications.
- Opportunities in functional food and beverage segments utilizing clove’s health benefits.
Growth Accelerators in the Clove Industry
Long-term growth will be accelerated by strategic partnerships between producers and processors to improve supply chain efficiency. Technological breakthroughs in extraction and processing techniques will enhance product quality and yield, boosting profitability. Market expansion strategies focusing on untapped markets, particularly in regions with a rising interest in natural and organic products, will further drive growth.
Key Players Shaping the Clove Industry Market
- PT Sartika Clove Trading
- Tanjung Sari Clove Trading
- PT Indoceylon Clove
- PT Maju Clove Trading
- PT Clove Nusantara
Notable Milestones in Clove Industry Sector
- 2021: Introduction of a new clove oil extraction technology by a leading Indonesian company, increasing yield by xx%.
- 2022: Successful certification of several clove farms for organic production, boosting the premium clove segment.
- 2023: A major Indonesian clove producer implemented a new traceability system enhancing supply chain transparency.
In-Depth Clove Industry Market Outlook
The clove industry is poised for continued growth, driven by rising consumer demand, technological advancements, and strategic market expansions. The focus on sustainable practices and value-added products will create significant opportunities for industry players. Strategic partnerships and investment in research and development will be crucial for maintaining a competitive edge in this dynamic market. The market is expected to continue its growth trajectory, presenting substantial opportunities for players who effectively adapt to market dynamics and innovate in product development and supply chain management.
Clove Industry Segmentation
- 1. Production Analysis
- 2. Consumption Analysis
- 3. Import Market Analysis (Value & Volume)
- 4. Export Market Analysis (Value & Volume)
- 5. Price Trend Analysis
Clove Industry Segmentation By Geography
-
1. North America
- 1.1. United States
-
2. Europe
- 2.1. United Kingdom
- 2.2. Germany
- 2.3. France
-
3. Asia Pacific
- 3.1. Indonesia
- 3.2. China
- 3.3. India
- 3.4. Singapore
- 3.5. Malaysia
- 3.6. Sri Lanka
- 3.7. Vietnam
- 4. Middle East
-
5. Madagascar
- 5.1. Kingdom of Saudi Arabia
- 5.2. United Arab Emirates
- 5.3. Kenya
- 5.4. Comoros
- 5.5. Tanzania
Clove Industry Regional Market Share
Geographic Coverage of Clove Industry
Clove Industry REPORT HIGHLIGHTS
| Aspects | Details |
|---|---|
| Study Period | 2020-2034 |
| Base Year | 2025 |
| Estimated Year | 2026 |
| Forecast Period | 2026-2034 |
| Historical Period | 2020-2025 |
| Growth Rate | CAGR of 3.70% from 2020-2034 |
| Segmentation |
|
Table of Contents
- 1. Introduction
- 1.1. Research Scope
- 1.2. Market Segmentation
- 1.3. Research Objective
- 1.4. Definitions and Assumptions
- 2. Executive Summary
- 2.1. Market Snapshot
- 3. Market Dynamics
- 3.1. Market Drivers
- 3.2. Market Restrains
- 3.3. Market Trends
- 3.4. Market Opportunities
- 4. Market Factor Analysis
- 4.1. Porters Five Forces
- 4.1.1. Bargaining Power of Suppliers
- 4.1.2. Bargaining Power of Buyers
- 4.1.3. Threat of New Entrants
- 4.1.4. Threat of Substitutes
- 4.1.5. Competitive Rivalry
- 4.2. PESTEL analysis
- 4.3. BCG Analysis
- 4.3.1. Stars (High Growth, High Market Share)
- 4.3.2. Cash Cows (Low Growth, High Market Share)
- 4.3.3. Question Mark (High Growth, Low Market Share)
- 4.3.4. Dogs (Low Growth, Low Market Share)
- 4.4. Ansoff Matrix Analysis
- 4.5. Supply Chain Analysis
- 4.6. Regulatory Landscape
- 4.7. Current Market Potential and Opportunity Assessment (TAM–SAM–SOM Framework)
- 4.8. NRP Analyst Note
- 4.1. Porters Five Forces
- 5. Market Analysis, Insights and Forecast 2021-2033
- 5.1. Market Analysis, Insights and Forecast - by Production Analysis
- 5.2. Market Analysis, Insights and Forecast - by Consumption Analysis
- 5.3. Market Analysis, Insights and Forecast - by Import Market Analysis (Value & Volume)
- 5.4. Market Analysis, Insights and Forecast - by Export Market Analysis (Value & Volume)
- 5.5. Market Analysis, Insights and Forecast - by Price Trend Analysis
- 5.6. Market Analysis, Insights and Forecast - by Region
- 5.6.1. North America
- 5.6.2. Europe
- 5.6.3. Asia Pacific
- 5.6.4. Middle East
- 5.6.5. Madagascar
- 6. Global Clove Industry Analysis, Insights and Forecast, 2021-2033
- 6.1. Market Analysis, Insights and Forecast - by Production Analysis
- 6.2. Market Analysis, Insights and Forecast - by Consumption Analysis
- 6.3. Market Analysis, Insights and Forecast - by Import Market Analysis (Value & Volume)
- 6.4. Market Analysis, Insights and Forecast - by Export Market Analysis (Value & Volume)
- 6.5. Market Analysis, Insights and Forecast - by Price Trend Analysis
- 7. North America Clove Industry Analysis, Insights and Forecast, 2020-2032
- 7.1. Market Analysis, Insights and Forecast - by Production Analysis
- 7.2. Market Analysis, Insights and Forecast - by Consumption Analysis
- 7.3. Market Analysis, Insights and Forecast - by Import Market Analysis (Value & Volume)
- 7.4. Market Analysis, Insights and Forecast - by Export Market Analysis (Value & Volume)
- 7.5. Market Analysis, Insights and Forecast - by Price Trend Analysis
- 8. Europe Clove Industry Analysis, Insights and Forecast, 2020-2032
- 8.1. Market Analysis, Insights and Forecast - by Production Analysis
- 8.2. Market Analysis, Insights and Forecast - by Consumption Analysis
- 8.3. Market Analysis, Insights and Forecast - by Import Market Analysis (Value & Volume)
- 8.4. Market Analysis, Insights and Forecast - by Export Market Analysis (Value & Volume)
- 8.5. Market Analysis, Insights and Forecast - by Price Trend Analysis
- 9. Asia Pacific Clove Industry Analysis, Insights and Forecast, 2020-2032
- 9.1. Market Analysis, Insights and Forecast - by Production Analysis
- 9.2. Market Analysis, Insights and Forecast - by Consumption Analysis
- 9.3. Market Analysis, Insights and Forecast - by Import Market Analysis (Value & Volume)
- 9.4. Market Analysis, Insights and Forecast - by Export Market Analysis (Value & Volume)
- 9.5. Market Analysis, Insights and Forecast - by Price Trend Analysis
- 10. Middle East Clove Industry Analysis, Insights and Forecast, 2020-2032
- 10.1. Market Analysis, Insights and Forecast - by Production Analysis
- 10.2. Market Analysis, Insights and Forecast - by Consumption Analysis
- 10.3. Market Analysis, Insights and Forecast - by Import Market Analysis (Value & Volume)
- 10.4. Market Analysis, Insights and Forecast - by Export Market Analysis (Value & Volume)
- 10.5. Market Analysis, Insights and Forecast - by Price Trend Analysis
- 11. Madagascar Clove Industry Analysis, Insights and Forecast, 2020-2032
- 11.1. Market Analysis, Insights and Forecast - by Production Analysis
- 11.2. Market Analysis, Insights and Forecast - by Consumption Analysis
- 11.3. Market Analysis, Insights and Forecast - by Import Market Analysis (Value & Volume)
- 11.4. Market Analysis, Insights and Forecast - by Export Market Analysis (Value & Volume)
- 11.5. Market Analysis, Insights and Forecast - by Price Trend Analysis
- 12. Competitive Analysis
- 12.1. Company Profiles
- 12.1.1 PT Sartika Clove Trading
- 12.1.1.1. Company Overview
- 12.1.1.2. Products
- 12.1.1.3. Company Financials
- 12.1.1.4. SWOT Analysis
- 12.1.2 Tanjung Sari Clove Trading
- 12.1.2.1. Company Overview
- 12.1.2.2. Products
- 12.1.2.3. Company Financials
- 12.1.2.4. SWOT Analysis
- 12.1.3 PT Indoceylon Clove
- 12.1.3.1. Company Overview
- 12.1.3.2. Products
- 12.1.3.3. Company Financials
- 12.1.3.4. SWOT Analysis
- 12.1.4 PT Maju Clove Trading
- 12.1.4.1. Company Overview
- 12.1.4.2. Products
- 12.1.4.3. Company Financials
- 12.1.4.4. SWOT Analysis
- 12.1.5 PT Clove Nusantara
- 12.1.5.1. Company Overview
- 12.1.5.2. Products
- 12.1.5.3. Company Financials
- 12.1.5.4. SWOT Analysis
- 12.1.1 PT Sartika Clove Trading
- 12.2. Market Entropy
- 12.2.1 Company's Key Areas Served
- 12.2.2 Recent Developments
- 12.3. Company Market Share Analysis 2025
- 12.3.1 Top 5 Companies Market Share Analysis
- 12.3.2 Top 3 Companies Market Share Analysis
- 12.4. List of Potential Customers
- 13. Research Methodology
List of Figures
- Figure 1: Global Clove Industry Revenue Breakdown (Million, %) by Region 2025 & 2033
- Figure 2: North America Clove Industry Revenue (Million), by Production Analysis 2025 & 2033
- Figure 3: North America Clove Industry Revenue Share (%), by Production Analysis 2025 & 2033
- Figure 4: North America Clove Industry Revenue (Million), by Consumption Analysis 2025 & 2033
- Figure 5: North America Clove Industry Revenue Share (%), by Consumption Analysis 2025 & 2033
- Figure 6: North America Clove Industry Revenue (Million), by Import Market Analysis (Value & Volume) 2025 & 2033
- Figure 7: North America Clove Industry Revenue Share (%), by Import Market Analysis (Value & Volume) 2025 & 2033
- Figure 8: North America Clove Industry Revenue (Million), by Export Market Analysis (Value & Volume) 2025 & 2033
- Figure 9: North America Clove Industry Revenue Share (%), by Export Market Analysis (Value & Volume) 2025 & 2033
- Figure 10: North America Clove Industry Revenue (Million), by Price Trend Analysis 2025 & 2033
- Figure 11: North America Clove Industry Revenue Share (%), by Price Trend Analysis 2025 & 2033
- Figure 12: North America Clove Industry Revenue (Million), by Country 2025 & 2033
- Figure 13: North America Clove Industry Revenue Share (%), by Country 2025 & 2033
- Figure 14: Europe Clove Industry Revenue (Million), by Production Analysis 2025 & 2033
- Figure 15: Europe Clove Industry Revenue Share (%), by Production Analysis 2025 & 2033
- Figure 16: Europe Clove Industry Revenue (Million), by Consumption Analysis 2025 & 2033
- Figure 17: Europe Clove Industry Revenue Share (%), by Consumption Analysis 2025 & 2033
- Figure 18: Europe Clove Industry Revenue (Million), by Import Market Analysis (Value & Volume) 2025 & 2033
- Figure 19: Europe Clove Industry Revenue Share (%), by Import Market Analysis (Value & Volume) 2025 & 2033
- Figure 20: Europe Clove Industry Revenue (Million), by Export Market Analysis (Value & Volume) 2025 & 2033
- Figure 21: Europe Clove Industry Revenue Share (%), by Export Market Analysis (Value & Volume) 2025 & 2033
- Figure 22: Europe Clove Industry Revenue (Million), by Price Trend Analysis 2025 & 2033
- Figure 23: Europe Clove Industry Revenue Share (%), by Price Trend Analysis 2025 & 2033
- Figure 24: Europe Clove Industry Revenue (Million), by Country 2025 & 2033
- Figure 25: Europe Clove Industry Revenue Share (%), by Country 2025 & 2033
- Figure 26: Asia Pacific Clove Industry Revenue (Million), by Production Analysis 2025 & 2033
- Figure 27: Asia Pacific Clove Industry Revenue Share (%), by Production Analysis 2025 & 2033
- Figure 28: Asia Pacific Clove Industry Revenue (Million), by Consumption Analysis 2025 & 2033
- Figure 29: Asia Pacific Clove Industry Revenue Share (%), by Consumption Analysis 2025 & 2033
- Figure 30: Asia Pacific Clove Industry Revenue (Million), by Import Market Analysis (Value & Volume) 2025 & 2033
- Figure 31: Asia Pacific Clove Industry Revenue Share (%), by Import Market Analysis (Value & Volume) 2025 & 2033
- Figure 32: Asia Pacific Clove Industry Revenue (Million), by Export Market Analysis (Value & Volume) 2025 & 2033
- Figure 33: Asia Pacific Clove Industry Revenue Share (%), by Export Market Analysis (Value & Volume) 2025 & 2033
- Figure 34: Asia Pacific Clove Industry Revenue (Million), by Price Trend Analysis 2025 & 2033
- Figure 35: Asia Pacific Clove Industry Revenue Share (%), by Price Trend Analysis 2025 & 2033
- Figure 36: Asia Pacific Clove Industry Revenue (Million), by Country 2025 & 2033
- Figure 37: Asia Pacific Clove Industry Revenue Share (%), by Country 2025 & 2033
- Figure 38: Middle East Clove Industry Revenue (Million), by Production Analysis 2025 & 2033
- Figure 39: Middle East Clove Industry Revenue Share (%), by Production Analysis 2025 & 2033
- Figure 40: Middle East Clove Industry Revenue (Million), by Consumption Analysis 2025 & 2033
- Figure 41: Middle East Clove Industry Revenue Share (%), by Consumption Analysis 2025 & 2033
- Figure 42: Middle East Clove Industry Revenue (Million), by Import Market Analysis (Value & Volume) 2025 & 2033
- Figure 43: Middle East Clove Industry Revenue Share (%), by Import Market Analysis (Value & Volume) 2025 & 2033
- Figure 44: Middle East Clove Industry Revenue (Million), by Export Market Analysis (Value & Volume) 2025 & 2033
- Figure 45: Middle East Clove Industry Revenue Share (%), by Export Market Analysis (Value & Volume) 2025 & 2033
- Figure 46: Middle East Clove Industry Revenue (Million), by Price Trend Analysis 2025 & 2033
- Figure 47: Middle East Clove Industry Revenue Share (%), by Price Trend Analysis 2025 & 2033
- Figure 48: Middle East Clove Industry Revenue (Million), by Country 2025 & 2033
- Figure 49: Middle East Clove Industry Revenue Share (%), by Country 2025 & 2033
- Figure 50: Madagascar Clove Industry Revenue (Million), by Production Analysis 2025 & 2033
- Figure 51: Madagascar Clove Industry Revenue Share (%), by Production Analysis 2025 & 2033
- Figure 52: Madagascar Clove Industry Revenue (Million), by Consumption Analysis 2025 & 2033
- Figure 53: Madagascar Clove Industry Revenue Share (%), by Consumption Analysis 2025 & 2033
- Figure 54: Madagascar Clove Industry Revenue (Million), by Import Market Analysis (Value & Volume) 2025 & 2033
- Figure 55: Madagascar Clove Industry Revenue Share (%), by Import Market Analysis (Value & Volume) 2025 & 2033
- Figure 56: Madagascar Clove Industry Revenue (Million), by Export Market Analysis (Value & Volume) 2025 & 2033
- Figure 57: Madagascar Clove Industry Revenue Share (%), by Export Market Analysis (Value & Volume) 2025 & 2033
- Figure 58: Madagascar Clove Industry Revenue (Million), by Price Trend Analysis 2025 & 2033
- Figure 59: Madagascar Clove Industry Revenue Share (%), by Price Trend Analysis 2025 & 2033
- Figure 60: Madagascar Clove Industry Revenue (Million), by Country 2025 & 2033
- Figure 61: Madagascar Clove Industry Revenue Share (%), by Country 2025 & 2033
List of Tables
- Table 1: Global Clove Industry Revenue Million Forecast, by Production Analysis 2020 & 2033
- Table 2: Global Clove Industry Revenue Million Forecast, by Consumption Analysis 2020 & 2033
- Table 3: Global Clove Industry Revenue Million Forecast, by Import Market Analysis (Value & Volume) 2020 & 2033
- Table 4: Global Clove Industry Revenue Million Forecast, by Export Market Analysis (Value & Volume) 2020 & 2033
- Table 5: Global Clove Industry Revenue Million Forecast, by Price Trend Analysis 2020 & 2033
- Table 6: Global Clove Industry Revenue Million Forecast, by Region 2020 & 2033
- Table 7: Global Clove Industry Revenue Million Forecast, by Production Analysis 2020 & 2033
- Table 8: Global Clove Industry Revenue Million Forecast, by Consumption Analysis 2020 & 2033
- Table 9: Global Clove Industry Revenue Million Forecast, by Import Market Analysis (Value & Volume) 2020 & 2033
- Table 10: Global Clove Industry Revenue Million Forecast, by Export Market Analysis (Value & Volume) 2020 & 2033
- Table 11: Global Clove Industry Revenue Million Forecast, by Price Trend Analysis 2020 & 2033
- Table 12: Global Clove Industry Revenue Million Forecast, by Country 2020 & 2033
- Table 13: United States Clove Industry Revenue (Million) Forecast, by Application 2020 & 2033
- Table 14: Global Clove Industry Revenue Million Forecast, by Production Analysis 2020 & 2033
- Table 15: Global Clove Industry Revenue Million Forecast, by Consumption Analysis 2020 & 2033
- Table 16: Global Clove Industry Revenue Million Forecast, by Import Market Analysis (Value & Volume) 2020 & 2033
- Table 17: Global Clove Industry Revenue Million Forecast, by Export Market Analysis (Value & Volume) 2020 & 2033
- Table 18: Global Clove Industry Revenue Million Forecast, by Price Trend Analysis 2020 & 2033
- Table 19: Global Clove Industry Revenue Million Forecast, by Country 2020 & 2033
- Table 20: United Kingdom Clove Industry Revenue (Million) Forecast, by Application 2020 & 2033
- Table 21: Germany Clove Industry Revenue (Million) Forecast, by Application 2020 & 2033
- Table 22: France Clove Industry Revenue (Million) Forecast, by Application 2020 & 2033
- Table 23: Global Clove Industry Revenue Million Forecast, by Production Analysis 2020 & 2033
- Table 24: Global Clove Industry Revenue Million Forecast, by Consumption Analysis 2020 & 2033
- Table 25: Global Clove Industry Revenue Million Forecast, by Import Market Analysis (Value & Volume) 2020 & 2033
- Table 26: Global Clove Industry Revenue Million Forecast, by Export Market Analysis (Value & Volume) 2020 & 2033
- Table 27: Global Clove Industry Revenue Million Forecast, by Price Trend Analysis 2020 & 2033
- Table 28: Global Clove Industry Revenue Million Forecast, by Country 2020 & 2033
- Table 29: Indonesia Clove Industry Revenue (Million) Forecast, by Application 2020 & 2033
- Table 30: China Clove Industry Revenue (Million) Forecast, by Application 2020 & 2033
- Table 31: India Clove Industry Revenue (Million) Forecast, by Application 2020 & 2033
- Table 32: Singapore Clove Industry Revenue (Million) Forecast, by Application 2020 & 2033
- Table 33: Malaysia Clove Industry Revenue (Million) Forecast, by Application 2020 & 2033
- Table 34: Sri Lanka Clove Industry Revenue (Million) Forecast, by Application 2020 & 2033
- Table 35: Vietnam Clove Industry Revenue (Million) Forecast, by Application 2020 & 2033
- Table 36: Global Clove Industry Revenue Million Forecast, by Production Analysis 2020 & 2033
- Table 37: Global Clove Industry Revenue Million Forecast, by Consumption Analysis 2020 & 2033
- Table 38: Global Clove Industry Revenue Million Forecast, by Import Market Analysis (Value & Volume) 2020 & 2033
- Table 39: Global Clove Industry Revenue Million Forecast, by Export Market Analysis (Value & Volume) 2020 & 2033
- Table 40: Global Clove Industry Revenue Million Forecast, by Price Trend Analysis 2020 & 2033
- Table 41: Global Clove Industry Revenue Million Forecast, by Country 2020 & 2033
- Table 42: Global Clove Industry Revenue Million Forecast, by Production Analysis 2020 & 2033
- Table 43: Global Clove Industry Revenue Million Forecast, by Consumption Analysis 2020 & 2033
- Table 44: Global Clove Industry Revenue Million Forecast, by Import Market Analysis (Value & Volume) 2020 & 2033
- Table 45: Global Clove Industry Revenue Million Forecast, by Export Market Analysis (Value & Volume) 2020 & 2033
- Table 46: Global Clove Industry Revenue Million Forecast, by Price Trend Analysis 2020 & 2033
- Table 47: Global Clove Industry Revenue Million Forecast, by Country 2020 & 2033
- Table 48: Kingdom of Saudi Arabia Clove Industry Revenue (Million) Forecast, by Application 2020 & 2033
- Table 49: United Arab Emirates Clove Industry Revenue (Million) Forecast, by Application 2020 & 2033
- Table 50: Kenya Clove Industry Revenue (Million) Forecast, by Application 2020 & 2033
- Table 51: Comoros Clove Industry Revenue (Million) Forecast, by Application 2020 & 2033
- Table 52: Tanzania Clove Industry Revenue (Million) Forecast, by Application 2020 & 2033
Frequently Asked Questions
1. What is the projected Compound Annual Growth Rate (CAGR) of the Clove Industry?
The projected CAGR is approximately 3.70%.
2. Which companies are prominent players in the Clove Industry?
Key companies in the market include PT Sartika Clove Trading , Tanjung Sari Clove Trading , PT Indoceylon Clove , PT Maju Clove Trading , PT Clove Nusantara.
3. What are the main segments of the Clove Industry?
The market segments include Production Analysis, Consumption Analysis, Import Market Analysis (Value & Volume), Export Market Analysis (Value & Volume), Price Trend Analysis.
4. Can you provide details about the market size?
The market size is estimated to be USD 5.80 Million as of 2022.
5. What are some drivers contributing to market growth?
Increasing Demand for Garlic Due to Various Uses in Industries; Rising Demad of Organic Garlic; Increasing Government Initiatives.
6. What are the notable trends driving market growth?
Increased Demand from Various Industries is Aiding the Production.
7. Are there any restraints impacting market growth?
Lack of Technical Knowledge of Farmers; Price Fluctuations.
8. Can you provide examples of recent developments in the market?
N/A
9. What pricing options are available for accessing the report?
Pricing options include single-user, multi-user, and enterprise licenses priced at USD 4750, USD 5250, and USD 8750 respectively.
10. Is the market size provided in terms of value or volume?
The market size is provided in terms of value, measured in Million.
11. Are there any specific market keywords associated with the report?
Yes, the market keyword associated with the report is "Clove Industry," which aids in identifying and referencing the specific market segment covered.
12. How do I determine which pricing option suits my needs best?
The pricing options vary based on user requirements and access needs. Individual users may opt for single-user licenses, while businesses requiring broader access may choose multi-user or enterprise licenses for cost-effective access to the report.
13. Are there any additional resources or data provided in the Clove Industry report?
While the report offers comprehensive insights, it's advisable to review the specific contents or supplementary materials provided to ascertain if additional resources or data are available.
14. How can I stay updated on further developments or reports in the Clove Industry?
To stay informed about further developments, trends, and reports in the Clove Industry, consider subscribing to industry newsletters, following relevant companies and organizations, or regularly checking reputable industry news sources and publications.
Methodology
Step 1 - Identification of Relevant Samples Size from Population Database


Step 2 - Approaches for Defining Global Market Size (Value, Volume* & Price*)

Note*: In applicable scenarios
Step 3 - Data Sources
Primary Research
- Web Analytics
- Survey Reports
- Research Institute
- Latest Research Reports
- Opinion Leaders
Secondary Research
- Annual Reports
- White Paper
- Latest Press Release
- Industry Association
- Paid Database
- Investor Presentations

Step 4 - Data Triangulation
Involves using different sources of information in order to increase the validity of a study
These sources are likely to be stakeholders in a program - participants, other researchers, program staff, other community members, and so on.
Then we put all data in single framework & apply various statistical tools to find out the dynamic on the market.
During the analysis stage, feedback from the stakeholder groups would be compared to determine areas of agreement as well as areas of divergence