

Key Insights
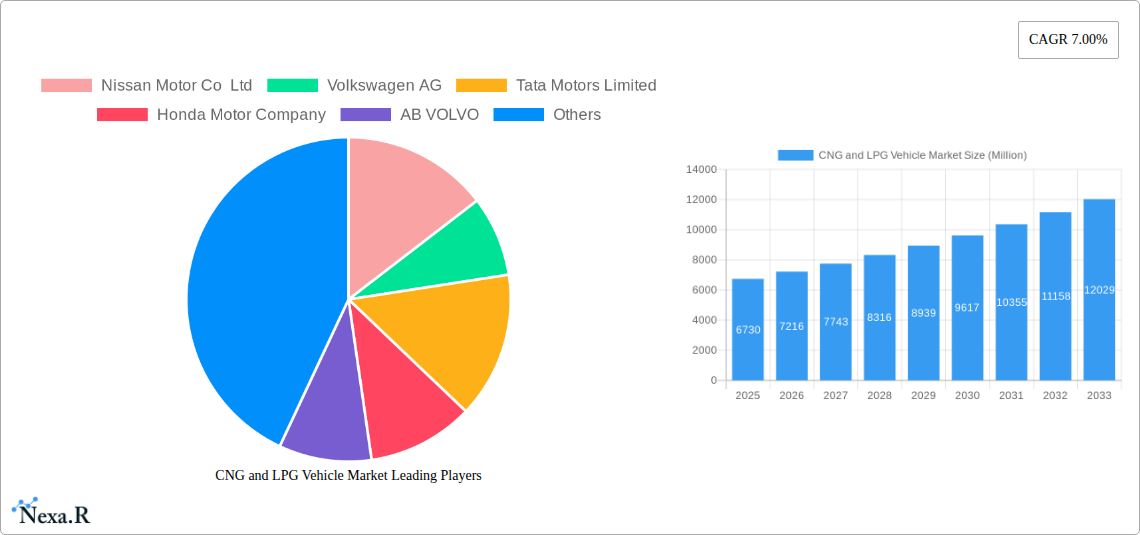
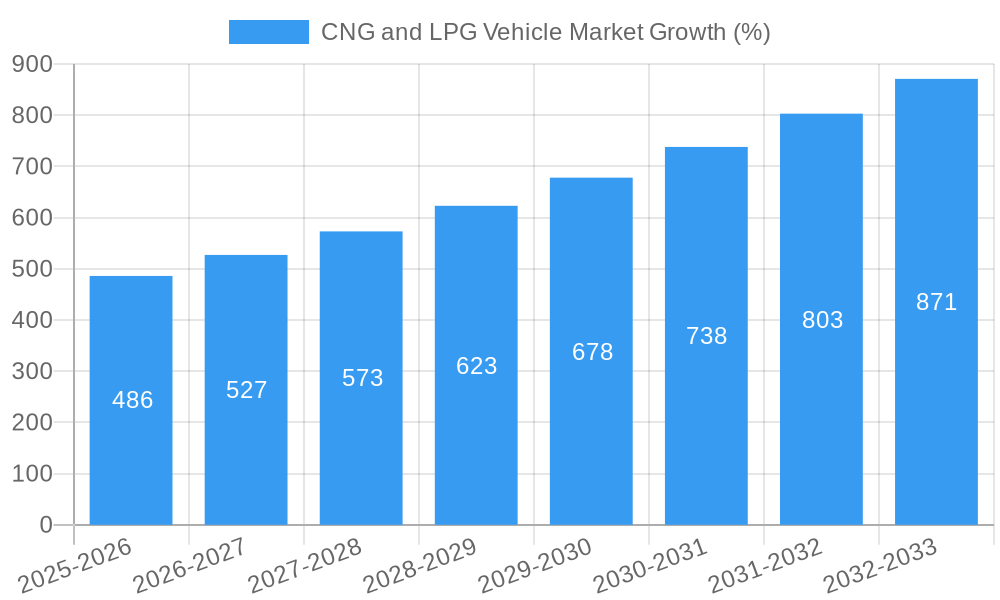
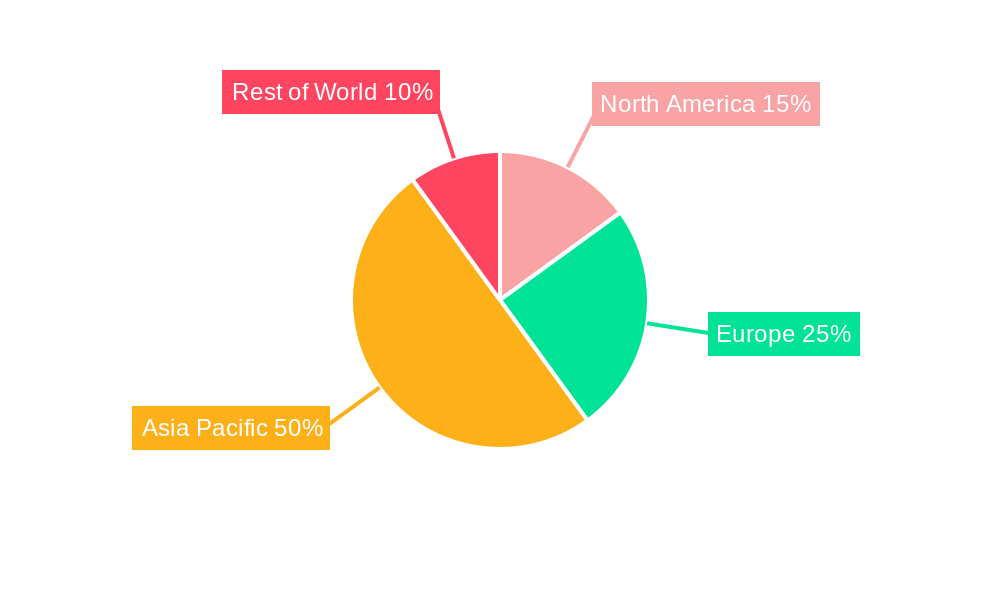
The CNG and LPG vehicle market, valued at $6.73 billion in 2025, is projected to experience robust growth, driven by increasing fuel costs, stringent emission regulations, and government incentives promoting cleaner transportation solutions. The market's 7% CAGR from 2025 to 2033 indicates a significant expansion, reaching an estimated value exceeding $12 billion by 2033. Growth is fueled by the rising adoption of CNG and LPG vehicles in passenger car and commercial vehicle segments, particularly in regions like Asia-Pacific (driven by India and China's expanding middle class and infrastructure development) and Europe (influenced by stricter environmental policies). The OEM sales channel currently dominates, though the retrofitting market is poised for substantial growth due to the increasing affordability and accessibility of conversion kits. Key players like Nissan, Volkswagen, Tata Motors, and Honda are strategically investing in CNG/LPG vehicle development and expanding their product portfolios to capture this growing market share. While the initial investment for CNG/LPG infrastructure can be a restraint, decreasing technology costs and supportive government policies are mitigating this challenge.
The segment breakdown reveals a dynamic market landscape. Passenger cars are currently the larger segment, but commercial vehicles are expected to experience faster growth due to higher fuel efficiency and lower operational costs compared to diesel and gasoline alternatives. The technological advancements in CNG and LPG engine technology are enhancing vehicle performance and reducing emissions, further driving market adoption. Regional variations exist, with Asia-Pacific emerging as the most lucrative region due to its high population density, rapidly expanding economies, and strong government support for cleaner fuel alternatives. North America and Europe, while showing steady growth, are expected to maintain a smaller market share compared to Asia-Pacific due to already established alternative fuel infrastructure and more mature automotive markets. However, increasing concerns regarding climate change and air pollution in these regions continue to drive demand for cleaner transportation options.
CNG and LPG Vehicle Market: A Comprehensive Market Report (2019-2033)
This in-depth report provides a comprehensive analysis of the CNG and LPG vehicle market, encompassing market dynamics, growth trends, regional analysis, product landscape, key players, and future outlook. The study period covers 2019-2033, with 2025 as the base and estimated year. The report segments the market by fuel type (CNG, LPG), vehicle type (passenger cars, commercial vehicles), and sales channel (OEM, retrofitting), offering granular insights into this dynamic sector. Projected market size in Million units is presented throughout, providing actionable intelligence for industry professionals.
CNG and LPG Vehicle Market Dynamics & Structure
The CNG and LPG vehicle market is characterized by a moderately concentrated landscape, with key players including Nissan Motor Co Ltd, Volkswagen AG, Tata Motors Limited, Honda Motor Company, AB VOLVO, Hyundai Motor Company, Traton SE, Suzuki Motor Corporation, IVECO SpA, and Ford Motor Company. However, the market also accommodates numerous smaller players and retrofitting businesses.
- Market Concentration: The market exhibits moderate concentration, with the top 5 players holding approximately xx% market share in 2024.
- Technological Innovation: Technological advancements, such as improved fuel efficiency, engine technology (e.g., Maruti Suzuki's S-CNG technology), and alternative fuel sources (e.g., cow dung utilization by Suzuki), are key drivers. However, high initial investment costs present a barrier to entry for some innovators.
- Regulatory Framework: Government regulations and incentives significantly impact market growth. For example, India's ambitious plan to expand CNG stations to 17,700 by 2030 is a major catalyst.
- Competitive Substitutes: Electric vehicles (EVs) and other alternative fuel vehicles pose significant competition, impacting market share.
- End-User Demographics: The primary end-users are commercial fleets and individual consumers seeking cost-effective transportation solutions. This segment is growing significantly in developing nations.
- M&A Trends: The number of M&A deals in this sector averaged xx per year during the historical period (2019-2024), primarily focusing on technology acquisition and market expansion.
CNG and LPG Vehicle Market Growth Trends & Insights
The CNG and LPG vehicle market experienced a Compound Annual Growth Rate (CAGR) of xx% during the historical period (2019-2024), reaching xx million units in 2024. Driven by government initiatives promoting cleaner fuels, cost advantages compared to gasoline/diesel, and expanding infrastructure, the market is projected to continue its growth trajectory. Market penetration for CNG and LPG vehicles is currently at xx% in major markets, but is expected to reach xx% by 2033. This growth will be propelled by increasing consumer awareness of environmental concerns and government policies favoring cleaner transportation solutions. The adoption rate is faster in regions with established gas infrastructure and supportive governmental policies. Technological advancements are driving greater fuel efficiency and improved engine performance, enhancing consumer appeal. Shifting consumer preferences toward more fuel-efficient and environmentally friendly vehicles are further boosting market growth.
Dominant Regions, Countries, or Segments in CNG and LPG Vehicle Market
India is currently the dominant region for CNG vehicles, driven by substantial government support and expanding infrastructure. The launch of the 12th CGD bidding round further underscores this position. Nigeria is also emerging as a key market, with government approval for large-scale CNG vehicle production.
- By Fuel Type: CNG dominates the market due to its wider availability and lower cost compared to LPG.
- By Vehicle Type: Commercial vehicles account for the largest segment, driven by fleet operators seeking cost savings. Passenger car adoption is also rising steadily.
- By Sales Channel: OEM sales currently hold a larger market share than retrofitting, however, the retrofitting market is showing rapid growth particularly in regions with limited access to new CNG vehicles.
Key drivers include favorable government policies (subsidies, tax breaks), expanding fuel infrastructure (CNG stations), lower fuel costs compared to gasoline/diesel, and increasing environmental awareness. The potential for growth is substantial in regions with developing economies and limited gasoline/diesel infrastructure.
CNG and LPG Vehicle Market Product Landscape
The CNG and LPG vehicle market offers a range of vehicles, from basic models to advanced options with enhanced fuel efficiency and performance features. Recent innovations include dual-fuel systems, improved fuel injection technologies, and the integration of CNG/LPG with hybrid or electric powertrains. The emphasis is on enhancing performance metrics (mileage, power output), reducing emissions, and providing cost-effective solutions to consumers. Unique selling propositions focus on economic benefits, reduced environmental impact, and improved vehicle performance.
Key Drivers, Barriers & Challenges in CNG and LPG Vehicle Market
Key Drivers:
- Government Incentives: Subsidies and tax benefits encourage adoption.
- Lower Fuel Costs: CNG and LPG remain comparatively cheaper than gasoline and diesel.
- Environmental Concerns: Rising awareness of emissions and climate change drives demand.
- Infrastructure Development: Expansion of CNG/LPG fueling stations improves accessibility.
Key Challenges:
- Limited Infrastructure: The lack of widespread CNG/LPG stations in many areas hinders market growth.
- Safety Concerns: Public perception regarding fuel storage and safety remains a concern.
- Technological Limitations: Range anxiety remains a challenge, and CNG vehicles may have lower power output compared to gasoline/diesel equivalents.
- High Initial Investment: The upfront cost of CNG/LPG vehicle conversion or purchase may deter consumers.
Emerging Opportunities in CNG and LPG Vehicle Market
- Untapped Markets: Expanding into new geographic regions with limited transportation infrastructure presents significant opportunities.
- Innovative Applications: Exploring dual-fuel or hybrid technologies offers the potential for enhanced performance and reduced emissions.
- Evolving Consumer Preferences: Catering to the increasing consumer demand for environmentally friendly and fuel-efficient vehicles is crucial.
Growth Accelerators in the CNG and LPG Vehicle Market Industry
Long-term growth will be driven by continuous technological advancements leading to enhanced fuel efficiency and performance, strategic partnerships between automakers and gas providers to optimize infrastructure and distribution, and expansion into new markets through effective marketing and distribution strategies. Increased governmental support, in the form of policies that incentivize CNG and LPG adoption, are also crucial catalysts for long-term growth.
Key Players Shaping the CNG and LPG Vehicle Market Market
- Nissan Motor Co Ltd
- Volkswagen AG
- Tata Motors Limited
- Honda Motor Company
- AB VOLVO
- Hyundai Motor Company
- Traton SE
- Suzuki Motor Corporation
- IVECO SpA
- Ford Motor Company
Notable Milestones in CNG and LPG Vehicle Market Sector
- March 2022: Maruti Suzuki India Limited launched Dzire with S-CNG technology, boosting CNG car adoption.
- January 2023: Suzuki Motor Corporation's initiative to power CNG vehicles using cow dung signifies innovative fuel exploration.
- June 2023: The National Economic Council (NEC) approved large-scale CNG vehicle production in Nigeria, indicating market expansion.
- November 2023: India's commitment to expand CNG stations to 17,700 by 2030 drastically increases CNG infrastructure and market potential.
In-Depth CNG and LPG Vehicle Market Market Outlook
The future of the CNG and LPG vehicle market is promising, with continued growth driven by supportive government policies, technological advancements, and expanding infrastructure. Strategic partnerships among automakers, fuel providers, and government agencies will play a crucial role in accelerating market penetration and creating new opportunities. The market presents strong potential for both established players and new entrants, particularly in developing economies with a need for affordable and sustainable transportation solutions.
CNG and LPG Vehicle Market Segmentation
-
1. Fuel Type
- 1.1. Compressed Natural Gas (CNG)
- 1.2. Liquefied Petroleum Gas (LPG)
-
2. Vehicle Type
- 2.1. Passenger Cars
- 2.2. Commercial Vehicles
-
3. Sales Channel
- 3.1. OEM
- 3.2. Retrofitting
CNG and LPG Vehicle Market Segmentation By Geography
-
1. North America
- 1.1. United States
- 1.2. Canada
- 1.3. Rest of North America
-
2. Europe
- 2.1. Germany
- 2.2. United Kingdom
- 2.3. France
- 2.4. Italy
- 2.5. Spain
- 2.6. Rest of Europe
-
3. Asia Pacific
- 3.1. India
- 3.2. China
- 3.3. Japan
- 3.4. South Korea
- 3.5. Rest of Asia Pacific
-
4. Rest of the World
- 4.1. South America
- 4.2. Middle East and Africa
CNG and LPG Vehicle Market REPORT HIGHLIGHTS
| Aspects | Details |
|---|---|
| Study Period | 2019-2033 |
| Base Year | 2024 |
| Estimated Year | 2025 |
| Forecast Period | 2025-2033 |
| Historical Period | 2019-2024 |
| Growth Rate | CAGR of 7.00% from 2019-2033 |
| Segmentation |
|
Table of Contents
- 1. Introduction
- 1.1. Research Scope
- 1.2. Market Segmentation
- 1.3. Research Methodology
- 1.4. Definitions and Assumptions
- 2. Executive Summary
- 2.1. Introduction
- 3. Market Dynamics
- 3.1. Introduction
- 3.2. Market Drivers
- 3.2.1. Increase in Demand for Clean Energy Driving the Market
- 3.3. Market Restrains
- 3.3.1. Rising Safety Concerns is Antcipated to Restrain the Market
- 3.4. Market Trends
- 3.4.1. Commercial Vehicles Fueling the Demand for CNG and LPG Vehicle
- 4. Market Factor Analysis
- 4.1. Porters Five Forces
- 4.2. Supply/Value Chain
- 4.3. PESTEL analysis
- 4.4. Market Entropy
- 4.5. Patent/Trademark Analysis
- 5. Global CNG and LPG Vehicle Market Analysis, Insights and Forecast, 2019-2031
- 5.1. Market Analysis, Insights and Forecast - by Fuel Type
- 5.1.1. Compressed Natural Gas (CNG)
- 5.1.2. Liquefied Petroleum Gas (LPG)
- 5.2. Market Analysis, Insights and Forecast - by Vehicle Type
- 5.2.1. Passenger Cars
- 5.2.2. Commercial Vehicles
- 5.3. Market Analysis, Insights and Forecast - by Sales Channel
- 5.3.1. OEM
- 5.3.2. Retrofitting
- 5.4. Market Analysis, Insights and Forecast - by Region
- 5.4.1. North America
- 5.4.2. Europe
- 5.4.3. Asia Pacific
- 5.4.4. Rest of the World
- 5.1. Market Analysis, Insights and Forecast - by Fuel Type
- 6. North America CNG and LPG Vehicle Market Analysis, Insights and Forecast, 2019-2031
- 6.1. Market Analysis, Insights and Forecast - by Fuel Type
- 6.1.1. Compressed Natural Gas (CNG)
- 6.1.2. Liquefied Petroleum Gas (LPG)
- 6.2. Market Analysis, Insights and Forecast - by Vehicle Type
- 6.2.1. Passenger Cars
- 6.2.2. Commercial Vehicles
- 6.3. Market Analysis, Insights and Forecast - by Sales Channel
- 6.3.1. OEM
- 6.3.2. Retrofitting
- 6.1. Market Analysis, Insights and Forecast - by Fuel Type
- 7. Europe CNG and LPG Vehicle Market Analysis, Insights and Forecast, 2019-2031
- 7.1. Market Analysis, Insights and Forecast - by Fuel Type
- 7.1.1. Compressed Natural Gas (CNG)
- 7.1.2. Liquefied Petroleum Gas (LPG)
- 7.2. Market Analysis, Insights and Forecast - by Vehicle Type
- 7.2.1. Passenger Cars
- 7.2.2. Commercial Vehicles
- 7.3. Market Analysis, Insights and Forecast - by Sales Channel
- 7.3.1. OEM
- 7.3.2. Retrofitting
- 7.1. Market Analysis, Insights and Forecast - by Fuel Type
- 8. Asia Pacific CNG and LPG Vehicle Market Analysis, Insights and Forecast, 2019-2031
- 8.1. Market Analysis, Insights and Forecast - by Fuel Type
- 8.1.1. Compressed Natural Gas (CNG)
- 8.1.2. Liquefied Petroleum Gas (LPG)
- 8.2. Market Analysis, Insights and Forecast - by Vehicle Type
- 8.2.1. Passenger Cars
- 8.2.2. Commercial Vehicles
- 8.3. Market Analysis, Insights and Forecast - by Sales Channel
- 8.3.1. OEM
- 8.3.2. Retrofitting
- 8.1. Market Analysis, Insights and Forecast - by Fuel Type
- 9. Rest of the World CNG and LPG Vehicle Market Analysis, Insights and Forecast, 2019-2031
- 9.1. Market Analysis, Insights and Forecast - by Fuel Type
- 9.1.1. Compressed Natural Gas (CNG)
- 9.1.2. Liquefied Petroleum Gas (LPG)
- 9.2. Market Analysis, Insights and Forecast - by Vehicle Type
- 9.2.1. Passenger Cars
- 9.2.2. Commercial Vehicles
- 9.3. Market Analysis, Insights and Forecast - by Sales Channel
- 9.3.1. OEM
- 9.3.2. Retrofitting
- 9.1. Market Analysis, Insights and Forecast - by Fuel Type
- 10. North America CNG and LPG Vehicle Market Analysis, Insights and Forecast, 2019-2031
- 10.1. Market Analysis, Insights and Forecast - By Country/Sub-region
- 10.1.1 United States
- 10.1.2 Canada
- 10.1.3 Rest of North America
- 11. Europe CNG and LPG Vehicle Market Analysis, Insights and Forecast, 2019-2031
- 11.1. Market Analysis, Insights and Forecast - By Country/Sub-region
- 11.1.1 Germany
- 11.1.2 United Kingdom
- 11.1.3 France
- 11.1.4 Russia
- 11.1.5 Spain
- 11.1.6 Rest of Europe
- 12. Asia Pacific CNG and LPG Vehicle Market Analysis, Insights and Forecast, 2019-2031
- 12.1. Market Analysis, Insights and Forecast - By Country/Sub-region
- 12.1.1 India
- 12.1.2 China
- 12.1.3 Japan
- 12.1.4 South Korea
- 12.1.5 Rest of Asia Pacific
- 13. Rest of the World CNG and LPG Vehicle Market Analysis, Insights and Forecast, 2019-2031
- 13.1. Market Analysis, Insights and Forecast - By Country/Sub-region
- 13.1.1 South America
- 13.1.2 Middle East and Africa
- 14. Competitive Analysis
- 14.1. Global Market Share Analysis 2024
- 14.2. Company Profiles
- 14.2.1 Nissan Motor Co Ltd
- 14.2.1.1. Overview
- 14.2.1.2. Products
- 14.2.1.3. SWOT Analysis
- 14.2.1.4. Recent Developments
- 14.2.1.5. Financials (Based on Availability)
- 14.2.2 Volkswagen AG
- 14.2.2.1. Overview
- 14.2.2.2. Products
- 14.2.2.3. SWOT Analysis
- 14.2.2.4. Recent Developments
- 14.2.2.5. Financials (Based on Availability)
- 14.2.3 Tata Motors Limited
- 14.2.3.1. Overview
- 14.2.3.2. Products
- 14.2.3.3. SWOT Analysis
- 14.2.3.4. Recent Developments
- 14.2.3.5. Financials (Based on Availability)
- 14.2.4 Honda Motor Company
- 14.2.4.1. Overview
- 14.2.4.2. Products
- 14.2.4.3. SWOT Analysis
- 14.2.4.4. Recent Developments
- 14.2.4.5. Financials (Based on Availability)
- 14.2.5 AB VOLVO
- 14.2.5.1. Overview
- 14.2.5.2. Products
- 14.2.5.3. SWOT Analysis
- 14.2.5.4. Recent Developments
- 14.2.5.5. Financials (Based on Availability)
- 14.2.6 Hyundai Motor Company
- 14.2.6.1. Overview
- 14.2.6.2. Products
- 14.2.6.3. SWOT Analysis
- 14.2.6.4. Recent Developments
- 14.2.6.5. Financials (Based on Availability)
- 14.2.7 Traton SE*List Not Exhaustive
- 14.2.7.1. Overview
- 14.2.7.2. Products
- 14.2.7.3. SWOT Analysis
- 14.2.7.4. Recent Developments
- 14.2.7.5. Financials (Based on Availability)
- 14.2.8 Suzuki Motor Corporation
- 14.2.8.1. Overview
- 14.2.8.2. Products
- 14.2.8.3. SWOT Analysis
- 14.2.8.4. Recent Developments
- 14.2.8.5. Financials (Based on Availability)
- 14.2.9 IVECO SpA
- 14.2.9.1. Overview
- 14.2.9.2. Products
- 14.2.9.3. SWOT Analysis
- 14.2.9.4. Recent Developments
- 14.2.9.5. Financials (Based on Availability)
- 14.2.10 Ford Motor Company
- 14.2.10.1. Overview
- 14.2.10.2. Products
- 14.2.10.3. SWOT Analysis
- 14.2.10.4. Recent Developments
- 14.2.10.5. Financials (Based on Availability)
- 14.2.1 Nissan Motor Co Ltd
List of Figures
- Figure 1: Global CNG and LPG Vehicle Market Revenue Breakdown (Million, %) by Region 2024 & 2032
- Figure 2: North America CNG and LPG Vehicle Market Revenue (Million), by Country 2024 & 2032
- Figure 3: North America CNG and LPG Vehicle Market Revenue Share (%), by Country 2024 & 2032
- Figure 4: Europe CNG and LPG Vehicle Market Revenue (Million), by Country 2024 & 2032
- Figure 5: Europe CNG and LPG Vehicle Market Revenue Share (%), by Country 2024 & 2032
- Figure 6: Asia Pacific CNG and LPG Vehicle Market Revenue (Million), by Country 2024 & 2032
- Figure 7: Asia Pacific CNG and LPG Vehicle Market Revenue Share (%), by Country 2024 & 2032
- Figure 8: Rest of the World CNG and LPG Vehicle Market Revenue (Million), by Country 2024 & 2032
- Figure 9: Rest of the World CNG and LPG Vehicle Market Revenue Share (%), by Country 2024 & 2032
- Figure 10: North America CNG and LPG Vehicle Market Revenue (Million), by Fuel Type 2024 & 2032
- Figure 11: North America CNG and LPG Vehicle Market Revenue Share (%), by Fuel Type 2024 & 2032
- Figure 12: North America CNG and LPG Vehicle Market Revenue (Million), by Vehicle Type 2024 & 2032
- Figure 13: North America CNG and LPG Vehicle Market Revenue Share (%), by Vehicle Type 2024 & 2032
- Figure 14: North America CNG and LPG Vehicle Market Revenue (Million), by Sales Channel 2024 & 2032
- Figure 15: North America CNG and LPG Vehicle Market Revenue Share (%), by Sales Channel 2024 & 2032
- Figure 16: North America CNG and LPG Vehicle Market Revenue (Million), by Country 2024 & 2032
- Figure 17: North America CNG and LPG Vehicle Market Revenue Share (%), by Country 2024 & 2032
- Figure 18: Europe CNG and LPG Vehicle Market Revenue (Million), by Fuel Type 2024 & 2032
- Figure 19: Europe CNG and LPG Vehicle Market Revenue Share (%), by Fuel Type 2024 & 2032
- Figure 20: Europe CNG and LPG Vehicle Market Revenue (Million), by Vehicle Type 2024 & 2032
- Figure 21: Europe CNG and LPG Vehicle Market Revenue Share (%), by Vehicle Type 2024 & 2032
- Figure 22: Europe CNG and LPG Vehicle Market Revenue (Million), by Sales Channel 2024 & 2032
- Figure 23: Europe CNG and LPG Vehicle Market Revenue Share (%), by Sales Channel 2024 & 2032
- Figure 24: Europe CNG and LPG Vehicle Market Revenue (Million), by Country 2024 & 2032
- Figure 25: Europe CNG and LPG Vehicle Market Revenue Share (%), by Country 2024 & 2032
- Figure 26: Asia Pacific CNG and LPG Vehicle Market Revenue (Million), by Fuel Type 2024 & 2032
- Figure 27: Asia Pacific CNG and LPG Vehicle Market Revenue Share (%), by Fuel Type 2024 & 2032
- Figure 28: Asia Pacific CNG and LPG Vehicle Market Revenue (Million), by Vehicle Type 2024 & 2032
- Figure 29: Asia Pacific CNG and LPG Vehicle Market Revenue Share (%), by Vehicle Type 2024 & 2032
- Figure 30: Asia Pacific CNG and LPG Vehicle Market Revenue (Million), by Sales Channel 2024 & 2032
- Figure 31: Asia Pacific CNG and LPG Vehicle Market Revenue Share (%), by Sales Channel 2024 & 2032
- Figure 32: Asia Pacific CNG and LPG Vehicle Market Revenue (Million), by Country 2024 & 2032
- Figure 33: Asia Pacific CNG and LPG Vehicle Market Revenue Share (%), by Country 2024 & 2032
- Figure 34: Rest of the World CNG and LPG Vehicle Market Revenue (Million), by Fuel Type 2024 & 2032
- Figure 35: Rest of the World CNG and LPG Vehicle Market Revenue Share (%), by Fuel Type 2024 & 2032
- Figure 36: Rest of the World CNG and LPG Vehicle Market Revenue (Million), by Vehicle Type 2024 & 2032
- Figure 37: Rest of the World CNG and LPG Vehicle Market Revenue Share (%), by Vehicle Type 2024 & 2032
- Figure 38: Rest of the World CNG and LPG Vehicle Market Revenue (Million), by Sales Channel 2024 & 2032
- Figure 39: Rest of the World CNG and LPG Vehicle Market Revenue Share (%), by Sales Channel 2024 & 2032
- Figure 40: Rest of the World CNG and LPG Vehicle Market Revenue (Million), by Country 2024 & 2032
- Figure 41: Rest of the World CNG and LPG Vehicle Market Revenue Share (%), by Country 2024 & 2032
List of Tables
- Table 1: Global CNG and LPG Vehicle Market Revenue Million Forecast, by Region 2019 & 2032
- Table 2: Global CNG and LPG Vehicle Market Revenue Million Forecast, by Fuel Type 2019 & 2032
- Table 3: Global CNG and LPG Vehicle Market Revenue Million Forecast, by Vehicle Type 2019 & 2032
- Table 4: Global CNG and LPG Vehicle Market Revenue Million Forecast, by Sales Channel 2019 & 2032
- Table 5: Global CNG and LPG Vehicle Market Revenue Million Forecast, by Region 2019 & 2032
- Table 6: Global CNG and LPG Vehicle Market Revenue Million Forecast, by Country 2019 & 2032
- Table 7: United States CNG and LPG Vehicle Market Revenue (Million) Forecast, by Application 2019 & 2032
- Table 8: Canada CNG and LPG Vehicle Market Revenue (Million) Forecast, by Application 2019 & 2032
- Table 9: Rest of North America CNG and LPG Vehicle Market Revenue (Million) Forecast, by Application 2019 & 2032
- Table 10: Global CNG and LPG Vehicle Market Revenue Million Forecast, by Country 2019 & 2032
- Table 11: Germany CNG and LPG Vehicle Market Revenue (Million) Forecast, by Application 2019 & 2032
- Table 12: United Kingdom CNG and LPG Vehicle Market Revenue (Million) Forecast, by Application 2019 & 2032
- Table 13: France CNG and LPG Vehicle Market Revenue (Million) Forecast, by Application 2019 & 2032
- Table 14: Russia CNG and LPG Vehicle Market Revenue (Million) Forecast, by Application 2019 & 2032
- Table 15: Spain CNG and LPG Vehicle Market Revenue (Million) Forecast, by Application 2019 & 2032
- Table 16: Rest of Europe CNG and LPG Vehicle Market Revenue (Million) Forecast, by Application 2019 & 2032
- Table 17: Global CNG and LPG Vehicle Market Revenue Million Forecast, by Country 2019 & 2032
- Table 18: India CNG and LPG Vehicle Market Revenue (Million) Forecast, by Application 2019 & 2032
- Table 19: China CNG and LPG Vehicle Market Revenue (Million) Forecast, by Application 2019 & 2032
- Table 20: Japan CNG and LPG Vehicle Market Revenue (Million) Forecast, by Application 2019 & 2032
- Table 21: South Korea CNG and LPG Vehicle Market Revenue (Million) Forecast, by Application 2019 & 2032
- Table 22: Rest of Asia Pacific CNG and LPG Vehicle Market Revenue (Million) Forecast, by Application 2019 & 2032
- Table 23: Global CNG and LPG Vehicle Market Revenue Million Forecast, by Country 2019 & 2032
- Table 24: South America CNG and LPG Vehicle Market Revenue (Million) Forecast, by Application 2019 & 2032
- Table 25: Middle East and Africa CNG and LPG Vehicle Market Revenue (Million) Forecast, by Application 2019 & 2032
- Table 26: Global CNG and LPG Vehicle Market Revenue Million Forecast, by Fuel Type 2019 & 2032
- Table 27: Global CNG and LPG Vehicle Market Revenue Million Forecast, by Vehicle Type 2019 & 2032
- Table 28: Global CNG and LPG Vehicle Market Revenue Million Forecast, by Sales Channel 2019 & 2032
- Table 29: Global CNG and LPG Vehicle Market Revenue Million Forecast, by Country 2019 & 2032
- Table 30: United States CNG and LPG Vehicle Market Revenue (Million) Forecast, by Application 2019 & 2032
- Table 31: Canada CNG and LPG Vehicle Market Revenue (Million) Forecast, by Application 2019 & 2032
- Table 32: Rest of North America CNG and LPG Vehicle Market Revenue (Million) Forecast, by Application 2019 & 2032
- Table 33: Global CNG and LPG Vehicle Market Revenue Million Forecast, by Fuel Type 2019 & 2032
- Table 34: Global CNG and LPG Vehicle Market Revenue Million Forecast, by Vehicle Type 2019 & 2032
- Table 35: Global CNG and LPG Vehicle Market Revenue Million Forecast, by Sales Channel 2019 & 2032
- Table 36: Global CNG and LPG Vehicle Market Revenue Million Forecast, by Country 2019 & 2032
- Table 37: Germany CNG and LPG Vehicle Market Revenue (Million) Forecast, by Application 2019 & 2032
- Table 38: United Kingdom CNG and LPG Vehicle Market Revenue (Million) Forecast, by Application 2019 & 2032
- Table 39: France CNG and LPG Vehicle Market Revenue (Million) Forecast, by Application 2019 & 2032
- Table 40: Italy CNG and LPG Vehicle Market Revenue (Million) Forecast, by Application 2019 & 2032
- Table 41: Spain CNG and LPG Vehicle Market Revenue (Million) Forecast, by Application 2019 & 2032
- Table 42: Rest of Europe CNG and LPG Vehicle Market Revenue (Million) Forecast, by Application 2019 & 2032
- Table 43: Global CNG and LPG Vehicle Market Revenue Million Forecast, by Fuel Type 2019 & 2032
- Table 44: Global CNG and LPG Vehicle Market Revenue Million Forecast, by Vehicle Type 2019 & 2032
- Table 45: Global CNG and LPG Vehicle Market Revenue Million Forecast, by Sales Channel 2019 & 2032
- Table 46: Global CNG and LPG Vehicle Market Revenue Million Forecast, by Country 2019 & 2032
- Table 47: India CNG and LPG Vehicle Market Revenue (Million) Forecast, by Application 2019 & 2032
- Table 48: China CNG and LPG Vehicle Market Revenue (Million) Forecast, by Application 2019 & 2032
- Table 49: Japan CNG and LPG Vehicle Market Revenue (Million) Forecast, by Application 2019 & 2032
- Table 50: South Korea CNG and LPG Vehicle Market Revenue (Million) Forecast, by Application 2019 & 2032
- Table 51: Rest of Asia Pacific CNG and LPG Vehicle Market Revenue (Million) Forecast, by Application 2019 & 2032
- Table 52: Global CNG and LPG Vehicle Market Revenue Million Forecast, by Fuel Type 2019 & 2032
- Table 53: Global CNG and LPG Vehicle Market Revenue Million Forecast, by Vehicle Type 2019 & 2032
- Table 54: Global CNG and LPG Vehicle Market Revenue Million Forecast, by Sales Channel 2019 & 2032
- Table 55: Global CNG and LPG Vehicle Market Revenue Million Forecast, by Country 2019 & 2032
- Table 56: South America CNG and LPG Vehicle Market Revenue (Million) Forecast, by Application 2019 & 2032
- Table 57: Middle East and Africa CNG and LPG Vehicle Market Revenue (Million) Forecast, by Application 2019 & 2032
Frequently Asked Questions
1. What is the projected Compound Annual Growth Rate (CAGR) of the CNG and LPG Vehicle Market?
The projected CAGR is approximately 7.00%.
2. Which companies are prominent players in the CNG and LPG Vehicle Market?
Key companies in the market include Nissan Motor Co Ltd, Volkswagen AG, Tata Motors Limited, Honda Motor Company, AB VOLVO, Hyundai Motor Company, Traton SE*List Not Exhaustive, Suzuki Motor Corporation, IVECO SpA, Ford Motor Company.
3. What are the main segments of the CNG and LPG Vehicle Market?
The market segments include Fuel Type, Vehicle Type, Sales Channel.
4. Can you provide details about the market size?
The market size is estimated to be USD 6.73 Million as of 2022.
5. What are some drivers contributing to market growth?
Increase in Demand for Clean Energy Driving the Market.
6. What are the notable trends driving market growth?
Commercial Vehicles Fueling the Demand for CNG and LPG Vehicle.
7. Are there any restraints impacting market growth?
Rising Safety Concerns is Antcipated to Restrain the Market.
8. Can you provide examples of recent developments in the market?
November 2023: The government of India committed to significantly expanding the network of CNG stations, setting an ambitious target to increase the count from 6,000 to 17,700 by 2030. In October, this initiative gained further momentum with the launch of the 12th City Gas Distribution (CGD) bidding round. This strategic move is aimed at closing the gaps in the existing gas infrastructure, a step that is expected to substantially drive the growth of the CNG vehicle market.
9. What pricing options are available for accessing the report?
Pricing options include single-user, multi-user, and enterprise licenses priced at USD 4750, USD 5250, and USD 8750 respectively.
10. Is the market size provided in terms of value or volume?
The market size is provided in terms of value, measured in Million.
11. Are there any specific market keywords associated with the report?
Yes, the market keyword associated with the report is "CNG and LPG Vehicle Market," which aids in identifying and referencing the specific market segment covered.
12. How do I determine which pricing option suits my needs best?
The pricing options vary based on user requirements and access needs. Individual users may opt for single-user licenses, while businesses requiring broader access may choose multi-user or enterprise licenses for cost-effective access to the report.
13. Are there any additional resources or data provided in the CNG and LPG Vehicle Market report?
While the report offers comprehensive insights, it's advisable to review the specific contents or supplementary materials provided to ascertain if additional resources or data are available.
14. How can I stay updated on further developments or reports in the CNG and LPG Vehicle Market?
To stay informed about further developments, trends, and reports in the CNG and LPG Vehicle Market, consider subscribing to industry newsletters, following relevant companies and organizations, or regularly checking reputable industry news sources and publications.
Methodology
Step 1 - Identification of Relevant Samples Size from Population Database


Step 2 - Approaches for Defining Global Market Size (Value, Volume* & Price*)

Note*: In applicable scenarios
Step 3 - Data Sources
Primary Research
- Web Analytics
- Survey Reports
- Research Institute
- Latest Research Reports
- Opinion Leaders
Secondary Research
- Annual Reports
- White Paper
- Latest Press Release
- Industry Association
- Paid Database
- Investor Presentations

Step 4 - Data Triangulation
Involves using different sources of information in order to increase the validity of a study
These sources are likely to be stakeholders in a program - participants, other researchers, program staff, other community members, and so on.
Then we put all data in single framework & apply various statistical tools to find out the dynamic on the market.
During the analysis stage, feedback from the stakeholder groups would be compared to determine areas of agreement as well as areas of divergence
