

Key Insights
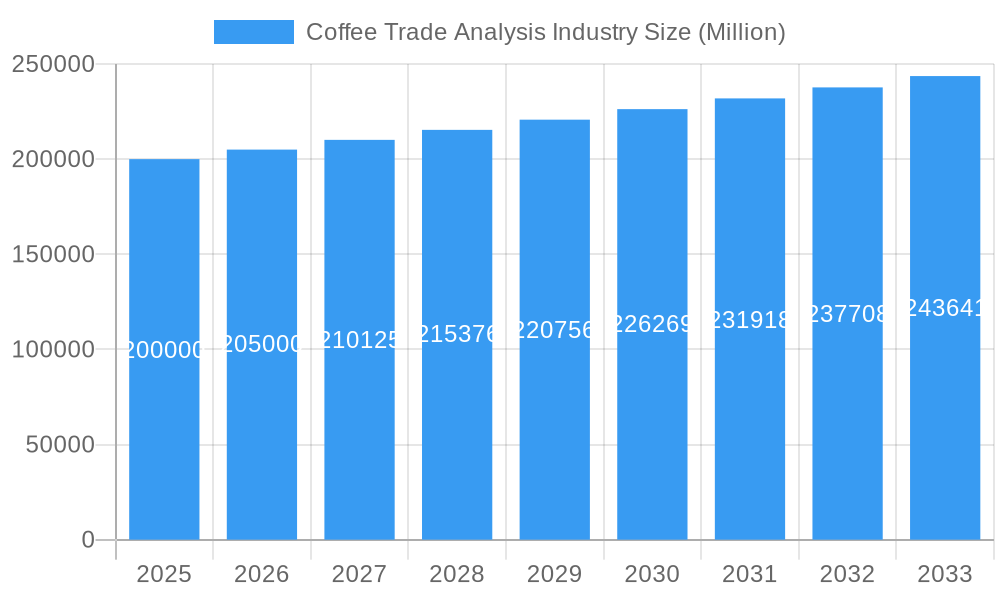
The global coffee trade, a multi-billion dollar industry, is experiencing steady growth, projected at a Compound Annual Growth Rate (CAGR) of 2.50% between 2025 and 2033. This growth is driven by several factors, including rising global disposable incomes, increasing consumer preference for premium coffee varieties like Arabica, and the expanding popularity of convenient coffee formats such as instant and soluble coffee. The market is segmented by bean type (Arabica, Robusta), processing method (washed, natural, honey), and end-use (roasted, instant, soluble, green). Arabica coffee currently dominates the market due to its superior taste and aroma, but Robusta, with its stronger flavor profile and lower cost, continues to hold a significant share, particularly in the instant coffee segment. The shift towards convenient consumption is evident in the strong growth of instant and soluble coffee, driven by busy lifestyles and increasing demand for ready-to-drink options. However, challenges remain, including fluctuations in coffee bean prices due to climate change and geopolitical instability, and increasing competition among major players like JDE Peet's, Starbucks, Keurig Dr Pepper, Nestlé, and Jacobs Douwe Egberts. Regional variations also exist, with North America and Europe representing mature markets with a focus on premiumization and specialty coffee, while Asia-Pacific exhibits high growth potential due to rising consumption in emerging economies like China and India.
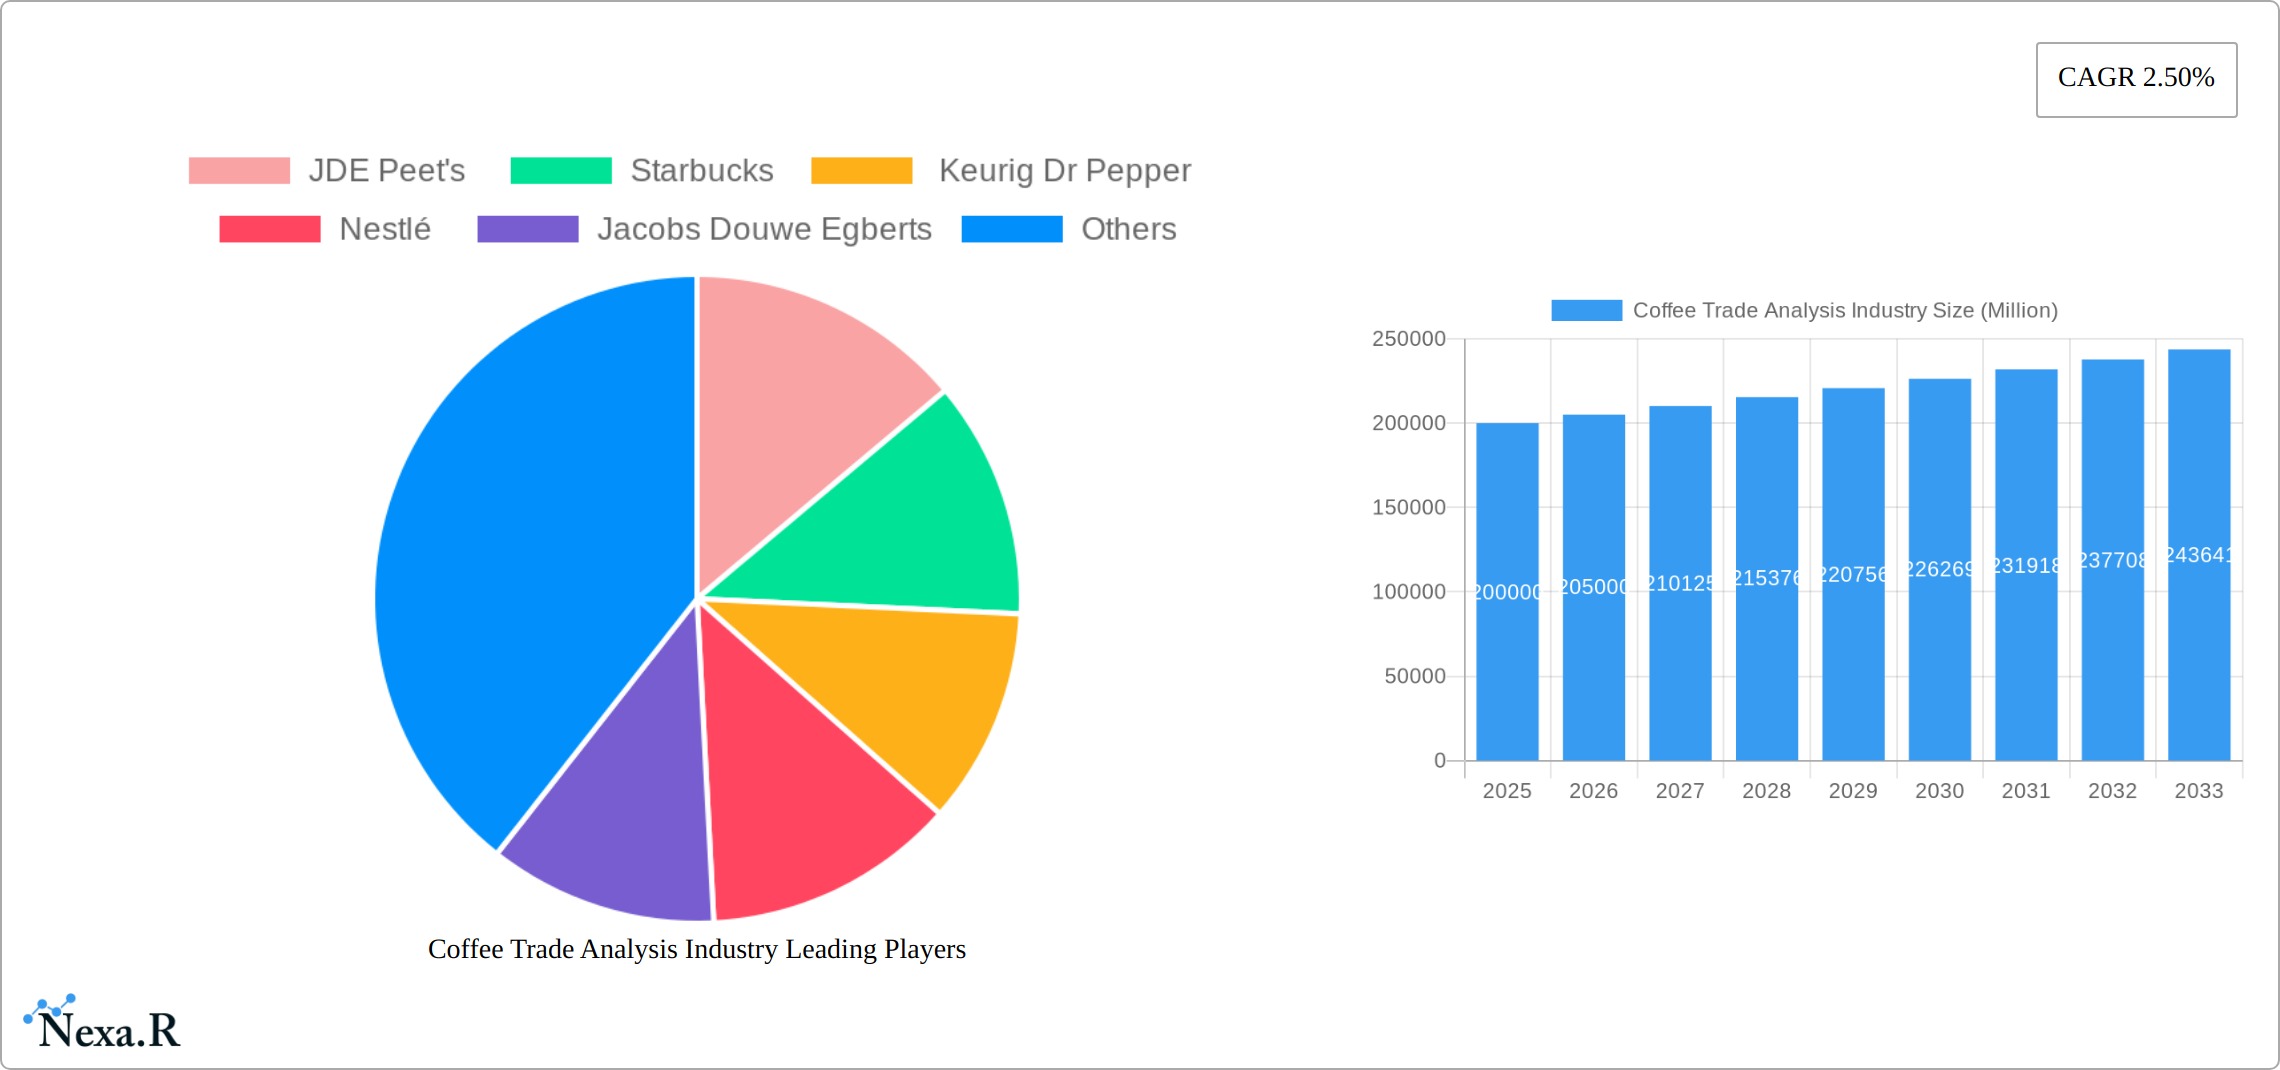
Coffee Trade Analysis Industry Market Size (In Billion)
Market restraints include the impact of climate change on coffee bean production, potential supply chain disruptions, and evolving consumer preferences toward sustainable and ethically sourced coffee. Companies are responding by investing in sustainable farming practices and transparent supply chains to meet consumer demands. The competitive landscape is intense, characterized by mergers and acquisitions, brand building, and innovation in product offerings. Future growth is expected to be fueled by product diversification, the expansion of e-commerce channels, and the increasing adoption of single-serve coffee brewing systems. The continuous development of new coffee blends and flavors catering to specific taste preferences will also contribute significantly to market expansion in the coming years. Specific regional growth will depend on factors such as economic growth, changing demographics, and cultural coffee consumption habits.
Coffee Trade Analysis Industry Company Market Share
Coffee Trade Analysis Industry: 2019-2033 Market Report
This comprehensive report provides a detailed analysis of the Coffee Trade Analysis Industry, encompassing market dynamics, growth trends, dominant segments, and key players. The study period covers 2019-2033, with a base year of 2025 and a forecast period of 2025-2033. The report leverages extensive data analysis to offer actionable insights for industry professionals, investors, and stakeholders. This in-depth analysis covers the parent market of the Beverage Industry and the child market of Coffee to offer a complete overview. The global market value is expected to reach xx Million by 2033.
Coffee Trade Analysis Industry Market Dynamics & Structure
The global coffee trade is a dynamic and complex market, shaped by a confluence of influential factors. These include the degree of market concentration, the pace of technological innovation, the evolution of regulatory frameworks, the intensity of competitive dynamics, and the ever-shifting landscape of consumer preferences. Currently, the market exhibits moderate to high concentration, with formidable global players such as JDE Peet's, Nestlé, and Starbucks commanding substantial market shares. Nevertheless, the ecosystem is further enlivened by a significant presence of numerous smaller, agile, and often regionally focused players, fostering a vibrant and competitive environment.
- Market Concentration: The top 5 players are estimated to hold approximately 60-70% of the global market share in 2025, underscoring the influence of established brands.
- Technological Innovation: Advancements in automation are revolutionizing farming techniques, processing methods, and packaging solutions. However, the substantial initial investment required for these technologies can present a considerable barrier to entry for smaller enterprises.
- Regulatory Frameworks: A diverse array of regulations governing coffee cultivation, processing, and labeling across different nations significantly influences market dynamics. The increasing prominence of fair trade certifications and rigorous sustainability standards is a noteworthy trend, driving responsible practices throughout the supply chain.
- Competitive Product Substitutes: The market faces robust competition from a range of alternative beverages, including tea, energy drinks, and other consumer favorites. Shifting consumer priorities, particularly a growing emphasis on health and wellness, are continuously reshaping the competitive landscape and demanding product differentiation.
- End-User Demographics: The burgeoning influence of Millennials and Gen Z is a key demographic trend, with these groups increasingly driving demand for premium specialty coffee offerings and products with demonstrable sustainable and ethical sourcing. Furthermore, the expansion of disposable incomes in emerging markets is unlocking substantial new growth avenues for the coffee industry.
- M&A Trends: The past five years have witnessed a notable wave of approximately 40-50 Mergers & Acquisitions (M&A) deals within the coffee trade sector. These strategic consolidations have primarily focused on expanding geographic reach and diversifying product portfolios. The trend of consolidation is anticipated to persist, propelled by the pursuit of economies of scale, enhanced market access, and synergistic operational benefits.
Coffee Trade Analysis Industry Growth Trends & Insights
The coffee trade industry is demonstrating a trajectory of robust and sustained growth, primarily fueled by a consistent increase in global coffee consumption and the dynamic evolution of consumer preferences. The market size impressively expanded from approximately $120 billion in 2019 to an estimated $150 billion in 2024, reflecting a Compound Annual Growth Rate (CAGR) of around 4.5%. This expansion is underpinned by several key factors, including rising disposable incomes globally, increasing urbanization, and the escalating popularity of specialty and premium coffee experiences. Technological disruptions have also played a pivotal role, with the advent of online coffee retailers and convenient subscription services significantly enhancing accessibility and consumer convenience. A pronounced shift in consumer behavior towards premiumization is evident, with consumers demonstrating a greater willingness to invest in high-quality, ethically sourced, and traceable coffee products. The growing consumer consciousness regarding sustainability and ethical production practices is a significant growth driver within this segment. Projections indicate that the market is poised for continued expansion, expected to reach an estimated $200 billion by 2033, with a projected CAGR of approximately 3.8% during the forecast period.
Dominant Regions, Countries, or Segments in Coffee Trade Analysis Industry
The global coffee market is characterized by significant geographical diversity, with distinct variations in consumption patterns and production capabilities across various regions. Within specific market segments, Arabica coffee undeniably dominates the bean type market, largely attributed to its superior, nuanced flavor profile and its command of a higher price point. The washed coffee processing method also holds a substantial share, a preference driven by its ability to yield a cleaner, more consistent taste. In terms of end-use, roasted coffee continues to be the most dominant segment, aligning with entrenched traditional consumer preferences and habits.
- Dominant Regions: North America and Europe remain pivotal consumption hubs. However, the Asia-Pacific and Latin America regions are exhibiting particularly high growth potential, propelled by burgeoning middle classes, rising disposable incomes, and evolving lifestyle patterns.
- Dominant Bean Type: Arabica coffee accounts for approximately 60-70% of the global market share, celebrated for its aromatic qualities and complex flavor notes.
- Dominant Processing Method: The washed coffee processing method commands a major share, valued for its capacity to enhance the inherent quality and produce a consistently bright and clean cup.
- Dominant End-Use: Roasted coffee continues its reign as the dominant end-use segment, holding an estimated market share of 75-80%, catering to a broad spectrum of consumer needs.
- Key Drivers: Sustainable economic growth, the expanding global middle class, accelerating urbanization, and fundamental shifts in consumption patterns are the primary forces propelling market growth across these segments.
Coffee Trade Analysis Industry Product Landscape
The coffee product landscape is characterized by innovation in both bean varieties and processing methods, leading to a wide range of offerings. Single-origin coffees, specialty blends, and innovative brewing methods cater to diverse consumer preferences. Technological advancements in roasting and extraction techniques are improving coffee quality and enhancing the consumer experience. Unique selling propositions are increasingly focused on sustainability, ethical sourcing, and unique flavor profiles.
Key Drivers, Barriers & Challenges in Coffee Trade Analysis Industry
Key Drivers: The upward trend in disposable incomes, coupled with increasing urbanization and a pronounced consumer preference for premium and specialty coffee experiences, are the principal catalysts for market expansion. Technological advancements in agricultural practices, processing efficiencies, and innovative packaging solutions are further enhancing product quality and operational effectiveness. Moreover, supportive government initiatives aimed at promoting sustainable coffee farming and fair trade practices are contributing positively to the overall growth and ethical development of the market.
Key Challenges: Climate change poses a significant and escalating threat to coffee production, leading to unpredictable yield fluctuations and potential disruptions within global supply chains. Volatility in coffee bean prices presents a persistent challenge for both producers, impacting their profitability, and consumers, influencing affordability. The intense competition from a wide array of substitute beverages necessitates continuous product innovation, effective marketing strategies, and a keen understanding of evolving consumer tastes to maintain market relevance.
Emerging Opportunities in Coffee Trade Analysis Industry
Significant untapped market potential exists within developing economies, offering substantial growth prospects. Concurrently, the escalating global demand for sustainably and ethically sourced coffee presents a compelling opportunity for brands to differentiate themselves and cater to a conscious consumer base. Innovation in coffee brewing methods, from advanced home brewing systems to sophisticated café experiences, alongside the continued proliferation of specialty coffee shops, is creating exciting and dynamic market prospects. The enduring trend of single-serve coffee pods continues to fuel market expansion by offering unparalleled convenience. Furthermore, the growing segment of health-conscious consumers is driving demand for low-calorie, organic, and functional coffee options, opening new avenues for product development and market penetration.
Growth Accelerators in the Coffee Trade Analysis Industry Industry
Technological advancements in coffee farming, processing, and brewing are fostering efficiency and quality. Strategic partnerships between coffee producers, retailers, and technology providers are improving supply chain management and enhancing the customer experience. Expansion into new markets and the development of innovative coffee products will sustain market momentum.
Key Players Shaping the Coffee Trade Analysis Industry Market
- JDE Peet's
- Starbucks
- Keurig Dr Pepper
- Nestlé
- Jacobs Douwe Egberts (Note: JDE Peet's acquired Jacobs Douwe Egberts)
Notable Milestones in Coffee Trade Analysis Industry Sector
- October 2022: Nestlé committed over USD 1 billion to a sustainable coffee farming plan.
- December 2022: The US Government launched the Indonesia Coffee Enterprise Resilience Initiative.
- January 2023: Coffee exported from India increased by nearly 2% to 400,000 tons in 2022, with a 16.73% rise in instant coffee exports.
In-Depth Coffee Trade Analysis Industry Market Outlook
The coffee trade industry is poised for continued growth, driven by ongoing innovation, evolving consumer preferences, and expansion into new markets. Strategic partnerships, investments in sustainable practices, and technological advancements will further fuel market expansion. The industry's future hinges on addressing climate change impacts and ensuring the long-term sustainability of coffee production. The focus on premiumization and specialized offerings will continue to drive higher value segments of the market.
Coffee Trade Analysis Industry Segmentation
- 1. Production Analysis
- 2. Consumption Analysis
- 3. Import Market Analysis (Value & Volume)
- 4. Export Market Analysis (Value & Volume)
- 5. Price Trend Analysis
Coffee Trade Analysis Industry Segmentation By Geography
-
1. North America
- 1.1. United States
- 1.2. Canada
- 1.3. Mexico
-
2. Europe
- 2.1. United Kingdom
- 2.2. Denmark
- 2.3. Netherlands
- 2.4. Germany
- 2.5. Norway
- 2.6. Sweden
-
3. Asia Pacific
- 3.1. China
- 3.2. India
- 3.3. Japan
- 3.4. Indonesia
- 3.5. Philippines
-
4. South America
- 4.1. Brazil
- 4.2. Argentina
-
5. Africa
- 5.1. South Africa
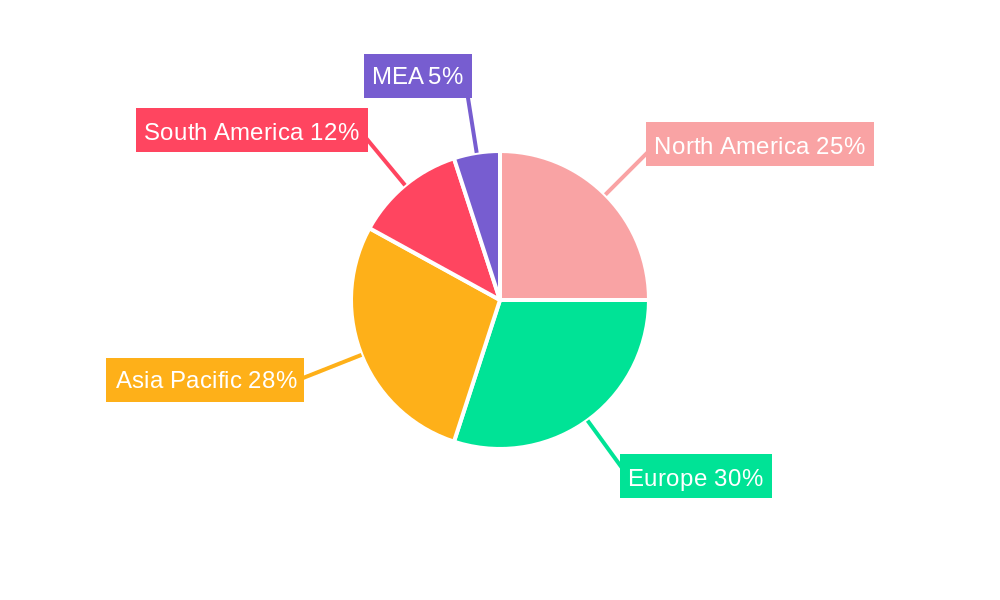
Coffee Trade Analysis Industry Regional Market Share
Geographic Coverage of Coffee Trade Analysis Industry
Coffee Trade Analysis Industry REPORT HIGHLIGHTS
| Aspects | Details |
|---|---|
| Study Period | 2020-2034 |
| Base Year | 2025 |
| Estimated Year | 2026 |
| Forecast Period | 2026-2034 |
| Historical Period | 2020-2025 |
| Growth Rate | CAGR of 2.50% from 2020-2034 |
| Segmentation |
|
Table of Contents
- 1. Introduction
- 1.1. Research Scope
- 1.2. Market Segmentation
- 1.3. Research Methodology
- 1.4. Definitions and Assumptions
- 2. Executive Summary
- 2.1. Introduction
- 3. Market Dynamics
- 3.1. Introduction
- 3.2. Market Drivers
- 3.2.1. Rising Consumption of Cashew Nuts in the Country; Favorable Government Initiatives
- 3.3. Market Restrains
- 3.3.1. Hazardous Climatic Condition Hinders Cashew Production; Stringent Regulations Related to Food Quality Standards
- 3.4. Market Trends
- 3.4.1. United States Dominates the Global Imports
- 4. Market Factor Analysis
- 4.1. Porters Five Forces
- 4.2. Supply/Value Chain
- 4.3. PESTEL analysis
- 4.4. Market Entropy
- 4.5. Patent/Trademark Analysis
- 5. Global Coffee Trade Analysis Industry Analysis, Insights and Forecast, 2020-2032
- 5.1. Market Analysis, Insights and Forecast - by Production Analysis
- 5.2. Market Analysis, Insights and Forecast - by Consumption Analysis
- 5.3. Market Analysis, Insights and Forecast - by Import Market Analysis (Value & Volume)
- 5.4. Market Analysis, Insights and Forecast - by Export Market Analysis (Value & Volume)
- 5.5. Market Analysis, Insights and Forecast - by Price Trend Analysis
- 5.6. Market Analysis, Insights and Forecast - by Region
- 5.6.1. North America
- 5.6.2. Europe
- 5.6.3. Asia Pacific
- 5.6.4. South America
- 5.6.5. Africa
- 5.1. Market Analysis, Insights and Forecast - by Production Analysis
- 6. North America Coffee Trade Analysis Industry Analysis, Insights and Forecast, 2020-2032
- 6.1. Market Analysis, Insights and Forecast - by Production Analysis
- 6.2. Market Analysis, Insights and Forecast - by Consumption Analysis
- 6.3. Market Analysis, Insights and Forecast - by Import Market Analysis (Value & Volume)
- 6.4. Market Analysis, Insights and Forecast - by Export Market Analysis (Value & Volume)
- 6.5. Market Analysis, Insights and Forecast - by Price Trend Analysis
- 6.1. Market Analysis, Insights and Forecast - by Production Analysis
- 7. Europe Coffee Trade Analysis Industry Analysis, Insights and Forecast, 2020-2032
- 7.1. Market Analysis, Insights and Forecast - by Production Analysis
- 7.2. Market Analysis, Insights and Forecast - by Consumption Analysis
- 7.3. Market Analysis, Insights and Forecast - by Import Market Analysis (Value & Volume)
- 7.4. Market Analysis, Insights and Forecast - by Export Market Analysis (Value & Volume)
- 7.5. Market Analysis, Insights and Forecast - by Price Trend Analysis
- 7.1. Market Analysis, Insights and Forecast - by Production Analysis
- 8. Asia Pacific Coffee Trade Analysis Industry Analysis, Insights and Forecast, 2020-2032
- 8.1. Market Analysis, Insights and Forecast - by Production Analysis
- 8.2. Market Analysis, Insights and Forecast - by Consumption Analysis
- 8.3. Market Analysis, Insights and Forecast - by Import Market Analysis (Value & Volume)
- 8.4. Market Analysis, Insights and Forecast - by Export Market Analysis (Value & Volume)
- 8.5. Market Analysis, Insights and Forecast - by Price Trend Analysis
- 8.1. Market Analysis, Insights and Forecast - by Production Analysis
- 9. South America Coffee Trade Analysis Industry Analysis, Insights and Forecast, 2020-2032
- 9.1. Market Analysis, Insights and Forecast - by Production Analysis
- 9.2. Market Analysis, Insights and Forecast - by Consumption Analysis
- 9.3. Market Analysis, Insights and Forecast - by Import Market Analysis (Value & Volume)
- 9.4. Market Analysis, Insights and Forecast - by Export Market Analysis (Value & Volume)
- 9.5. Market Analysis, Insights and Forecast - by Price Trend Analysis
- 9.1. Market Analysis, Insights and Forecast - by Production Analysis
- 10. Africa Coffee Trade Analysis Industry Analysis, Insights and Forecast, 2020-2032
- 10.1. Market Analysis, Insights and Forecast - by Production Analysis
- 10.2. Market Analysis, Insights and Forecast - by Consumption Analysis
- 10.3. Market Analysis, Insights and Forecast - by Import Market Analysis (Value & Volume)
- 10.4. Market Analysis, Insights and Forecast - by Export Market Analysis (Value & Volume)
- 10.5. Market Analysis, Insights and Forecast - by Price Trend Analysis
- 10.1. Market Analysis, Insights and Forecast - by Production Analysis
- 11. Competitive Analysis
- 11.1. Global Market Share Analysis 2025
- 11.2. Company Profiles
- 11.2.1 JDE Peet's
- 11.2.1.1. Overview
- 11.2.1.2. Products
- 11.2.1.3. SWOT Analysis
- 11.2.1.4. Recent Developments
- 11.2.1.5. Financials (Based on Availability)
- 11.2.2 Starbucks
- 11.2.2.1. Overview
- 11.2.2.2. Products
- 11.2.2.3. SWOT Analysis
- 11.2.2.4. Recent Developments
- 11.2.2.5. Financials (Based on Availability)
- 11.2.3 Keurig Dr Pepper
- 11.2.3.1. Overview
- 11.2.3.2. Products
- 11.2.3.3. SWOT Analysis
- 11.2.3.4. Recent Developments
- 11.2.3.5. Financials (Based on Availability)
- 11.2.4 Nestlé
- 11.2.4.1. Overview
- 11.2.4.2. Products
- 11.2.4.3. SWOT Analysis
- 11.2.4.4. Recent Developments
- 11.2.4.5. Financials (Based on Availability)
- 11.2.5 Jacobs Douwe Egberts
- 11.2.5.1. Overview
- 11.2.5.2. Products
- 11.2.5.3. SWOT Analysis
- 11.2.5.4. Recent Developments
- 11.2.5.5. Financials (Based on Availability)
- 11.2.1 JDE Peet's
List of Figures
- Figure 1: Global Coffee Trade Analysis Industry Revenue Breakdown (Million, %) by Region 2025 & 2033
- Figure 2: North America Coffee Trade Analysis Industry Revenue (Million), by Production Analysis 2025 & 2033
- Figure 3: North America Coffee Trade Analysis Industry Revenue Share (%), by Production Analysis 2025 & 2033
- Figure 4: North America Coffee Trade Analysis Industry Revenue (Million), by Consumption Analysis 2025 & 2033
- Figure 5: North America Coffee Trade Analysis Industry Revenue Share (%), by Consumption Analysis 2025 & 2033
- Figure 6: North America Coffee Trade Analysis Industry Revenue (Million), by Import Market Analysis (Value & Volume) 2025 & 2033
- Figure 7: North America Coffee Trade Analysis Industry Revenue Share (%), by Import Market Analysis (Value & Volume) 2025 & 2033
- Figure 8: North America Coffee Trade Analysis Industry Revenue (Million), by Export Market Analysis (Value & Volume) 2025 & 2033
- Figure 9: North America Coffee Trade Analysis Industry Revenue Share (%), by Export Market Analysis (Value & Volume) 2025 & 2033
- Figure 10: North America Coffee Trade Analysis Industry Revenue (Million), by Price Trend Analysis 2025 & 2033
- Figure 11: North America Coffee Trade Analysis Industry Revenue Share (%), by Price Trend Analysis 2025 & 2033
- Figure 12: North America Coffee Trade Analysis Industry Revenue (Million), by Country 2025 & 2033
- Figure 13: North America Coffee Trade Analysis Industry Revenue Share (%), by Country 2025 & 2033
- Figure 14: Europe Coffee Trade Analysis Industry Revenue (Million), by Production Analysis 2025 & 2033
- Figure 15: Europe Coffee Trade Analysis Industry Revenue Share (%), by Production Analysis 2025 & 2033
- Figure 16: Europe Coffee Trade Analysis Industry Revenue (Million), by Consumption Analysis 2025 & 2033
- Figure 17: Europe Coffee Trade Analysis Industry Revenue Share (%), by Consumption Analysis 2025 & 2033
- Figure 18: Europe Coffee Trade Analysis Industry Revenue (Million), by Import Market Analysis (Value & Volume) 2025 & 2033
- Figure 19: Europe Coffee Trade Analysis Industry Revenue Share (%), by Import Market Analysis (Value & Volume) 2025 & 2033
- Figure 20: Europe Coffee Trade Analysis Industry Revenue (Million), by Export Market Analysis (Value & Volume) 2025 & 2033
- Figure 21: Europe Coffee Trade Analysis Industry Revenue Share (%), by Export Market Analysis (Value & Volume) 2025 & 2033
- Figure 22: Europe Coffee Trade Analysis Industry Revenue (Million), by Price Trend Analysis 2025 & 2033
- Figure 23: Europe Coffee Trade Analysis Industry Revenue Share (%), by Price Trend Analysis 2025 & 2033
- Figure 24: Europe Coffee Trade Analysis Industry Revenue (Million), by Country 2025 & 2033
- Figure 25: Europe Coffee Trade Analysis Industry Revenue Share (%), by Country 2025 & 2033
- Figure 26: Asia Pacific Coffee Trade Analysis Industry Revenue (Million), by Production Analysis 2025 & 2033
- Figure 27: Asia Pacific Coffee Trade Analysis Industry Revenue Share (%), by Production Analysis 2025 & 2033
- Figure 28: Asia Pacific Coffee Trade Analysis Industry Revenue (Million), by Consumption Analysis 2025 & 2033
- Figure 29: Asia Pacific Coffee Trade Analysis Industry Revenue Share (%), by Consumption Analysis 2025 & 2033
- Figure 30: Asia Pacific Coffee Trade Analysis Industry Revenue (Million), by Import Market Analysis (Value & Volume) 2025 & 2033
- Figure 31: Asia Pacific Coffee Trade Analysis Industry Revenue Share (%), by Import Market Analysis (Value & Volume) 2025 & 2033
- Figure 32: Asia Pacific Coffee Trade Analysis Industry Revenue (Million), by Export Market Analysis (Value & Volume) 2025 & 2033
- Figure 33: Asia Pacific Coffee Trade Analysis Industry Revenue Share (%), by Export Market Analysis (Value & Volume) 2025 & 2033
- Figure 34: Asia Pacific Coffee Trade Analysis Industry Revenue (Million), by Price Trend Analysis 2025 & 2033
- Figure 35: Asia Pacific Coffee Trade Analysis Industry Revenue Share (%), by Price Trend Analysis 2025 & 2033
- Figure 36: Asia Pacific Coffee Trade Analysis Industry Revenue (Million), by Country 2025 & 2033
- Figure 37: Asia Pacific Coffee Trade Analysis Industry Revenue Share (%), by Country 2025 & 2033
- Figure 38: South America Coffee Trade Analysis Industry Revenue (Million), by Production Analysis 2025 & 2033
- Figure 39: South America Coffee Trade Analysis Industry Revenue Share (%), by Production Analysis 2025 & 2033
- Figure 40: South America Coffee Trade Analysis Industry Revenue (Million), by Consumption Analysis 2025 & 2033
- Figure 41: South America Coffee Trade Analysis Industry Revenue Share (%), by Consumption Analysis 2025 & 2033
- Figure 42: South America Coffee Trade Analysis Industry Revenue (Million), by Import Market Analysis (Value & Volume) 2025 & 2033
- Figure 43: South America Coffee Trade Analysis Industry Revenue Share (%), by Import Market Analysis (Value & Volume) 2025 & 2033
- Figure 44: South America Coffee Trade Analysis Industry Revenue (Million), by Export Market Analysis (Value & Volume) 2025 & 2033
- Figure 45: South America Coffee Trade Analysis Industry Revenue Share (%), by Export Market Analysis (Value & Volume) 2025 & 2033
- Figure 46: South America Coffee Trade Analysis Industry Revenue (Million), by Price Trend Analysis 2025 & 2033
- Figure 47: South America Coffee Trade Analysis Industry Revenue Share (%), by Price Trend Analysis 2025 & 2033
- Figure 48: South America Coffee Trade Analysis Industry Revenue (Million), by Country 2025 & 2033
- Figure 49: South America Coffee Trade Analysis Industry Revenue Share (%), by Country 2025 & 2033
- Figure 50: Africa Coffee Trade Analysis Industry Revenue (Million), by Production Analysis 2025 & 2033
- Figure 51: Africa Coffee Trade Analysis Industry Revenue Share (%), by Production Analysis 2025 & 2033
- Figure 52: Africa Coffee Trade Analysis Industry Revenue (Million), by Consumption Analysis 2025 & 2033
- Figure 53: Africa Coffee Trade Analysis Industry Revenue Share (%), by Consumption Analysis 2025 & 2033
- Figure 54: Africa Coffee Trade Analysis Industry Revenue (Million), by Import Market Analysis (Value & Volume) 2025 & 2033
- Figure 55: Africa Coffee Trade Analysis Industry Revenue Share (%), by Import Market Analysis (Value & Volume) 2025 & 2033
- Figure 56: Africa Coffee Trade Analysis Industry Revenue (Million), by Export Market Analysis (Value & Volume) 2025 & 2033
- Figure 57: Africa Coffee Trade Analysis Industry Revenue Share (%), by Export Market Analysis (Value & Volume) 2025 & 2033
- Figure 58: Africa Coffee Trade Analysis Industry Revenue (Million), by Price Trend Analysis 2025 & 2033
- Figure 59: Africa Coffee Trade Analysis Industry Revenue Share (%), by Price Trend Analysis 2025 & 2033
- Figure 60: Africa Coffee Trade Analysis Industry Revenue (Million), by Country 2025 & 2033
- Figure 61: Africa Coffee Trade Analysis Industry Revenue Share (%), by Country 2025 & 2033
List of Tables
- Table 1: Global Coffee Trade Analysis Industry Revenue Million Forecast, by Production Analysis 2020 & 2033
- Table 2: Global Coffee Trade Analysis Industry Revenue Million Forecast, by Consumption Analysis 2020 & 2033
- Table 3: Global Coffee Trade Analysis Industry Revenue Million Forecast, by Import Market Analysis (Value & Volume) 2020 & 2033
- Table 4: Global Coffee Trade Analysis Industry Revenue Million Forecast, by Export Market Analysis (Value & Volume) 2020 & 2033
- Table 5: Global Coffee Trade Analysis Industry Revenue Million Forecast, by Price Trend Analysis 2020 & 2033
- Table 6: Global Coffee Trade Analysis Industry Revenue Million Forecast, by Region 2020 & 2033
- Table 7: Global Coffee Trade Analysis Industry Revenue Million Forecast, by Production Analysis 2020 & 2033
- Table 8: Global Coffee Trade Analysis Industry Revenue Million Forecast, by Consumption Analysis 2020 & 2033
- Table 9: Global Coffee Trade Analysis Industry Revenue Million Forecast, by Import Market Analysis (Value & Volume) 2020 & 2033
- Table 10: Global Coffee Trade Analysis Industry Revenue Million Forecast, by Export Market Analysis (Value & Volume) 2020 & 2033
- Table 11: Global Coffee Trade Analysis Industry Revenue Million Forecast, by Price Trend Analysis 2020 & 2033
- Table 12: Global Coffee Trade Analysis Industry Revenue Million Forecast, by Country 2020 & 2033
- Table 13: United States Coffee Trade Analysis Industry Revenue (Million) Forecast, by Application 2020 & 2033
- Table 14: Canada Coffee Trade Analysis Industry Revenue (Million) Forecast, by Application 2020 & 2033
- Table 15: Mexico Coffee Trade Analysis Industry Revenue (Million) Forecast, by Application 2020 & 2033
- Table 16: Global Coffee Trade Analysis Industry Revenue Million Forecast, by Production Analysis 2020 & 2033
- Table 17: Global Coffee Trade Analysis Industry Revenue Million Forecast, by Consumption Analysis 2020 & 2033
- Table 18: Global Coffee Trade Analysis Industry Revenue Million Forecast, by Import Market Analysis (Value & Volume) 2020 & 2033
- Table 19: Global Coffee Trade Analysis Industry Revenue Million Forecast, by Export Market Analysis (Value & Volume) 2020 & 2033
- Table 20: Global Coffee Trade Analysis Industry Revenue Million Forecast, by Price Trend Analysis 2020 & 2033
- Table 21: Global Coffee Trade Analysis Industry Revenue Million Forecast, by Country 2020 & 2033
- Table 22: United Kingdom Coffee Trade Analysis Industry Revenue (Million) Forecast, by Application 2020 & 2033
- Table 23: Denmark Coffee Trade Analysis Industry Revenue (Million) Forecast, by Application 2020 & 2033
- Table 24: Netherlands Coffee Trade Analysis Industry Revenue (Million) Forecast, by Application 2020 & 2033
- Table 25: Germany Coffee Trade Analysis Industry Revenue (Million) Forecast, by Application 2020 & 2033
- Table 26: Norway Coffee Trade Analysis Industry Revenue (Million) Forecast, by Application 2020 & 2033
- Table 27: Sweden Coffee Trade Analysis Industry Revenue (Million) Forecast, by Application 2020 & 2033
- Table 28: Global Coffee Trade Analysis Industry Revenue Million Forecast, by Production Analysis 2020 & 2033
- Table 29: Global Coffee Trade Analysis Industry Revenue Million Forecast, by Consumption Analysis 2020 & 2033
- Table 30: Global Coffee Trade Analysis Industry Revenue Million Forecast, by Import Market Analysis (Value & Volume) 2020 & 2033
- Table 31: Global Coffee Trade Analysis Industry Revenue Million Forecast, by Export Market Analysis (Value & Volume) 2020 & 2033
- Table 32: Global Coffee Trade Analysis Industry Revenue Million Forecast, by Price Trend Analysis 2020 & 2033
- Table 33: Global Coffee Trade Analysis Industry Revenue Million Forecast, by Country 2020 & 2033
- Table 34: China Coffee Trade Analysis Industry Revenue (Million) Forecast, by Application 2020 & 2033
- Table 35: India Coffee Trade Analysis Industry Revenue (Million) Forecast, by Application 2020 & 2033
- Table 36: Japan Coffee Trade Analysis Industry Revenue (Million) Forecast, by Application 2020 & 2033
- Table 37: Indonesia Coffee Trade Analysis Industry Revenue (Million) Forecast, by Application 2020 & 2033
- Table 38: Philippines Coffee Trade Analysis Industry Revenue (Million) Forecast, by Application 2020 & 2033
- Table 39: Global Coffee Trade Analysis Industry Revenue Million Forecast, by Production Analysis 2020 & 2033
- Table 40: Global Coffee Trade Analysis Industry Revenue Million Forecast, by Consumption Analysis 2020 & 2033
- Table 41: Global Coffee Trade Analysis Industry Revenue Million Forecast, by Import Market Analysis (Value & Volume) 2020 & 2033
- Table 42: Global Coffee Trade Analysis Industry Revenue Million Forecast, by Export Market Analysis (Value & Volume) 2020 & 2033
- Table 43: Global Coffee Trade Analysis Industry Revenue Million Forecast, by Price Trend Analysis 2020 & 2033
- Table 44: Global Coffee Trade Analysis Industry Revenue Million Forecast, by Country 2020 & 2033
- Table 45: Brazil Coffee Trade Analysis Industry Revenue (Million) Forecast, by Application 2020 & 2033
- Table 46: Argentina Coffee Trade Analysis Industry Revenue (Million) Forecast, by Application 2020 & 2033
- Table 47: Global Coffee Trade Analysis Industry Revenue Million Forecast, by Production Analysis 2020 & 2033
- Table 48: Global Coffee Trade Analysis Industry Revenue Million Forecast, by Consumption Analysis 2020 & 2033
- Table 49: Global Coffee Trade Analysis Industry Revenue Million Forecast, by Import Market Analysis (Value & Volume) 2020 & 2033
- Table 50: Global Coffee Trade Analysis Industry Revenue Million Forecast, by Export Market Analysis (Value & Volume) 2020 & 2033
- Table 51: Global Coffee Trade Analysis Industry Revenue Million Forecast, by Price Trend Analysis 2020 & 2033
- Table 52: Global Coffee Trade Analysis Industry Revenue Million Forecast, by Country 2020 & 2033
- Table 53: South Africa Coffee Trade Analysis Industry Revenue (Million) Forecast, by Application 2020 & 2033
Frequently Asked Questions
1. What is the projected Compound Annual Growth Rate (CAGR) of the Coffee Trade Analysis Industry?
The projected CAGR is approximately 2.50%.
2. Which companies are prominent players in the Coffee Trade Analysis Industry?
Key companies in the market include JDE Peet's , Starbucks , Keurig Dr Pepper , Nestlé , Jacobs Douwe Egberts.
3. What are the main segments of the Coffee Trade Analysis Industry?
The market segments include Production Analysis, Consumption Analysis, Import Market Analysis (Value & Volume), Export Market Analysis (Value & Volume), Price Trend Analysis.
4. Can you provide details about the market size?
The market size is estimated to be USD XXX Million as of 2022.
5. What are some drivers contributing to market growth?
Rising Consumption of Cashew Nuts in the Country; Favorable Government Initiatives.
6. What are the notable trends driving market growth?
United States Dominates the Global Imports.
7. Are there any restraints impacting market growth?
Hazardous Climatic Condition Hinders Cashew Production; Stringent Regulations Related to Food Quality Standards.
8. Can you provide examples of recent developments in the market?
January 2023: Coffee exported from India was up by nearly 2% to 400,000 tons in 2022, with the rise in instant coffee exports and re-exports in the country. The export of instant coffee increased by 16.73% to 35,810 tons in 2022 from 29,819 tons in the previous year.
9. What pricing options are available for accessing the report?
Pricing options include single-user, multi-user, and enterprise licenses priced at USD 4750, USD 5250, and USD 8750 respectively.
10. Is the market size provided in terms of value or volume?
The market size is provided in terms of value, measured in Million.
11. Are there any specific market keywords associated with the report?
Yes, the market keyword associated with the report is "Coffee Trade Analysis Industry," which aids in identifying and referencing the specific market segment covered.
12. How do I determine which pricing option suits my needs best?
The pricing options vary based on user requirements and access needs. Individual users may opt for single-user licenses, while businesses requiring broader access may choose multi-user or enterprise licenses for cost-effective access to the report.
13. Are there any additional resources or data provided in the Coffee Trade Analysis Industry report?
While the report offers comprehensive insights, it's advisable to review the specific contents or supplementary materials provided to ascertain if additional resources or data are available.
14. How can I stay updated on further developments or reports in the Coffee Trade Analysis Industry?
To stay informed about further developments, trends, and reports in the Coffee Trade Analysis Industry, consider subscribing to industry newsletters, following relevant companies and organizations, or regularly checking reputable industry news sources and publications.
Methodology
Step 1 - Identification of Relevant Samples Size from Population Database


Step 2 - Approaches for Defining Global Market Size (Value, Volume* & Price*)

Note*: In applicable scenarios
Step 3 - Data Sources
Primary Research
- Web Analytics
- Survey Reports
- Research Institute
- Latest Research Reports
- Opinion Leaders
Secondary Research
- Annual Reports
- White Paper
- Latest Press Release
- Industry Association
- Paid Database
- Investor Presentations

Step 4 - Data Triangulation
Involves using different sources of information in order to increase the validity of a study
These sources are likely to be stakeholders in a program - participants, other researchers, program staff, other community members, and so on.
Then we put all data in single framework & apply various statistical tools to find out the dynamic on the market.
During the analysis stage, feedback from the stakeholder groups would be compared to determine areas of agreement as well as areas of divergence