

Key Insights
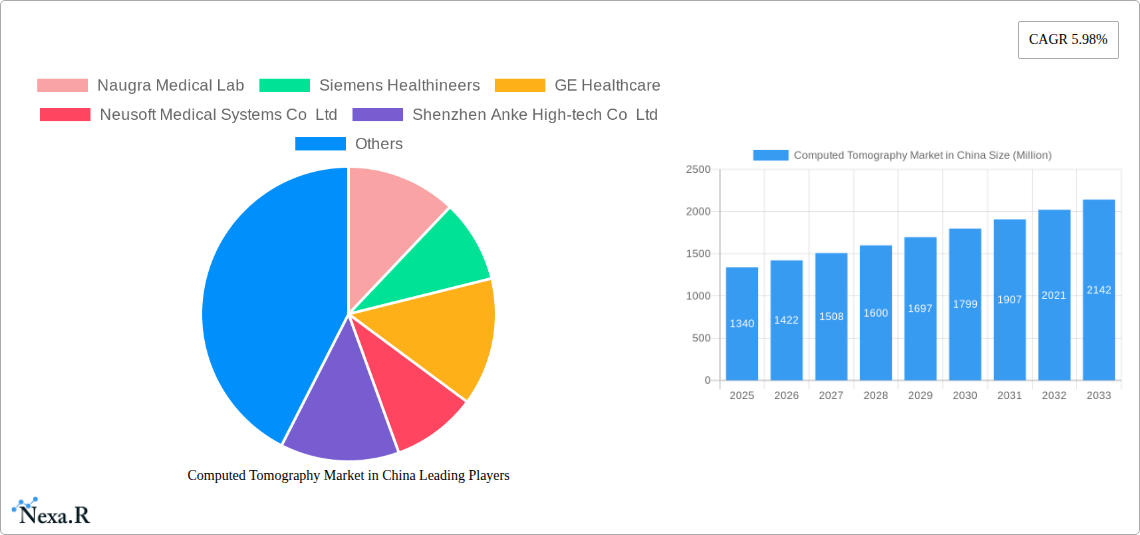
The China computed tomography (CT) market, valued at $1.34 billion in 2025, is projected to experience robust growth, driven by a rising prevalence of chronic diseases like cancer and cardiovascular ailments, increasing healthcare expenditure, and technological advancements leading to higher image quality and faster scan times. The market's Compound Annual Growth Rate (CAGR) of 5.98% from 2019 to 2024 suggests a continuously expanding market. This growth is further fueled by government initiatives promoting healthcare infrastructure development and the increasing adoption of advanced CT technologies in hospitals and diagnostic centers. The segmentation reveals a diverse market, with high-slice CT scanners commanding a significant share due to their superior imaging capabilities and suitability for complex procedures. Oncology, cardiology, and neurology applications constitute major market segments, reflecting the high prevalence of these diseases in China. While the market faces challenges such as high equipment costs and a need for skilled professionals, the overall trajectory indicates significant potential for growth throughout the forecast period (2025-2033). Key players like Siemens Healthineers, GE Healthcare, and Canon Medical Systems Corporation are actively competing in this dynamic market, leading to innovation and improved accessibility of advanced CT technology. The continuous advancements in AI-powered image analysis and minimally invasive procedures are expected to further boost the market in the coming years.
The competitive landscape is characterized by both international and domestic players. International companies benefit from established brand recognition and technological advancements, while domestic players leverage cost advantages and localized market understanding. Future growth will depend on factors such as technological innovation (e.g., multi-slice CT, advanced reconstruction algorithms), government policies, and the expansion of healthcare infrastructure in less-developed regions within China. The increasing focus on preventative healthcare and early diagnosis is also expected to contribute to the market's continued expansion. The medium-slice segment is anticipated to witness significant growth driven by its cost-effectiveness and suitability for a wider range of applications compared to high-slice systems.
Computed Tomography (CT) Market in China: A Comprehensive Report (2019-2033)
This comprehensive report provides an in-depth analysis of the Computed Tomography (CT) market in China, covering market dynamics, growth trends, regional segmentation, product landscape, key players, and future outlook. The report utilizes data from the historical period (2019-2024), base year (2025), and estimated year (2025) to forecast market trends up to 2033. The study period is 2019-2033 and the forecast period is 2025-2033. This report is essential for industry professionals, investors, and strategists seeking a clear understanding of this rapidly evolving market.
Computed Tomography Market in China: Market Dynamics & Structure
The Chinese CT market exhibits a complex interplay of factors shaping its structure and growth trajectory. Market concentration is moderate, with both domestic and multinational players vying for market share. Technological innovation, particularly in areas like multislice CT and AI-powered image analysis, is a key driver. However, regulatory hurdles and stringent approval processes present challenges. The market faces competition from alternative imaging modalities like MRI and ultrasound, although CT remains dominant due to its speed and cost-effectiveness for certain applications. End-user demographics show a growing demand from hospitals in urban and Tier-1 cities, while penetration in lower-tier cities remains an opportunity. M&A activity is moderate, with strategic alliances and partnerships emerging as a prevalent strategy for growth.
- Market Concentration: Moderate, with a mix of domestic and international players. Top 5 players hold approximately xx% market share in 2025.
- Technological Innovation: Driven by advancements in multislice technology, AI-powered image analysis, and improved radiation dose reduction techniques.
- Regulatory Framework: Stringent approval processes and safety regulations impact market entry and product adoption.
- Competitive Substitutes: MRI, ultrasound, and other imaging techniques compete for market share.
- End-User Demographics: Predominantly hospitals in urban areas, with growing demand from diagnostic centers and other end-users.
- M&A Trends: Moderate activity, with strategic partnerships and collaborations becoming increasingly important. An estimated xx M&A deals were concluded between 2019-2024.
Computed Tomography Market in China: Growth Trends & Insights
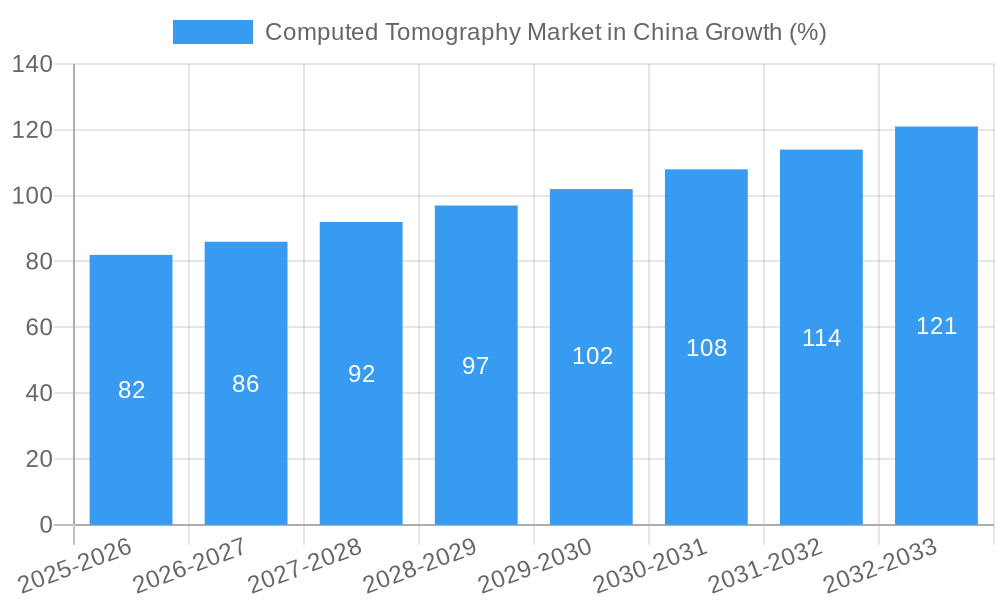
The Chinese CT market experienced substantial growth during the historical period (2019-2024), driven by factors such as increasing healthcare expenditure, rising prevalence of chronic diseases, and government initiatives promoting healthcare infrastructure development. This growth is projected to continue into the forecast period (2025-2033), albeit at a potentially moderating pace. The market size is expected to reach xx Million units by 2025 and xx Million units by 2033. Adoption rates, especially in rural areas and lower-tier cities, will play a crucial role in shaping future growth. Technological advancements, particularly in AI-assisted diagnostics and image processing, are disrupting traditional clinical workflows, improving diagnostic accuracy and efficiency. Consumer behavior shifts towards a preference for advanced imaging techniques are further fueling market expansion. The CAGR for the forecast period is estimated at xx%. Market penetration is expected to increase from xx% in 2025 to xx% by 2033.
Dominant Regions, Countries, or Segments in Computed Tomography Market in China
The CT market in China demonstrates regional disparities. Tier-1 cities (Beijing, Shanghai, Guangzhou, Shenzhen) and economically developed provinces such as Jiangsu and Zhejiang currently dominate the market due to higher healthcare infrastructure, increased disposable income, and higher prevalence of chronic diseases. However, significant growth potential exists in lower-tier cities where the government is actively investing in healthcare infrastructure. Hospitals constitute the largest end-user segment, followed by diagnostic centers. Within the product types, medium and high-slice CT scanners command a larger share due to their advanced capabilities and clinical advantages, while the demand for low-slice CT scanners is expected to remain stable. Oncology and cardiovascular applications are leading the application segment due to their high prevalence and need for precise diagnostics.
- Leading Region: Tier-1 cities and economically developed provinces.
- Key End-User Segment: Hospitals
- Leading Product Type: Medium and high-slice CT scanners
- Leading Application: Oncology and Cardiovascular
- Growth Drivers: Government healthcare initiatives, increasing healthcare expenditure, rising prevalence of chronic diseases, and expanding healthcare infrastructure in lower-tier cities.
Computed Tomography Market in China: Product Landscape
The CT scanner market showcases continuous innovation. Manufacturers are focusing on developing systems with improved image quality, reduced radiation dose, faster scan speeds, and enhanced workflow efficiency. The integration of AI and machine learning algorithms for image analysis is a prominent trend, along with the development of specialized CT scanners for specific applications like cardiac imaging and oncology. Unique selling propositions include advanced reconstruction techniques, improved patient comfort features, and advanced software packages for image interpretation.
Key Drivers, Barriers & Challenges in Computed Tomography Market in China
Key Drivers: Increasing prevalence of chronic diseases, rising healthcare expenditure, government initiatives to improve healthcare infrastructure, technological advancements in CT scanner technology, and growing demand for advanced diagnostic imaging solutions.
Key Barriers and Challenges: High cost of CT scanners, limited accessibility in rural areas and lower-tier cities, stringent regulatory approvals, intense competition from established players and alternative imaging modalities, and potential supply chain disruptions. The impact of these challenges could potentially slow market growth by xx% by 2030.
Emerging Opportunities in Computed Tomography Market in China
Untapped market potential exists in lower-tier cities and rural areas. Opportunities are emerging in developing specialized CT applications for early disease detection and personalized medicine. The growing adoption of telehealth and remote diagnostics also presents opportunities for CT manufacturers. Increased adoption of AI-powered image analysis tools can improve diagnostic accuracy and efficiency, opening new opportunities for collaboration between healthcare providers and technology companies.
Growth Accelerators in the Computed Tomography Market in China Industry
Technological advancements, particularly in AI-powered image analysis and advanced reconstruction techniques, are major growth catalysts. Strategic partnerships between multinational companies and domestic players facilitate market penetration and technology transfer. The government’s continued investment in healthcare infrastructure and initiatives promoting healthcare accessibility is crucial for long-term market expansion.
Key Players Shaping the Computed Tomography Market in China Market
- Naugra Medical Lab
- Siemens Healthineers
- GE Healthcare
- Neusoft Medical Systems Co Ltd
- Shenzhen Anke High-tech Co Ltd
- Koninklijke Philips NV
- Canon Medical Systems Corporation
- MinFound Medical Systems Co Ltd
- Planmed Oy
- Fujifilm Holdings Corporation
Notable Milestones in Computed Tomography Market in China Sector
- March 2023: Elekta launched a cooperative venture with China National Pharmaceutical Group Co., Ltd. (Sinopharm) to expand radiation therapy access in lower-tier cities, potentially boosting CT scanner demand for treatment planning.
- February 2022: Siemens Healthineers and Universal Medical Imaging partnered to promote 5G remote imaging diagnosis, enhancing the accessibility of CT services in remote areas.
In-Depth Computed Tomography Market in China Market Outlook
The Chinese CT market holds significant long-term growth potential, driven by continuous technological innovation, supportive government policies, and the increasing need for advanced diagnostic imaging solutions. Strategic partnerships, expansion into underserved regions, and the development of innovative applications will be key to unlocking this potential. The market is expected to witness a sustained growth trajectory, with continued investment in infrastructure and technological advancements paving the way for wider access and increased market penetration.
Computed Tomography Market in China Segmentation
-
1. Type
- 1.1. Low Slice
- 1.2. Medium Slice
- 1.3. High Slice
-
2. Application
- 2.1. Oncology
- 2.2. Neurology
- 2.3. Cardiovascular
- 2.4. Musculoskeletal
- 2.5. Other Applications
-
3. End User
- 3.1. Hospitals
- 3.2. Diagnostic Centers
- 3.3. Other End Users
Computed Tomography Market in China Segmentation By Geography
-
1. North America
- 1.1. United States
- 1.2. Canada
- 1.3. Mexico
-
2. South America
- 2.1. Brazil
- 2.2. Argentina
- 2.3. Rest of South America
-
3. Europe
- 3.1. United Kingdom
- 3.2. Germany
- 3.3. France
- 3.4. Italy
- 3.5. Spain
- 3.6. Russia
- 3.7. Benelux
- 3.8. Nordics
- 3.9. Rest of Europe
-
4. Middle East & Africa
- 4.1. Turkey
- 4.2. Israel
- 4.3. GCC
- 4.4. North Africa
- 4.5. South Africa
- 4.6. Rest of Middle East & Africa
-
5. Asia Pacific
- 5.1. China
- 5.2. India
- 5.3. Japan
- 5.4. South Korea
- 5.5. ASEAN
- 5.6. Oceania
- 5.7. Rest of Asia Pacific
Computed Tomography Market in China REPORT HIGHLIGHTS
| Aspects | Details |
|---|---|
| Study Period | 2019-2033 |
| Base Year | 2024 |
| Estimated Year | 2025 |
| Forecast Period | 2025-2033 |
| Historical Period | 2019-2024 |
| Growth Rate | CAGR of 5.98% from 2019-2033 |
| Segmentation |
|
Table of Contents
- 1. Introduction
- 1.1. Research Scope
- 1.2. Market Segmentation
- 1.3. Research Methodology
- 1.4. Definitions and Assumptions
- 2. Executive Summary
- 2.1. Introduction
- 3. Market Dynamics
- 3.1. Introduction
- 3.2. Market Drivers
- 3.2.1. Increasing Geriatric Population and Chronic Disease Burden; Technological Advancements in Computed Tomography
- 3.3. Market Restrains
- 3.3.1. High Cost Associated With CT Scan Procedure and Equipment
- 3.4. Market Trends
- 3.4.1. Diagnostic Centers to Hold Significant Share in End-User Segment Over the Forecast Period
- 4. Market Factor Analysis
- 4.1. Porters Five Forces
- 4.2. Supply/Value Chain
- 4.3. PESTEL analysis
- 4.4. Market Entropy
- 4.5. Patent/Trademark Analysis
- 5. Global Computed Tomography Market in China Analysis, Insights and Forecast, 2019-2031
- 5.1. Market Analysis, Insights and Forecast - by Type
- 5.1.1. Low Slice
- 5.1.2. Medium Slice
- 5.1.3. High Slice
- 5.2. Market Analysis, Insights and Forecast - by Application
- 5.2.1. Oncology
- 5.2.2. Neurology
- 5.2.3. Cardiovascular
- 5.2.4. Musculoskeletal
- 5.2.5. Other Applications
- 5.3. Market Analysis, Insights and Forecast - by End User
- 5.3.1. Hospitals
- 5.3.2. Diagnostic Centers
- 5.3.3. Other End Users
- 5.4. Market Analysis, Insights and Forecast - by Region
- 5.4.1. North America
- 5.4.2. South America
- 5.4.3. Europe
- 5.4.4. Middle East & Africa
- 5.4.5. Asia Pacific
- 5.1. Market Analysis, Insights and Forecast - by Type
- 6. North America Computed Tomography Market in China Analysis, Insights and Forecast, 2019-2031
- 6.1. Market Analysis, Insights and Forecast - by Type
- 6.1.1. Low Slice
- 6.1.2. Medium Slice
- 6.1.3. High Slice
- 6.2. Market Analysis, Insights and Forecast - by Application
- 6.2.1. Oncology
- 6.2.2. Neurology
- 6.2.3. Cardiovascular
- 6.2.4. Musculoskeletal
- 6.2.5. Other Applications
- 6.3. Market Analysis, Insights and Forecast - by End User
- 6.3.1. Hospitals
- 6.3.2. Diagnostic Centers
- 6.3.3. Other End Users
- 6.1. Market Analysis, Insights and Forecast - by Type
- 7. South America Computed Tomography Market in China Analysis, Insights and Forecast, 2019-2031
- 7.1. Market Analysis, Insights and Forecast - by Type
- 7.1.1. Low Slice
- 7.1.2. Medium Slice
- 7.1.3. High Slice
- 7.2. Market Analysis, Insights and Forecast - by Application
- 7.2.1. Oncology
- 7.2.2. Neurology
- 7.2.3. Cardiovascular
- 7.2.4. Musculoskeletal
- 7.2.5. Other Applications
- 7.3. Market Analysis, Insights and Forecast - by End User
- 7.3.1. Hospitals
- 7.3.2. Diagnostic Centers
- 7.3.3. Other End Users
- 7.1. Market Analysis, Insights and Forecast - by Type
- 8. Europe Computed Tomography Market in China Analysis, Insights and Forecast, 2019-2031
- 8.1. Market Analysis, Insights and Forecast - by Type
- 8.1.1. Low Slice
- 8.1.2. Medium Slice
- 8.1.3. High Slice
- 8.2. Market Analysis, Insights and Forecast - by Application
- 8.2.1. Oncology
- 8.2.2. Neurology
- 8.2.3. Cardiovascular
- 8.2.4. Musculoskeletal
- 8.2.5. Other Applications
- 8.3. Market Analysis, Insights and Forecast - by End User
- 8.3.1. Hospitals
- 8.3.2. Diagnostic Centers
- 8.3.3. Other End Users
- 8.1. Market Analysis, Insights and Forecast - by Type
- 9. Middle East & Africa Computed Tomography Market in China Analysis, Insights and Forecast, 2019-2031
- 9.1. Market Analysis, Insights and Forecast - by Type
- 9.1.1. Low Slice
- 9.1.2. Medium Slice
- 9.1.3. High Slice
- 9.2. Market Analysis, Insights and Forecast - by Application
- 9.2.1. Oncology
- 9.2.2. Neurology
- 9.2.3. Cardiovascular
- 9.2.4. Musculoskeletal
- 9.2.5. Other Applications
- 9.3. Market Analysis, Insights and Forecast - by End User
- 9.3.1. Hospitals
- 9.3.2. Diagnostic Centers
- 9.3.3. Other End Users
- 9.1. Market Analysis, Insights and Forecast - by Type
- 10. Asia Pacific Computed Tomography Market in China Analysis, Insights and Forecast, 2019-2031
- 10.1. Market Analysis, Insights and Forecast - by Type
- 10.1.1. Low Slice
- 10.1.2. Medium Slice
- 10.1.3. High Slice
- 10.2. Market Analysis, Insights and Forecast - by Application
- 10.2.1. Oncology
- 10.2.2. Neurology
- 10.2.3. Cardiovascular
- 10.2.4. Musculoskeletal
- 10.2.5. Other Applications
- 10.3. Market Analysis, Insights and Forecast - by End User
- 10.3.1. Hospitals
- 10.3.2. Diagnostic Centers
- 10.3.3. Other End Users
- 10.1. Market Analysis, Insights and Forecast - by Type
- 11. Competitive Analysis
- 11.1. Global Market Share Analysis 2024
- 11.2. Company Profiles
- 11.2.1 Naugra Medical Lab
- 11.2.1.1. Overview
- 11.2.1.2. Products
- 11.2.1.3. SWOT Analysis
- 11.2.1.4. Recent Developments
- 11.2.1.5. Financials (Based on Availability)
- 11.2.2 Siemens Healthineers
- 11.2.2.1. Overview
- 11.2.2.2. Products
- 11.2.2.3. SWOT Analysis
- 11.2.2.4. Recent Developments
- 11.2.2.5. Financials (Based on Availability)
- 11.2.3 GE Healthcare
- 11.2.3.1. Overview
- 11.2.3.2. Products
- 11.2.3.3. SWOT Analysis
- 11.2.3.4. Recent Developments
- 11.2.3.5. Financials (Based on Availability)
- 11.2.4 Neusoft Medical Systems Co Ltd
- 11.2.4.1. Overview
- 11.2.4.2. Products
- 11.2.4.3. SWOT Analysis
- 11.2.4.4. Recent Developments
- 11.2.4.5. Financials (Based on Availability)
- 11.2.5 Shenzhen Anke High-tech Co Ltd
- 11.2.5.1. Overview
- 11.2.5.2. Products
- 11.2.5.3. SWOT Analysis
- 11.2.5.4. Recent Developments
- 11.2.5.5. Financials (Based on Availability)
- 11.2.6 Koninklijke Philips NV
- 11.2.6.1. Overview
- 11.2.6.2. Products
- 11.2.6.3. SWOT Analysis
- 11.2.6.4. Recent Developments
- 11.2.6.5. Financials (Based on Availability)
- 11.2.7 Canon Medical Systems Corporation
- 11.2.7.1. Overview
- 11.2.7.2. Products
- 11.2.7.3. SWOT Analysis
- 11.2.7.4. Recent Developments
- 11.2.7.5. Financials (Based on Availability)
- 11.2.8 MinFound Medical Systems Co Ltd
- 11.2.8.1. Overview
- 11.2.8.2. Products
- 11.2.8.3. SWOT Analysis
- 11.2.8.4. Recent Developments
- 11.2.8.5. Financials (Based on Availability)
- 11.2.9 Planmed Oy
- 11.2.9.1. Overview
- 11.2.9.2. Products
- 11.2.9.3. SWOT Analysis
- 11.2.9.4. Recent Developments
- 11.2.9.5. Financials (Based on Availability)
- 11.2.10 Fujifilm Holdings Corporation
- 11.2.10.1. Overview
- 11.2.10.2. Products
- 11.2.10.3. SWOT Analysis
- 11.2.10.4. Recent Developments
- 11.2.10.5. Financials (Based on Availability)
- 11.2.1 Naugra Medical Lab
List of Figures
- Figure 1: Global Computed Tomography Market in China Revenue Breakdown (Million, %) by Region 2024 & 2032
- Figure 2: China Computed Tomography Market in China Revenue (Million), by Country 2024 & 2032
- Figure 3: China Computed Tomography Market in China Revenue Share (%), by Country 2024 & 2032
- Figure 4: North America Computed Tomography Market in China Revenue (Million), by Type 2024 & 2032
- Figure 5: North America Computed Tomography Market in China Revenue Share (%), by Type 2024 & 2032
- Figure 6: North America Computed Tomography Market in China Revenue (Million), by Application 2024 & 2032
- Figure 7: North America Computed Tomography Market in China Revenue Share (%), by Application 2024 & 2032
- Figure 8: North America Computed Tomography Market in China Revenue (Million), by End User 2024 & 2032
- Figure 9: North America Computed Tomography Market in China Revenue Share (%), by End User 2024 & 2032
- Figure 10: North America Computed Tomography Market in China Revenue (Million), by Country 2024 & 2032
- Figure 11: North America Computed Tomography Market in China Revenue Share (%), by Country 2024 & 2032
- Figure 12: South America Computed Tomography Market in China Revenue (Million), by Type 2024 & 2032
- Figure 13: South America Computed Tomography Market in China Revenue Share (%), by Type 2024 & 2032
- Figure 14: South America Computed Tomography Market in China Revenue (Million), by Application 2024 & 2032
- Figure 15: South America Computed Tomography Market in China Revenue Share (%), by Application 2024 & 2032
- Figure 16: South America Computed Tomography Market in China Revenue (Million), by End User 2024 & 2032
- Figure 17: South America Computed Tomography Market in China Revenue Share (%), by End User 2024 & 2032
- Figure 18: South America Computed Tomography Market in China Revenue (Million), by Country 2024 & 2032
- Figure 19: South America Computed Tomography Market in China Revenue Share (%), by Country 2024 & 2032
- Figure 20: Europe Computed Tomography Market in China Revenue (Million), by Type 2024 & 2032
- Figure 21: Europe Computed Tomography Market in China Revenue Share (%), by Type 2024 & 2032
- Figure 22: Europe Computed Tomography Market in China Revenue (Million), by Application 2024 & 2032
- Figure 23: Europe Computed Tomography Market in China Revenue Share (%), by Application 2024 & 2032
- Figure 24: Europe Computed Tomography Market in China Revenue (Million), by End User 2024 & 2032
- Figure 25: Europe Computed Tomography Market in China Revenue Share (%), by End User 2024 & 2032
- Figure 26: Europe Computed Tomography Market in China Revenue (Million), by Country 2024 & 2032
- Figure 27: Europe Computed Tomography Market in China Revenue Share (%), by Country 2024 & 2032
- Figure 28: Middle East & Africa Computed Tomography Market in China Revenue (Million), by Type 2024 & 2032
- Figure 29: Middle East & Africa Computed Tomography Market in China Revenue Share (%), by Type 2024 & 2032
- Figure 30: Middle East & Africa Computed Tomography Market in China Revenue (Million), by Application 2024 & 2032
- Figure 31: Middle East & Africa Computed Tomography Market in China Revenue Share (%), by Application 2024 & 2032
- Figure 32: Middle East & Africa Computed Tomography Market in China Revenue (Million), by End User 2024 & 2032
- Figure 33: Middle East & Africa Computed Tomography Market in China Revenue Share (%), by End User 2024 & 2032
- Figure 34: Middle East & Africa Computed Tomography Market in China Revenue (Million), by Country 2024 & 2032
- Figure 35: Middle East & Africa Computed Tomography Market in China Revenue Share (%), by Country 2024 & 2032
- Figure 36: Asia Pacific Computed Tomography Market in China Revenue (Million), by Type 2024 & 2032
- Figure 37: Asia Pacific Computed Tomography Market in China Revenue Share (%), by Type 2024 & 2032
- Figure 38: Asia Pacific Computed Tomography Market in China Revenue (Million), by Application 2024 & 2032
- Figure 39: Asia Pacific Computed Tomography Market in China Revenue Share (%), by Application 2024 & 2032
- Figure 40: Asia Pacific Computed Tomography Market in China Revenue (Million), by End User 2024 & 2032
- Figure 41: Asia Pacific Computed Tomography Market in China Revenue Share (%), by End User 2024 & 2032
- Figure 42: Asia Pacific Computed Tomography Market in China Revenue (Million), by Country 2024 & 2032
- Figure 43: Asia Pacific Computed Tomography Market in China Revenue Share (%), by Country 2024 & 2032
List of Tables
- Table 1: Global Computed Tomography Market in China Revenue Million Forecast, by Region 2019 & 2032
- Table 2: Global Computed Tomography Market in China Revenue Million Forecast, by Type 2019 & 2032
- Table 3: Global Computed Tomography Market in China Revenue Million Forecast, by Application 2019 & 2032
- Table 4: Global Computed Tomography Market in China Revenue Million Forecast, by End User 2019 & 2032
- Table 5: Global Computed Tomography Market in China Revenue Million Forecast, by Region 2019 & 2032
- Table 6: Global Computed Tomography Market in China Revenue Million Forecast, by Country 2019 & 2032
- Table 7: Global Computed Tomography Market in China Revenue Million Forecast, by Type 2019 & 2032
- Table 8: Global Computed Tomography Market in China Revenue Million Forecast, by Application 2019 & 2032
- Table 9: Global Computed Tomography Market in China Revenue Million Forecast, by End User 2019 & 2032
- Table 10: Global Computed Tomography Market in China Revenue Million Forecast, by Country 2019 & 2032
- Table 11: United States Computed Tomography Market in China Revenue (Million) Forecast, by Application 2019 & 2032
- Table 12: Canada Computed Tomography Market in China Revenue (Million) Forecast, by Application 2019 & 2032
- Table 13: Mexico Computed Tomography Market in China Revenue (Million) Forecast, by Application 2019 & 2032
- Table 14: Global Computed Tomography Market in China Revenue Million Forecast, by Type 2019 & 2032
- Table 15: Global Computed Tomography Market in China Revenue Million Forecast, by Application 2019 & 2032
- Table 16: Global Computed Tomography Market in China Revenue Million Forecast, by End User 2019 & 2032
- Table 17: Global Computed Tomography Market in China Revenue Million Forecast, by Country 2019 & 2032
- Table 18: Brazil Computed Tomography Market in China Revenue (Million) Forecast, by Application 2019 & 2032
- Table 19: Argentina Computed Tomography Market in China Revenue (Million) Forecast, by Application 2019 & 2032
- Table 20: Rest of South America Computed Tomography Market in China Revenue (Million) Forecast, by Application 2019 & 2032
- Table 21: Global Computed Tomography Market in China Revenue Million Forecast, by Type 2019 & 2032
- Table 22: Global Computed Tomography Market in China Revenue Million Forecast, by Application 2019 & 2032
- Table 23: Global Computed Tomography Market in China Revenue Million Forecast, by End User 2019 & 2032
- Table 24: Global Computed Tomography Market in China Revenue Million Forecast, by Country 2019 & 2032
- Table 25: United Kingdom Computed Tomography Market in China Revenue (Million) Forecast, by Application 2019 & 2032
- Table 26: Germany Computed Tomography Market in China Revenue (Million) Forecast, by Application 2019 & 2032
- Table 27: France Computed Tomography Market in China Revenue (Million) Forecast, by Application 2019 & 2032
- Table 28: Italy Computed Tomography Market in China Revenue (Million) Forecast, by Application 2019 & 2032
- Table 29: Spain Computed Tomography Market in China Revenue (Million) Forecast, by Application 2019 & 2032
- Table 30: Russia Computed Tomography Market in China Revenue (Million) Forecast, by Application 2019 & 2032
- Table 31: Benelux Computed Tomography Market in China Revenue (Million) Forecast, by Application 2019 & 2032
- Table 32: Nordics Computed Tomography Market in China Revenue (Million) Forecast, by Application 2019 & 2032
- Table 33: Rest of Europe Computed Tomography Market in China Revenue (Million) Forecast, by Application 2019 & 2032
- Table 34: Global Computed Tomography Market in China Revenue Million Forecast, by Type 2019 & 2032
- Table 35: Global Computed Tomography Market in China Revenue Million Forecast, by Application 2019 & 2032
- Table 36: Global Computed Tomography Market in China Revenue Million Forecast, by End User 2019 & 2032
- Table 37: Global Computed Tomography Market in China Revenue Million Forecast, by Country 2019 & 2032
- Table 38: Turkey Computed Tomography Market in China Revenue (Million) Forecast, by Application 2019 & 2032
- Table 39: Israel Computed Tomography Market in China Revenue (Million) Forecast, by Application 2019 & 2032
- Table 40: GCC Computed Tomography Market in China Revenue (Million) Forecast, by Application 2019 & 2032
- Table 41: North Africa Computed Tomography Market in China Revenue (Million) Forecast, by Application 2019 & 2032
- Table 42: South Africa Computed Tomography Market in China Revenue (Million) Forecast, by Application 2019 & 2032
- Table 43: Rest of Middle East & Africa Computed Tomography Market in China Revenue (Million) Forecast, by Application 2019 & 2032
- Table 44: Global Computed Tomography Market in China Revenue Million Forecast, by Type 2019 & 2032
- Table 45: Global Computed Tomography Market in China Revenue Million Forecast, by Application 2019 & 2032
- Table 46: Global Computed Tomography Market in China Revenue Million Forecast, by End User 2019 & 2032
- Table 47: Global Computed Tomography Market in China Revenue Million Forecast, by Country 2019 & 2032
- Table 48: China Computed Tomography Market in China Revenue (Million) Forecast, by Application 2019 & 2032
- Table 49: India Computed Tomography Market in China Revenue (Million) Forecast, by Application 2019 & 2032
- Table 50: Japan Computed Tomography Market in China Revenue (Million) Forecast, by Application 2019 & 2032
- Table 51: South Korea Computed Tomography Market in China Revenue (Million) Forecast, by Application 2019 & 2032
- Table 52: ASEAN Computed Tomography Market in China Revenue (Million) Forecast, by Application 2019 & 2032
- Table 53: Oceania Computed Tomography Market in China Revenue (Million) Forecast, by Application 2019 & 2032
- Table 54: Rest of Asia Pacific Computed Tomography Market in China Revenue (Million) Forecast, by Application 2019 & 2032
Frequently Asked Questions
1. What is the projected Compound Annual Growth Rate (CAGR) of the Computed Tomography Market in China?
The projected CAGR is approximately 5.98%.
2. Which companies are prominent players in the Computed Tomography Market in China?
Key companies in the market include Naugra Medical Lab, Siemens Healthineers, GE Healthcare, Neusoft Medical Systems Co Ltd, Shenzhen Anke High-tech Co Ltd, Koninklijke Philips NV, Canon Medical Systems Corporation, MinFound Medical Systems Co Ltd, Planmed Oy, Fujifilm Holdings Corporation.
3. What are the main segments of the Computed Tomography Market in China?
The market segments include Type, Application, End User.
4. Can you provide details about the market size?
The market size is estimated to be USD 1.34 Million as of 2022.
5. What are some drivers contributing to market growth?
Increasing Geriatric Population and Chronic Disease Burden; Technological Advancements in Computed Tomography.
6. What are the notable trends driving market growth?
Diagnostic Centers to Hold Significant Share in End-User Segment Over the Forecast Period.
7. Are there any restraints impacting market growth?
High Cost Associated With CT Scan Procedure and Equipment.
8. Can you provide examples of recent developments in the market?
March 2023: Elekta launched a cooperative venture with China National Pharmaceutical Group Co., Ltd. (Sinopharm) to expand the use of radiation therapy in so-called lower-tier cities, where around 70% of the population lives.
9. What pricing options are available for accessing the report?
Pricing options include single-user, multi-user, and enterprise licenses priced at USD 3800, USD 4500, and USD 5800 respectively.
10. Is the market size provided in terms of value or volume?
The market size is provided in terms of value, measured in Million.
11. Are there any specific market keywords associated with the report?
Yes, the market keyword associated with the report is "Computed Tomography Market in China," which aids in identifying and referencing the specific market segment covered.
12. How do I determine which pricing option suits my needs best?
The pricing options vary based on user requirements and access needs. Individual users may opt for single-user licenses, while businesses requiring broader access may choose multi-user or enterprise licenses for cost-effective access to the report.
13. Are there any additional resources or data provided in the Computed Tomography Market in China report?
While the report offers comprehensive insights, it's advisable to review the specific contents or supplementary materials provided to ascertain if additional resources or data are available.
14. How can I stay updated on further developments or reports in the Computed Tomography Market in China?
To stay informed about further developments, trends, and reports in the Computed Tomography Market in China, consider subscribing to industry newsletters, following relevant companies and organizations, or regularly checking reputable industry news sources and publications.
Methodology
Step 1 - Identification of Relevant Samples Size from Population Database


Step 2 - Approaches for Defining Global Market Size (Value, Volume* & Price*)

Note*: In applicable scenarios
Step 3 - Data Sources
Primary Research
- Web Analytics
- Survey Reports
- Research Institute
- Latest Research Reports
- Opinion Leaders
Secondary Research
- Annual Reports
- White Paper
- Latest Press Release
- Industry Association
- Paid Database
- Investor Presentations

Step 4 - Data Triangulation
Involves using different sources of information in order to increase the validity of a study
These sources are likely to be stakeholders in a program - participants, other researchers, program staff, other community members, and so on.
Then we put all data in single framework & apply various statistical tools to find out the dynamic on the market.
During the analysis stage, feedback from the stakeholder groups would be compared to determine areas of agreement as well as areas of divergence
