

Key Insights
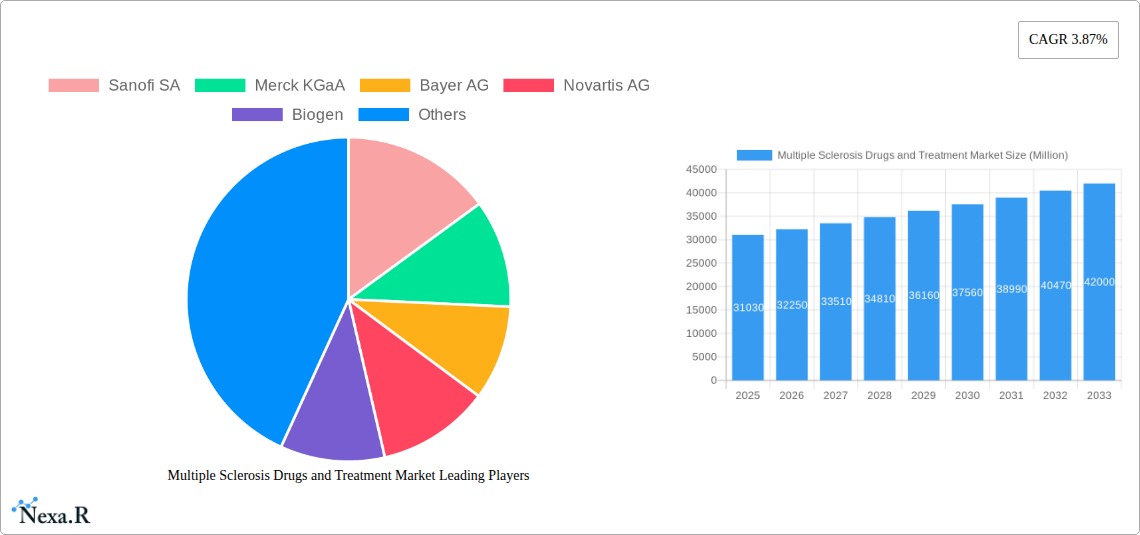
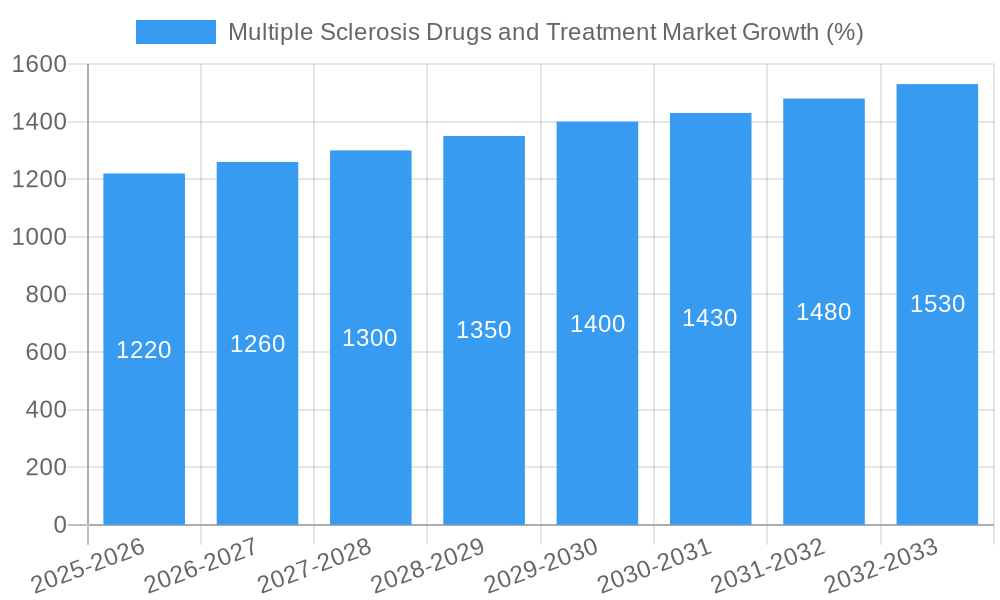
The Multiple Sclerosis (MS) Drugs and Treatment Market, valued at $31.03 billion in 2025, is projected to experience robust growth, driven by a rising prevalence of MS globally, particularly in North America and Europe. The market's Compound Annual Growth Rate (CAGR) of 3.87% from 2025 to 2033 indicates a steady expansion, fueled by continuous advancements in disease-modifying therapies (DMTs). These advancements include the development of novel oral medications offering improved convenience and efficacy compared to traditional injectable treatments. The market segmentation reveals a significant contribution from both large-molecule drugs (like monoclonal antibodies) and small-molecule drugs, each catering to specific patient needs and disease stages. Injectable routes of administration currently dominate, but the increasing adoption of oral DMTs is expected to reshape this segment in the coming years. Key players such as Sanofi, Merck KGaA, Novartis, and Biogen are heavily invested in R&D, leading to a competitive landscape characterized by ongoing innovation and the introduction of new therapies. However, high treatment costs and potential side effects associated with certain drugs pose challenges to market growth. Furthermore, the development of biosimilars could impact the pricing dynamics of established treatments in the future.
Despite these challenges, the market's future appears bright. Growing awareness of MS, improved diagnostic capabilities, and expanding access to healthcare in developing economies are expected to further propel market growth. The focus on personalized medicine, aiming to tailor treatments to individual patient characteristics, is also a significant emerging trend. Companies are actively pursuing research in areas like disease progression monitoring and novel treatment modalities such as cell therapies and gene editing to address unmet needs and potentially transform MS management in the long term. This continued focus on innovation, coupled with an increasing understanding of the disease's pathophysiology, is poised to drive substantial growth in the MS drugs and treatment market in the forecast period (2025-2033).
Multiple Sclerosis (MS) Drugs and Treatment Market: A Comprehensive Report (2019-2033)
This in-depth report provides a comprehensive analysis of the Multiple Sclerosis (MS) Drugs and Treatment Market, encompassing market dynamics, growth trends, regional segmentation, product landscape, key players, and future outlook. The report covers the period from 2019 to 2033, with 2025 as the base year and forecast period from 2025 to 2033. This analysis is crucial for pharmaceutical companies, investors, and healthcare professionals seeking a clear understanding of this vital therapeutic area. The parent market is the Neurology Therapeutics market, and the child market is the MS treatment segment. The total market value is projected to reach xx Million by 2033.
Multiple Sclerosis Drugs and Treatment Market Dynamics & Structure
The MS Drugs and Treatment Market is characterized by a moderately concentrated landscape with key players holding significant market share. Technological innovation, particularly in disease-modifying therapies (DMTs), is a primary driver, alongside regulatory approvals shaping market access. Competitive pressures stem from both established players and emerging biotech companies developing novel treatments. The market exhibits diverse end-user demographics, encompassing patients with varying MS subtypes and disease severities. M&A activity within the pharmaceutical sector is anticipated to continue shaping market dynamics, consolidating R&D efforts and expanding product portfolios. The historical period (2019-2024) showed a CAGR of xx%, and the market is expected to maintain a healthy growth rate throughout the forecast period.
- Market Concentration: The top 5 players hold approximately xx% of the market share.
- Technological Innovation: Focus on novel DMTs, biosimilars, and personalized medicine.
- Regulatory Framework: Stringent approval processes impact market entry and pricing.
- Competitive Substitutes: Existing therapies and emerging treatments create competitive pressure.
- End-User Demographics: Varying disease severity and MS subtypes drive diverse treatment needs.
- M&A Trends: xx major M&A deals were observed in the historical period, indicating consolidation.
Multiple Sclerosis Drugs and Treatment Market Growth Trends & Insights
The MS Drugs and Treatment Market has experienced significant growth driven by factors such as increasing prevalence of MS, technological advancements leading to more effective treatments, and rising healthcare expenditure. The market size expanded from xx Million in 2019 to xx Million in 2024. Adoption rates of novel therapies are influenced by their efficacy, safety profiles, and reimbursement policies. Technological disruptions, including the development of biosimilars and personalized medicine approaches, are reshaping the market landscape. Changing consumer behavior, with patients demanding more convenient treatment options, is also impacting market dynamics. The projected Compound Annual Growth Rate (CAGR) for the forecast period (2025-2033) is estimated at xx%. Market penetration of new therapies varies depending on the specific drug and its clinical profile.
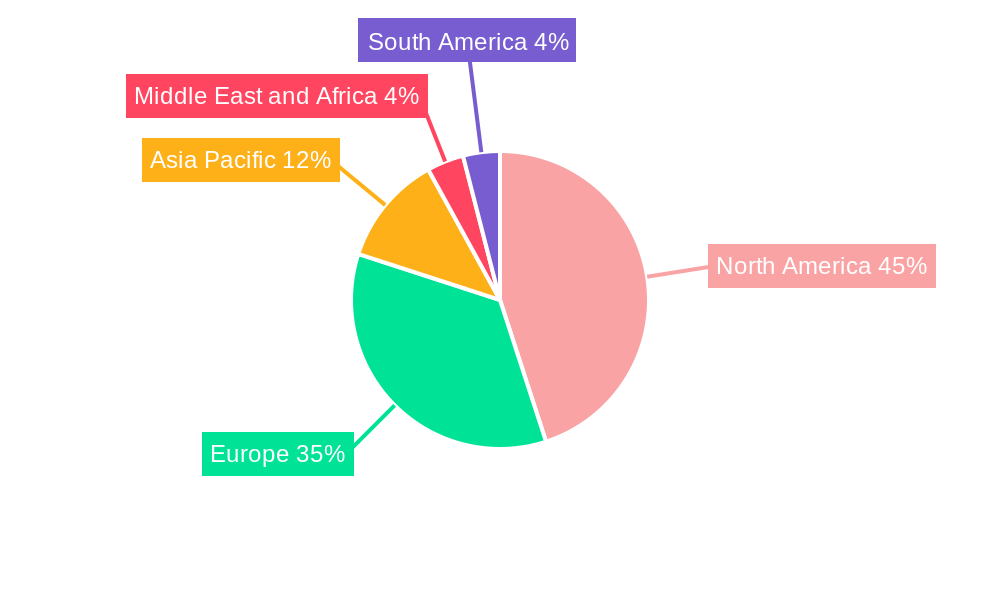
Dominant Regions, Countries, or Segments in Multiple Sclerosis Drugs and Treatment Market
North America currently holds the largest market share, driven by high MS prevalence, robust healthcare infrastructure, and increased research and development activities. Europe follows as a significant market, while other regions show considerable growth potential.
By Drug Type:
- Large-molecule Drugs: This segment holds a larger market share due to the established efficacy of biologics in MS treatment. Growth is driven by the continued success of existing drugs and the development of biosimilars.
- Small-molecule Drugs: This segment is experiencing growth, driven by the convenience of oral administration and the emergence of new treatment options.
By Route of Administration:
- Injectable: Injectable drugs currently dominate the market due to their proven efficacy. However, oral medications are gaining traction, driven by improved patient convenience.
- Oral: Oral formulations are gaining popularity due to improved patient compliance and convenience, leading to increased market share.
Multiple Sclerosis Drugs and Treatment Market Product Landscape
The MS drug market encompasses a range of disease-modifying therapies (DMTs), including interferons, glatiramer acetate, natalizumab, fingolimod, and numerous other newer agents. These drugs offer varying mechanisms of action and efficacy profiles, catering to diverse patient needs. Recent innovations focus on improving efficacy, reducing side effects, and developing more convenient administration routes, such as oral formulations. Biosimilars are emerging as cost-effective alternatives to established biologics. The focus is on personalized medicine approaches aimed at tailoring treatments to individual patient profiles.
Key Drivers, Barriers & Challenges in Multiple Sclerosis Drugs and Treatment Market
Key Drivers:
- Increasing prevalence of MS globally.
- Ongoing research and development of novel therapies.
- Rising healthcare expenditure and improved healthcare access.
Challenges and Restraints:
- High cost of treatment, creating access barriers for many patients.
- Stringent regulatory pathways and lengthy approval processes for new drugs.
- Competition among established and emerging pharmaceutical companies.
- Potential side effects associated with some MS treatments, impacting patient compliance.
Emerging Opportunities in Multiple Sclerosis Drugs and Treatment Market
- Untapped markets in developing countries with rising MS prevalence.
- Development of personalized medicine approaches to tailor treatments.
- Growing demand for convenient and effective oral therapies.
- Exploration of novel therapeutic targets and mechanisms of action.
Growth Accelerators in the Multiple Sclerosis Drugs and Treatment Market Industry
The market is poised for further growth driven by continuous innovation in drug development, including personalized medicine and biosimilars. Strategic partnerships and collaborations among pharmaceutical companies are accelerating the development and commercialization of new treatments. Expansion into emerging markets with unmet needs will also contribute to market growth.
Key Players Shaping the Multiple Sclerosis Drugs and Treatment Market Market
- Sanofi SA
- Merck KGaA
- Bayer AG
- Novartis AG
- Biogen
- Johnson & Johnson
- Teva Pharmaceuticals Industries Ltd
- F Hoffmann-La Roche AG
- Acorda Therapeutics Inc
- Viatris Inc (Mylan NV)
- Bristol-Myers Squibb Company
Notable Milestones in Multiple Sclerosis Drugs and Treatment Market Sector
- October 2023: Bristol Myers Squibb presented positive long-term data for Zeposia (ozanimod) in relapsing MS, showing 76% of patients were free of six-month confirmed disability progression (CDP).
- September 2023: Sandoz received European Commission (EC) and US FDA approval for its biosimilar Tyruko (natalizumab) for multiple sclerosis.
In-Depth Multiple Sclerosis Drugs and Treatment Market Market Outlook
The future of the MS Drugs and Treatment Market is bright, with ongoing research and development paving the way for more effective and convenient treatments. The market is expected to witness sustained growth, driven by an aging population, increased disease awareness, and the emergence of innovative therapies. Strategic alliances and acquisitions are anticipated to continue shaping the market landscape, leading to a more consolidated but competitive environment. The focus on personalized medicine and biosimilars presents significant opportunities for growth and market expansion.
Multiple Sclerosis Drugs and Treatment Market Segmentation
-
1. Drug Type
- 1.1. Large-molecule Drugs
- 1.2. Small-molecule Drugs
-
2. Route of Administration
- 2.1. Oral
- 2.2. Injectable and Other Routes of Administration
Multiple Sclerosis Drugs and Treatment Market Segmentation By Geography
-
1. North America
- 1.1. United States
- 1.2. Canada
- 1.3. Mexico
-
2. Europe
- 2.1. Germany
- 2.2. United Kingdom
- 2.3. France
- 2.4. Italy
- 2.5. Spain
- 2.6. Rest of Europe
-
3. Asia Pacific
- 3.1. China
- 3.2. Japan
- 3.3. India
- 3.4. Australia
- 3.5. South Korea
- 3.6. Rest of Asia Pacific
-
4. Middle East and Africa
- 4.1. GCC
- 4.2. South Africa
- 4.3. Rest of Middle East and Africa
-
5. South America
- 5.1. Brazil
- 5.2. Argentina
- 5.3. Rest of South America
Multiple Sclerosis Drugs and Treatment Market REPORT HIGHLIGHTS
| Aspects | Details |
|---|---|
| Study Period | 2019-2033 |
| Base Year | 2024 |
| Estimated Year | 2025 |
| Forecast Period | 2025-2033 |
| Historical Period | 2019-2024 |
| Growth Rate | CAGR of 3.87% from 2019-2033 |
| Segmentation |
|
Table of Contents
- 1. Introduction
- 1.1. Research Scope
- 1.2. Market Segmentation
- 1.3. Research Methodology
- 1.4. Definitions and Assumptions
- 2. Executive Summary
- 2.1. Introduction
- 3. Market Dynamics
- 3.1. Introduction
- 3.2. Market Drivers
- 3.2.1. Rising Cases of Multiple Sclerosis across the World; Growing Focus of Companies on Pipeline Products for MS
- 3.3. Market Restrains
- 3.3.1. Side Effects Associated with the Medication; High Cost of the Drugs
- 3.4. Market Trends
- 3.4.1. The Oral Route of Administration is Expected to Witness Rapid Growth in Over the Forecast Period
- 4. Market Factor Analysis
- 4.1. Porters Five Forces
- 4.2. Supply/Value Chain
- 4.3. PESTEL analysis
- 4.4. Market Entropy
- 4.5. Patent/Trademark Analysis
- 5. Global Multiple Sclerosis Drugs and Treatment Market Analysis, Insights and Forecast, 2019-2031
- 5.1. Market Analysis, Insights and Forecast - by Drug Type
- 5.1.1. Large-molecule Drugs
- 5.1.2. Small-molecule Drugs
- 5.2. Market Analysis, Insights and Forecast - by Route of Administration
- 5.2.1. Oral
- 5.2.2. Injectable and Other Routes of Administration
- 5.3. Market Analysis, Insights and Forecast - by Region
- 5.3.1. North America
- 5.3.2. Europe
- 5.3.3. Asia Pacific
- 5.3.4. Middle East and Africa
- 5.3.5. South America
- 5.1. Market Analysis, Insights and Forecast - by Drug Type
- 6. North America Multiple Sclerosis Drugs and Treatment Market Analysis, Insights and Forecast, 2019-2031
- 6.1. Market Analysis, Insights and Forecast - by Drug Type
- 6.1.1. Large-molecule Drugs
- 6.1.2. Small-molecule Drugs
- 6.2. Market Analysis, Insights and Forecast - by Route of Administration
- 6.2.1. Oral
- 6.2.2. Injectable and Other Routes of Administration
- 6.1. Market Analysis, Insights and Forecast - by Drug Type
- 7. Europe Multiple Sclerosis Drugs and Treatment Market Analysis, Insights and Forecast, 2019-2031
- 7.1. Market Analysis, Insights and Forecast - by Drug Type
- 7.1.1. Large-molecule Drugs
- 7.1.2. Small-molecule Drugs
- 7.2. Market Analysis, Insights and Forecast - by Route of Administration
- 7.2.1. Oral
- 7.2.2. Injectable and Other Routes of Administration
- 7.1. Market Analysis, Insights and Forecast - by Drug Type
- 8. Asia Pacific Multiple Sclerosis Drugs and Treatment Market Analysis, Insights and Forecast, 2019-2031
- 8.1. Market Analysis, Insights and Forecast - by Drug Type
- 8.1.1. Large-molecule Drugs
- 8.1.2. Small-molecule Drugs
- 8.2. Market Analysis, Insights and Forecast - by Route of Administration
- 8.2.1. Oral
- 8.2.2. Injectable and Other Routes of Administration
- 8.1. Market Analysis, Insights and Forecast - by Drug Type
- 9. Middle East and Africa Multiple Sclerosis Drugs and Treatment Market Analysis, Insights and Forecast, 2019-2031
- 9.1. Market Analysis, Insights and Forecast - by Drug Type
- 9.1.1. Large-molecule Drugs
- 9.1.2. Small-molecule Drugs
- 9.2. Market Analysis, Insights and Forecast - by Route of Administration
- 9.2.1. Oral
- 9.2.2. Injectable and Other Routes of Administration
- 9.1. Market Analysis, Insights and Forecast - by Drug Type
- 10. South America Multiple Sclerosis Drugs and Treatment Market Analysis, Insights and Forecast, 2019-2031
- 10.1. Market Analysis, Insights and Forecast - by Drug Type
- 10.1.1. Large-molecule Drugs
- 10.1.2. Small-molecule Drugs
- 10.2. Market Analysis, Insights and Forecast - by Route of Administration
- 10.2.1. Oral
- 10.2.2. Injectable and Other Routes of Administration
- 10.1. Market Analysis, Insights and Forecast - by Drug Type
- 11. North America Multiple Sclerosis Drugs and Treatment Market Analysis, Insights and Forecast, 2019-2031
- 11.1. Market Analysis, Insights and Forecast - By Country/Sub-region
- 11.1.1 United States
- 11.1.2 Canada
- 11.1.3 Mexico
- 12. Europe Multiple Sclerosis Drugs and Treatment Market Analysis, Insights and Forecast, 2019-2031
- 12.1. Market Analysis, Insights and Forecast - By Country/Sub-region
- 12.1.1 Germany
- 12.1.2 United Kingdom
- 12.1.3 France
- 12.1.4 Italy
- 12.1.5 Spain
- 12.1.6 Rest of Europe
- 13. Asia Pacific Multiple Sclerosis Drugs and Treatment Market Analysis, Insights and Forecast, 2019-2031
- 13.1. Market Analysis, Insights and Forecast - By Country/Sub-region
- 13.1.1 China
- 13.1.2 Japan
- 13.1.3 India
- 13.1.4 Australia
- 13.1.5 South Korea
- 13.1.6 Rest of Asia Pacific
- 14. Middle East and Africa Multiple Sclerosis Drugs and Treatment Market Analysis, Insights and Forecast, 2019-2031
- 14.1. Market Analysis, Insights and Forecast - By Country/Sub-region
- 14.1.1 GCC
- 14.1.2 South Africa
- 14.1.3 Rest of Middle East and Africa
- 15. South America Multiple Sclerosis Drugs and Treatment Market Analysis, Insights and Forecast, 2019-2031
- 15.1. Market Analysis, Insights and Forecast - By Country/Sub-region
- 15.1.1 Brazil
- 15.1.2 Argentina
- 15.1.3 Rest of South America
- 16. Competitive Analysis
- 16.1. Global Market Share Analysis 2024
- 16.2. Company Profiles
- 16.2.1 Sanofi SA
- 16.2.1.1. Overview
- 16.2.1.2. Products
- 16.2.1.3. SWOT Analysis
- 16.2.1.4. Recent Developments
- 16.2.1.5. Financials (Based on Availability)
- 16.2.2 Merck KGaA
- 16.2.2.1. Overview
- 16.2.2.2. Products
- 16.2.2.3. SWOT Analysis
- 16.2.2.4. Recent Developments
- 16.2.2.5. Financials (Based on Availability)
- 16.2.3 Bayer AG
- 16.2.3.1. Overview
- 16.2.3.2. Products
- 16.2.3.3. SWOT Analysis
- 16.2.3.4. Recent Developments
- 16.2.3.5. Financials (Based on Availability)
- 16.2.4 Novartis AG
- 16.2.4.1. Overview
- 16.2.4.2. Products
- 16.2.4.3. SWOT Analysis
- 16.2.4.4. Recent Developments
- 16.2.4.5. Financials (Based on Availability)
- 16.2.5 Biogen
- 16.2.5.1. Overview
- 16.2.5.2. Products
- 16.2.5.3. SWOT Analysis
- 16.2.5.4. Recent Developments
- 16.2.5.5. Financials (Based on Availability)
- 16.2.6 Johnson & Johnson
- 16.2.6.1. Overview
- 16.2.6.2. Products
- 16.2.6.3. SWOT Analysis
- 16.2.6.4. Recent Developments
- 16.2.6.5. Financials (Based on Availability)
- 16.2.7 Teva Pharmaceuticals Industries Ltd
- 16.2.7.1. Overview
- 16.2.7.2. Products
- 16.2.7.3. SWOT Analysis
- 16.2.7.4. Recent Developments
- 16.2.7.5. Financials (Based on Availability)
- 16.2.8 F Hoffmann-La Roche AG
- 16.2.8.1. Overview
- 16.2.8.2. Products
- 16.2.8.3. SWOT Analysis
- 16.2.8.4. Recent Developments
- 16.2.8.5. Financials (Based on Availability)
- 16.2.9 Acorda Therapeutics Inc
- 16.2.9.1. Overview
- 16.2.9.2. Products
- 16.2.9.3. SWOT Analysis
- 16.2.9.4. Recent Developments
- 16.2.9.5. Financials (Based on Availability)
- 16.2.10 Viatris Inc (Mylan NV)
- 16.2.10.1. Overview
- 16.2.10.2. Products
- 16.2.10.3. SWOT Analysis
- 16.2.10.4. Recent Developments
- 16.2.10.5. Financials (Based on Availability)
- 16.2.11 Bristol-Myers Squibb Company
- 16.2.11.1. Overview
- 16.2.11.2. Products
- 16.2.11.3. SWOT Analysis
- 16.2.11.4. Recent Developments
- 16.2.11.5. Financials (Based on Availability)
- 16.2.1 Sanofi SA
List of Figures
- Figure 1: Global Multiple Sclerosis Drugs and Treatment Market Revenue Breakdown (Million, %) by Region 2024 & 2032
- Figure 2: Global Multiple Sclerosis Drugs and Treatment Market Volume Breakdown (K Unit, %) by Region 2024 & 2032
- Figure 3: North America Multiple Sclerosis Drugs and Treatment Market Revenue (Million), by Country 2024 & 2032
- Figure 4: North America Multiple Sclerosis Drugs and Treatment Market Volume (K Unit), by Country 2024 & 2032
- Figure 5: North America Multiple Sclerosis Drugs and Treatment Market Revenue Share (%), by Country 2024 & 2032
- Figure 6: North America Multiple Sclerosis Drugs and Treatment Market Volume Share (%), by Country 2024 & 2032
- Figure 7: Europe Multiple Sclerosis Drugs and Treatment Market Revenue (Million), by Country 2024 & 2032
- Figure 8: Europe Multiple Sclerosis Drugs and Treatment Market Volume (K Unit), by Country 2024 & 2032
- Figure 9: Europe Multiple Sclerosis Drugs and Treatment Market Revenue Share (%), by Country 2024 & 2032
- Figure 10: Europe Multiple Sclerosis Drugs and Treatment Market Volume Share (%), by Country 2024 & 2032
- Figure 11: Asia Pacific Multiple Sclerosis Drugs and Treatment Market Revenue (Million), by Country 2024 & 2032
- Figure 12: Asia Pacific Multiple Sclerosis Drugs and Treatment Market Volume (K Unit), by Country 2024 & 2032
- Figure 13: Asia Pacific Multiple Sclerosis Drugs and Treatment Market Revenue Share (%), by Country 2024 & 2032
- Figure 14: Asia Pacific Multiple Sclerosis Drugs and Treatment Market Volume Share (%), by Country 2024 & 2032
- Figure 15: Middle East and Africa Multiple Sclerosis Drugs and Treatment Market Revenue (Million), by Country 2024 & 2032
- Figure 16: Middle East and Africa Multiple Sclerosis Drugs and Treatment Market Volume (K Unit), by Country 2024 & 2032
- Figure 17: Middle East and Africa Multiple Sclerosis Drugs and Treatment Market Revenue Share (%), by Country 2024 & 2032
- Figure 18: Middle East and Africa Multiple Sclerosis Drugs and Treatment Market Volume Share (%), by Country 2024 & 2032
- Figure 19: South America Multiple Sclerosis Drugs and Treatment Market Revenue (Million), by Country 2024 & 2032
- Figure 20: South America Multiple Sclerosis Drugs and Treatment Market Volume (K Unit), by Country 2024 & 2032
- Figure 21: South America Multiple Sclerosis Drugs and Treatment Market Revenue Share (%), by Country 2024 & 2032
- Figure 22: South America Multiple Sclerosis Drugs and Treatment Market Volume Share (%), by Country 2024 & 2032
- Figure 23: North America Multiple Sclerosis Drugs and Treatment Market Revenue (Million), by Drug Type 2024 & 2032
- Figure 24: North America Multiple Sclerosis Drugs and Treatment Market Volume (K Unit), by Drug Type 2024 & 2032
- Figure 25: North America Multiple Sclerosis Drugs and Treatment Market Revenue Share (%), by Drug Type 2024 & 2032
- Figure 26: North America Multiple Sclerosis Drugs and Treatment Market Volume Share (%), by Drug Type 2024 & 2032
- Figure 27: North America Multiple Sclerosis Drugs and Treatment Market Revenue (Million), by Route of Administration 2024 & 2032
- Figure 28: North America Multiple Sclerosis Drugs and Treatment Market Volume (K Unit), by Route of Administration 2024 & 2032
- Figure 29: North America Multiple Sclerosis Drugs and Treatment Market Revenue Share (%), by Route of Administration 2024 & 2032
- Figure 30: North America Multiple Sclerosis Drugs and Treatment Market Volume Share (%), by Route of Administration 2024 & 2032
- Figure 31: North America Multiple Sclerosis Drugs and Treatment Market Revenue (Million), by Country 2024 & 2032
- Figure 32: North America Multiple Sclerosis Drugs and Treatment Market Volume (K Unit), by Country 2024 & 2032
- Figure 33: North America Multiple Sclerosis Drugs and Treatment Market Revenue Share (%), by Country 2024 & 2032
- Figure 34: North America Multiple Sclerosis Drugs and Treatment Market Volume Share (%), by Country 2024 & 2032
- Figure 35: Europe Multiple Sclerosis Drugs and Treatment Market Revenue (Million), by Drug Type 2024 & 2032
- Figure 36: Europe Multiple Sclerosis Drugs and Treatment Market Volume (K Unit), by Drug Type 2024 & 2032
- Figure 37: Europe Multiple Sclerosis Drugs and Treatment Market Revenue Share (%), by Drug Type 2024 & 2032
- Figure 38: Europe Multiple Sclerosis Drugs and Treatment Market Volume Share (%), by Drug Type 2024 & 2032
- Figure 39: Europe Multiple Sclerosis Drugs and Treatment Market Revenue (Million), by Route of Administration 2024 & 2032
- Figure 40: Europe Multiple Sclerosis Drugs and Treatment Market Volume (K Unit), by Route of Administration 2024 & 2032
- Figure 41: Europe Multiple Sclerosis Drugs and Treatment Market Revenue Share (%), by Route of Administration 2024 & 2032
- Figure 42: Europe Multiple Sclerosis Drugs and Treatment Market Volume Share (%), by Route of Administration 2024 & 2032
- Figure 43: Europe Multiple Sclerosis Drugs and Treatment Market Revenue (Million), by Country 2024 & 2032
- Figure 44: Europe Multiple Sclerosis Drugs and Treatment Market Volume (K Unit), by Country 2024 & 2032
- Figure 45: Europe Multiple Sclerosis Drugs and Treatment Market Revenue Share (%), by Country 2024 & 2032
- Figure 46: Europe Multiple Sclerosis Drugs and Treatment Market Volume Share (%), by Country 2024 & 2032
- Figure 47: Asia Pacific Multiple Sclerosis Drugs and Treatment Market Revenue (Million), by Drug Type 2024 & 2032
- Figure 48: Asia Pacific Multiple Sclerosis Drugs and Treatment Market Volume (K Unit), by Drug Type 2024 & 2032
- Figure 49: Asia Pacific Multiple Sclerosis Drugs and Treatment Market Revenue Share (%), by Drug Type 2024 & 2032
- Figure 50: Asia Pacific Multiple Sclerosis Drugs and Treatment Market Volume Share (%), by Drug Type 2024 & 2032
- Figure 51: Asia Pacific Multiple Sclerosis Drugs and Treatment Market Revenue (Million), by Route of Administration 2024 & 2032
- Figure 52: Asia Pacific Multiple Sclerosis Drugs and Treatment Market Volume (K Unit), by Route of Administration 2024 & 2032
- Figure 53: Asia Pacific Multiple Sclerosis Drugs and Treatment Market Revenue Share (%), by Route of Administration 2024 & 2032
- Figure 54: Asia Pacific Multiple Sclerosis Drugs and Treatment Market Volume Share (%), by Route of Administration 2024 & 2032
- Figure 55: Asia Pacific Multiple Sclerosis Drugs and Treatment Market Revenue (Million), by Country 2024 & 2032
- Figure 56: Asia Pacific Multiple Sclerosis Drugs and Treatment Market Volume (K Unit), by Country 2024 & 2032
- Figure 57: Asia Pacific Multiple Sclerosis Drugs and Treatment Market Revenue Share (%), by Country 2024 & 2032
- Figure 58: Asia Pacific Multiple Sclerosis Drugs and Treatment Market Volume Share (%), by Country 2024 & 2032
- Figure 59: Middle East and Africa Multiple Sclerosis Drugs and Treatment Market Revenue (Million), by Drug Type 2024 & 2032
- Figure 60: Middle East and Africa Multiple Sclerosis Drugs and Treatment Market Volume (K Unit), by Drug Type 2024 & 2032
- Figure 61: Middle East and Africa Multiple Sclerosis Drugs and Treatment Market Revenue Share (%), by Drug Type 2024 & 2032
- Figure 62: Middle East and Africa Multiple Sclerosis Drugs and Treatment Market Volume Share (%), by Drug Type 2024 & 2032
- Figure 63: Middle East and Africa Multiple Sclerosis Drugs and Treatment Market Revenue (Million), by Route of Administration 2024 & 2032
- Figure 64: Middle East and Africa Multiple Sclerosis Drugs and Treatment Market Volume (K Unit), by Route of Administration 2024 & 2032
- Figure 65: Middle East and Africa Multiple Sclerosis Drugs and Treatment Market Revenue Share (%), by Route of Administration 2024 & 2032
- Figure 66: Middle East and Africa Multiple Sclerosis Drugs and Treatment Market Volume Share (%), by Route of Administration 2024 & 2032
- Figure 67: Middle East and Africa Multiple Sclerosis Drugs and Treatment Market Revenue (Million), by Country 2024 & 2032
- Figure 68: Middle East and Africa Multiple Sclerosis Drugs and Treatment Market Volume (K Unit), by Country 2024 & 2032
- Figure 69: Middle East and Africa Multiple Sclerosis Drugs and Treatment Market Revenue Share (%), by Country 2024 & 2032
- Figure 70: Middle East and Africa Multiple Sclerosis Drugs and Treatment Market Volume Share (%), by Country 2024 & 2032
- Figure 71: South America Multiple Sclerosis Drugs and Treatment Market Revenue (Million), by Drug Type 2024 & 2032
- Figure 72: South America Multiple Sclerosis Drugs and Treatment Market Volume (K Unit), by Drug Type 2024 & 2032
- Figure 73: South America Multiple Sclerosis Drugs and Treatment Market Revenue Share (%), by Drug Type 2024 & 2032
- Figure 74: South America Multiple Sclerosis Drugs and Treatment Market Volume Share (%), by Drug Type 2024 & 2032
- Figure 75: South America Multiple Sclerosis Drugs and Treatment Market Revenue (Million), by Route of Administration 2024 & 2032
- Figure 76: South America Multiple Sclerosis Drugs and Treatment Market Volume (K Unit), by Route of Administration 2024 & 2032
- Figure 77: South America Multiple Sclerosis Drugs and Treatment Market Revenue Share (%), by Route of Administration 2024 & 2032
- Figure 78: South America Multiple Sclerosis Drugs and Treatment Market Volume Share (%), by Route of Administration 2024 & 2032
- Figure 79: South America Multiple Sclerosis Drugs and Treatment Market Revenue (Million), by Country 2024 & 2032
- Figure 80: South America Multiple Sclerosis Drugs and Treatment Market Volume (K Unit), by Country 2024 & 2032
- Figure 81: South America Multiple Sclerosis Drugs and Treatment Market Revenue Share (%), by Country 2024 & 2032
- Figure 82: South America Multiple Sclerosis Drugs and Treatment Market Volume Share (%), by Country 2024 & 2032
List of Tables
- Table 1: Global Multiple Sclerosis Drugs and Treatment Market Revenue Million Forecast, by Region 2019 & 2032
- Table 2: Global Multiple Sclerosis Drugs and Treatment Market Volume K Unit Forecast, by Region 2019 & 2032
- Table 3: Global Multiple Sclerosis Drugs and Treatment Market Revenue Million Forecast, by Drug Type 2019 & 2032
- Table 4: Global Multiple Sclerosis Drugs and Treatment Market Volume K Unit Forecast, by Drug Type 2019 & 2032
- Table 5: Global Multiple Sclerosis Drugs and Treatment Market Revenue Million Forecast, by Route of Administration 2019 & 2032
- Table 6: Global Multiple Sclerosis Drugs and Treatment Market Volume K Unit Forecast, by Route of Administration 2019 & 2032
- Table 7: Global Multiple Sclerosis Drugs and Treatment Market Revenue Million Forecast, by Region 2019 & 2032
- Table 8: Global Multiple Sclerosis Drugs and Treatment Market Volume K Unit Forecast, by Region 2019 & 2032
- Table 9: Global Multiple Sclerosis Drugs and Treatment Market Revenue Million Forecast, by Country 2019 & 2032
- Table 10: Global Multiple Sclerosis Drugs and Treatment Market Volume K Unit Forecast, by Country 2019 & 2032
- Table 11: United States Multiple Sclerosis Drugs and Treatment Market Revenue (Million) Forecast, by Application 2019 & 2032
- Table 12: United States Multiple Sclerosis Drugs and Treatment Market Volume (K Unit) Forecast, by Application 2019 & 2032
- Table 13: Canada Multiple Sclerosis Drugs and Treatment Market Revenue (Million) Forecast, by Application 2019 & 2032
- Table 14: Canada Multiple Sclerosis Drugs and Treatment Market Volume (K Unit) Forecast, by Application 2019 & 2032
- Table 15: Mexico Multiple Sclerosis Drugs and Treatment Market Revenue (Million) Forecast, by Application 2019 & 2032
- Table 16: Mexico Multiple Sclerosis Drugs and Treatment Market Volume (K Unit) Forecast, by Application 2019 & 2032
- Table 17: Global Multiple Sclerosis Drugs and Treatment Market Revenue Million Forecast, by Country 2019 & 2032
- Table 18: Global Multiple Sclerosis Drugs and Treatment Market Volume K Unit Forecast, by Country 2019 & 2032
- Table 19: Germany Multiple Sclerosis Drugs and Treatment Market Revenue (Million) Forecast, by Application 2019 & 2032
- Table 20: Germany Multiple Sclerosis Drugs and Treatment Market Volume (K Unit) Forecast, by Application 2019 & 2032
- Table 21: United Kingdom Multiple Sclerosis Drugs and Treatment Market Revenue (Million) Forecast, by Application 2019 & 2032
- Table 22: United Kingdom Multiple Sclerosis Drugs and Treatment Market Volume (K Unit) Forecast, by Application 2019 & 2032
- Table 23: France Multiple Sclerosis Drugs and Treatment Market Revenue (Million) Forecast, by Application 2019 & 2032
- Table 24: France Multiple Sclerosis Drugs and Treatment Market Volume (K Unit) Forecast, by Application 2019 & 2032
- Table 25: Italy Multiple Sclerosis Drugs and Treatment Market Revenue (Million) Forecast, by Application 2019 & 2032
- Table 26: Italy Multiple Sclerosis Drugs and Treatment Market Volume (K Unit) Forecast, by Application 2019 & 2032
- Table 27: Spain Multiple Sclerosis Drugs and Treatment Market Revenue (Million) Forecast, by Application 2019 & 2032
- Table 28: Spain Multiple Sclerosis Drugs and Treatment Market Volume (K Unit) Forecast, by Application 2019 & 2032
- Table 29: Rest of Europe Multiple Sclerosis Drugs and Treatment Market Revenue (Million) Forecast, by Application 2019 & 2032
- Table 30: Rest of Europe Multiple Sclerosis Drugs and Treatment Market Volume (K Unit) Forecast, by Application 2019 & 2032
- Table 31: Global Multiple Sclerosis Drugs and Treatment Market Revenue Million Forecast, by Country 2019 & 2032
- Table 32: Global Multiple Sclerosis Drugs and Treatment Market Volume K Unit Forecast, by Country 2019 & 2032
- Table 33: China Multiple Sclerosis Drugs and Treatment Market Revenue (Million) Forecast, by Application 2019 & 2032
- Table 34: China Multiple Sclerosis Drugs and Treatment Market Volume (K Unit) Forecast, by Application 2019 & 2032
- Table 35: Japan Multiple Sclerosis Drugs and Treatment Market Revenue (Million) Forecast, by Application 2019 & 2032
- Table 36: Japan Multiple Sclerosis Drugs and Treatment Market Volume (K Unit) Forecast, by Application 2019 & 2032
- Table 37: India Multiple Sclerosis Drugs and Treatment Market Revenue (Million) Forecast, by Application 2019 & 2032
- Table 38: India Multiple Sclerosis Drugs and Treatment Market Volume (K Unit) Forecast, by Application 2019 & 2032
- Table 39: Australia Multiple Sclerosis Drugs and Treatment Market Revenue (Million) Forecast, by Application 2019 & 2032
- Table 40: Australia Multiple Sclerosis Drugs and Treatment Market Volume (K Unit) Forecast, by Application 2019 & 2032
- Table 41: South Korea Multiple Sclerosis Drugs and Treatment Market Revenue (Million) Forecast, by Application 2019 & 2032
- Table 42: South Korea Multiple Sclerosis Drugs and Treatment Market Volume (K Unit) Forecast, by Application 2019 & 2032
- Table 43: Rest of Asia Pacific Multiple Sclerosis Drugs and Treatment Market Revenue (Million) Forecast, by Application 2019 & 2032
- Table 44: Rest of Asia Pacific Multiple Sclerosis Drugs and Treatment Market Volume (K Unit) Forecast, by Application 2019 & 2032
- Table 45: Global Multiple Sclerosis Drugs and Treatment Market Revenue Million Forecast, by Country 2019 & 2032
- Table 46: Global Multiple Sclerosis Drugs and Treatment Market Volume K Unit Forecast, by Country 2019 & 2032
- Table 47: GCC Multiple Sclerosis Drugs and Treatment Market Revenue (Million) Forecast, by Application 2019 & 2032
- Table 48: GCC Multiple Sclerosis Drugs and Treatment Market Volume (K Unit) Forecast, by Application 2019 & 2032
- Table 49: South Africa Multiple Sclerosis Drugs and Treatment Market Revenue (Million) Forecast, by Application 2019 & 2032
- Table 50: South Africa Multiple Sclerosis Drugs and Treatment Market Volume (K Unit) Forecast, by Application 2019 & 2032
- Table 51: Rest of Middle East and Africa Multiple Sclerosis Drugs and Treatment Market Revenue (Million) Forecast, by Application 2019 & 2032
- Table 52: Rest of Middle East and Africa Multiple Sclerosis Drugs and Treatment Market Volume (K Unit) Forecast, by Application 2019 & 2032
- Table 53: Global Multiple Sclerosis Drugs and Treatment Market Revenue Million Forecast, by Country 2019 & 2032
- Table 54: Global Multiple Sclerosis Drugs and Treatment Market Volume K Unit Forecast, by Country 2019 & 2032
- Table 55: Brazil Multiple Sclerosis Drugs and Treatment Market Revenue (Million) Forecast, by Application 2019 & 2032
- Table 56: Brazil Multiple Sclerosis Drugs and Treatment Market Volume (K Unit) Forecast, by Application 2019 & 2032
- Table 57: Argentina Multiple Sclerosis Drugs and Treatment Market Revenue (Million) Forecast, by Application 2019 & 2032
- Table 58: Argentina Multiple Sclerosis Drugs and Treatment Market Volume (K Unit) Forecast, by Application 2019 & 2032
- Table 59: Rest of South America Multiple Sclerosis Drugs and Treatment Market Revenue (Million) Forecast, by Application 2019 & 2032
- Table 60: Rest of South America Multiple Sclerosis Drugs and Treatment Market Volume (K Unit) Forecast, by Application 2019 & 2032
- Table 61: Global Multiple Sclerosis Drugs and Treatment Market Revenue Million Forecast, by Drug Type 2019 & 2032
- Table 62: Global Multiple Sclerosis Drugs and Treatment Market Volume K Unit Forecast, by Drug Type 2019 & 2032
- Table 63: Global Multiple Sclerosis Drugs and Treatment Market Revenue Million Forecast, by Route of Administration 2019 & 2032
- Table 64: Global Multiple Sclerosis Drugs and Treatment Market Volume K Unit Forecast, by Route of Administration 2019 & 2032
- Table 65: Global Multiple Sclerosis Drugs and Treatment Market Revenue Million Forecast, by Country 2019 & 2032
- Table 66: Global Multiple Sclerosis Drugs and Treatment Market Volume K Unit Forecast, by Country 2019 & 2032
- Table 67: United States Multiple Sclerosis Drugs and Treatment Market Revenue (Million) Forecast, by Application 2019 & 2032
- Table 68: United States Multiple Sclerosis Drugs and Treatment Market Volume (K Unit) Forecast, by Application 2019 & 2032
- Table 69: Canada Multiple Sclerosis Drugs and Treatment Market Revenue (Million) Forecast, by Application 2019 & 2032
- Table 70: Canada Multiple Sclerosis Drugs and Treatment Market Volume (K Unit) Forecast, by Application 2019 & 2032
- Table 71: Mexico Multiple Sclerosis Drugs and Treatment Market Revenue (Million) Forecast, by Application 2019 & 2032
- Table 72: Mexico Multiple Sclerosis Drugs and Treatment Market Volume (K Unit) Forecast, by Application 2019 & 2032
- Table 73: Global Multiple Sclerosis Drugs and Treatment Market Revenue Million Forecast, by Drug Type 2019 & 2032
- Table 74: Global Multiple Sclerosis Drugs and Treatment Market Volume K Unit Forecast, by Drug Type 2019 & 2032
- Table 75: Global Multiple Sclerosis Drugs and Treatment Market Revenue Million Forecast, by Route of Administration 2019 & 2032
- Table 76: Global Multiple Sclerosis Drugs and Treatment Market Volume K Unit Forecast, by Route of Administration 2019 & 2032
- Table 77: Global Multiple Sclerosis Drugs and Treatment Market Revenue Million Forecast, by Country 2019 & 2032
- Table 78: Global Multiple Sclerosis Drugs and Treatment Market Volume K Unit Forecast, by Country 2019 & 2032
- Table 79: Germany Multiple Sclerosis Drugs and Treatment Market Revenue (Million) Forecast, by Application 2019 & 2032
- Table 80: Germany Multiple Sclerosis Drugs and Treatment Market Volume (K Unit) Forecast, by Application 2019 & 2032
- Table 81: United Kingdom Multiple Sclerosis Drugs and Treatment Market Revenue (Million) Forecast, by Application 2019 & 2032
- Table 82: United Kingdom Multiple Sclerosis Drugs and Treatment Market Volume (K Unit) Forecast, by Application 2019 & 2032
- Table 83: France Multiple Sclerosis Drugs and Treatment Market Revenue (Million) Forecast, by Application 2019 & 2032
- Table 84: France Multiple Sclerosis Drugs and Treatment Market Volume (K Unit) Forecast, by Application 2019 & 2032
- Table 85: Italy Multiple Sclerosis Drugs and Treatment Market Revenue (Million) Forecast, by Application 2019 & 2032
- Table 86: Italy Multiple Sclerosis Drugs and Treatment Market Volume (K Unit) Forecast, by Application 2019 & 2032
- Table 87: Spain Multiple Sclerosis Drugs and Treatment Market Revenue (Million) Forecast, by Application 2019 & 2032
- Table 88: Spain Multiple Sclerosis Drugs and Treatment Market Volume (K Unit) Forecast, by Application 2019 & 2032
- Table 89: Rest of Europe Multiple Sclerosis Drugs and Treatment Market Revenue (Million) Forecast, by Application 2019 & 2032
- Table 90: Rest of Europe Multiple Sclerosis Drugs and Treatment Market Volume (K Unit) Forecast, by Application 2019 & 2032
- Table 91: Global Multiple Sclerosis Drugs and Treatment Market Revenue Million Forecast, by Drug Type 2019 & 2032
- Table 92: Global Multiple Sclerosis Drugs and Treatment Market Volume K Unit Forecast, by Drug Type 2019 & 2032
- Table 93: Global Multiple Sclerosis Drugs and Treatment Market Revenue Million Forecast, by Route of Administration 2019 & 2032
- Table 94: Global Multiple Sclerosis Drugs and Treatment Market Volume K Unit Forecast, by Route of Administration 2019 & 2032
- Table 95: Global Multiple Sclerosis Drugs and Treatment Market Revenue Million Forecast, by Country 2019 & 2032
- Table 96: Global Multiple Sclerosis Drugs and Treatment Market Volume K Unit Forecast, by Country 2019 & 2032
- Table 97: China Multiple Sclerosis Drugs and Treatment Market Revenue (Million) Forecast, by Application 2019 & 2032
- Table 98: China Multiple Sclerosis Drugs and Treatment Market Volume (K Unit) Forecast, by Application 2019 & 2032
- Table 99: Japan Multiple Sclerosis Drugs and Treatment Market Revenue (Million) Forecast, by Application 2019 & 2032
- Table 100: Japan Multiple Sclerosis Drugs and Treatment Market Volume (K Unit) Forecast, by Application 2019 & 2032
- Table 101: India Multiple Sclerosis Drugs and Treatment Market Revenue (Million) Forecast, by Application 2019 & 2032
- Table 102: India Multiple Sclerosis Drugs and Treatment Market Volume (K Unit) Forecast, by Application 2019 & 2032
- Table 103: Australia Multiple Sclerosis Drugs and Treatment Market Revenue (Million) Forecast, by Application 2019 & 2032
- Table 104: Australia Multiple Sclerosis Drugs and Treatment Market Volume (K Unit) Forecast, by Application 2019 & 2032
- Table 105: South Korea Multiple Sclerosis Drugs and Treatment Market Revenue (Million) Forecast, by Application 2019 & 2032
- Table 106: South Korea Multiple Sclerosis Drugs and Treatment Market Volume (K Unit) Forecast, by Application 2019 & 2032
- Table 107: Rest of Asia Pacific Multiple Sclerosis Drugs and Treatment Market Revenue (Million) Forecast, by Application 2019 & 2032
- Table 108: Rest of Asia Pacific Multiple Sclerosis Drugs and Treatment Market Volume (K Unit) Forecast, by Application 2019 & 2032
- Table 109: Global Multiple Sclerosis Drugs and Treatment Market Revenue Million Forecast, by Drug Type 2019 & 2032
- Table 110: Global Multiple Sclerosis Drugs and Treatment Market Volume K Unit Forecast, by Drug Type 2019 & 2032
- Table 111: Global Multiple Sclerosis Drugs and Treatment Market Revenue Million Forecast, by Route of Administration 2019 & 2032
- Table 112: Global Multiple Sclerosis Drugs and Treatment Market Volume K Unit Forecast, by Route of Administration 2019 & 2032
- Table 113: Global Multiple Sclerosis Drugs and Treatment Market Revenue Million Forecast, by Country 2019 & 2032
- Table 114: Global Multiple Sclerosis Drugs and Treatment Market Volume K Unit Forecast, by Country 2019 & 2032
- Table 115: GCC Multiple Sclerosis Drugs and Treatment Market Revenue (Million) Forecast, by Application 2019 & 2032
- Table 116: GCC Multiple Sclerosis Drugs and Treatment Market Volume (K Unit) Forecast, by Application 2019 & 2032
- Table 117: South Africa Multiple Sclerosis Drugs and Treatment Market Revenue (Million) Forecast, by Application 2019 & 2032
- Table 118: South Africa Multiple Sclerosis Drugs and Treatment Market Volume (K Unit) Forecast, by Application 2019 & 2032
- Table 119: Rest of Middle East and Africa Multiple Sclerosis Drugs and Treatment Market Revenue (Million) Forecast, by Application 2019 & 2032
- Table 120: Rest of Middle East and Africa Multiple Sclerosis Drugs and Treatment Market Volume (K Unit) Forecast, by Application 2019 & 2032
- Table 121: Global Multiple Sclerosis Drugs and Treatment Market Revenue Million Forecast, by Drug Type 2019 & 2032
- Table 122: Global Multiple Sclerosis Drugs and Treatment Market Volume K Unit Forecast, by Drug Type 2019 & 2032
- Table 123: Global Multiple Sclerosis Drugs and Treatment Market Revenue Million Forecast, by Route of Administration 2019 & 2032
- Table 124: Global Multiple Sclerosis Drugs and Treatment Market Volume K Unit Forecast, by Route of Administration 2019 & 2032
- Table 125: Global Multiple Sclerosis Drugs and Treatment Market Revenue Million Forecast, by Country 2019 & 2032
- Table 126: Global Multiple Sclerosis Drugs and Treatment Market Volume K Unit Forecast, by Country 2019 & 2032
- Table 127: Brazil Multiple Sclerosis Drugs and Treatment Market Revenue (Million) Forecast, by Application 2019 & 2032
- Table 128: Brazil Multiple Sclerosis Drugs and Treatment Market Volume (K Unit) Forecast, by Application 2019 & 2032
- Table 129: Argentina Multiple Sclerosis Drugs and Treatment Market Revenue (Million) Forecast, by Application 2019 & 2032
- Table 130: Argentina Multiple Sclerosis Drugs and Treatment Market Volume (K Unit) Forecast, by Application 2019 & 2032
- Table 131: Rest of South America Multiple Sclerosis Drugs and Treatment Market Revenue (Million) Forecast, by Application 2019 & 2032
- Table 132: Rest of South America Multiple Sclerosis Drugs and Treatment Market Volume (K Unit) Forecast, by Application 2019 & 2032
Frequently Asked Questions
1. What is the projected Compound Annual Growth Rate (CAGR) of the Multiple Sclerosis Drugs and Treatment Market?
The projected CAGR is approximately 3.87%.
2. Which companies are prominent players in the Multiple Sclerosis Drugs and Treatment Market?
Key companies in the market include Sanofi SA, Merck KGaA, Bayer AG, Novartis AG, Biogen, Johnson & Johnson, Teva Pharmaceuticals Industries Ltd, F Hoffmann-La Roche AG, Acorda Therapeutics Inc, Viatris Inc (Mylan NV), Bristol-Myers Squibb Company.
3. What are the main segments of the Multiple Sclerosis Drugs and Treatment Market?
The market segments include Drug Type, Route of Administration.
4. Can you provide details about the market size?
The market size is estimated to be USD 31.03 Million as of 2022.
5. What are some drivers contributing to market growth?
Rising Cases of Multiple Sclerosis across the World; Growing Focus of Companies on Pipeline Products for MS.
6. What are the notable trends driving market growth?
The Oral Route of Administration is Expected to Witness Rapid Growth in Over the Forecast Period.
7. Are there any restraints impacting market growth?
Side Effects Associated with the Medication; High Cost of the Drugs.
8. Can you provide examples of recent developments in the market?
October 2023: Bristol Myers Squibb presented Zeposia's (ozanimod) data on long-term disease progression and cognition in patients with relapsing forms of multiple sclerosis (MS). 76% of patients treated with Zeposia for relapsing multiple sclerosis (RMS) were free of six-month confirmed disability progression (CDP).
9. What pricing options are available for accessing the report?
Pricing options include single-user, multi-user, and enterprise licenses priced at USD 4750, USD 5250, and USD 8750 respectively.
10. Is the market size provided in terms of value or volume?
The market size is provided in terms of value, measured in Million and volume, measured in K Unit.
11. Are there any specific market keywords associated with the report?
Yes, the market keyword associated with the report is "Multiple Sclerosis Drugs and Treatment Market," which aids in identifying and referencing the specific market segment covered.
12. How do I determine which pricing option suits my needs best?
The pricing options vary based on user requirements and access needs. Individual users may opt for single-user licenses, while businesses requiring broader access may choose multi-user or enterprise licenses for cost-effective access to the report.
13. Are there any additional resources or data provided in the Multiple Sclerosis Drugs and Treatment Market report?
While the report offers comprehensive insights, it's advisable to review the specific contents or supplementary materials provided to ascertain if additional resources or data are available.
14. How can I stay updated on further developments or reports in the Multiple Sclerosis Drugs and Treatment Market?
To stay informed about further developments, trends, and reports in the Multiple Sclerosis Drugs and Treatment Market, consider subscribing to industry newsletters, following relevant companies and organizations, or regularly checking reputable industry news sources and publications.
Methodology
Step 1 - Identification of Relevant Samples Size from Population Database


Step 2 - Approaches for Defining Global Market Size (Value, Volume* & Price*)

Note*: In applicable scenarios
Step 3 - Data Sources
Primary Research
- Web Analytics
- Survey Reports
- Research Institute
- Latest Research Reports
- Opinion Leaders
Secondary Research
- Annual Reports
- White Paper
- Latest Press Release
- Industry Association
- Paid Database
- Investor Presentations

Step 4 - Data Triangulation
Involves using different sources of information in order to increase the validity of a study
These sources are likely to be stakeholders in a program - participants, other researchers, program staff, other community members, and so on.
Then we put all data in single framework & apply various statistical tools to find out the dynamic on the market.
During the analysis stage, feedback from the stakeholder groups would be compared to determine areas of agreement as well as areas of divergence
