

Key Insights
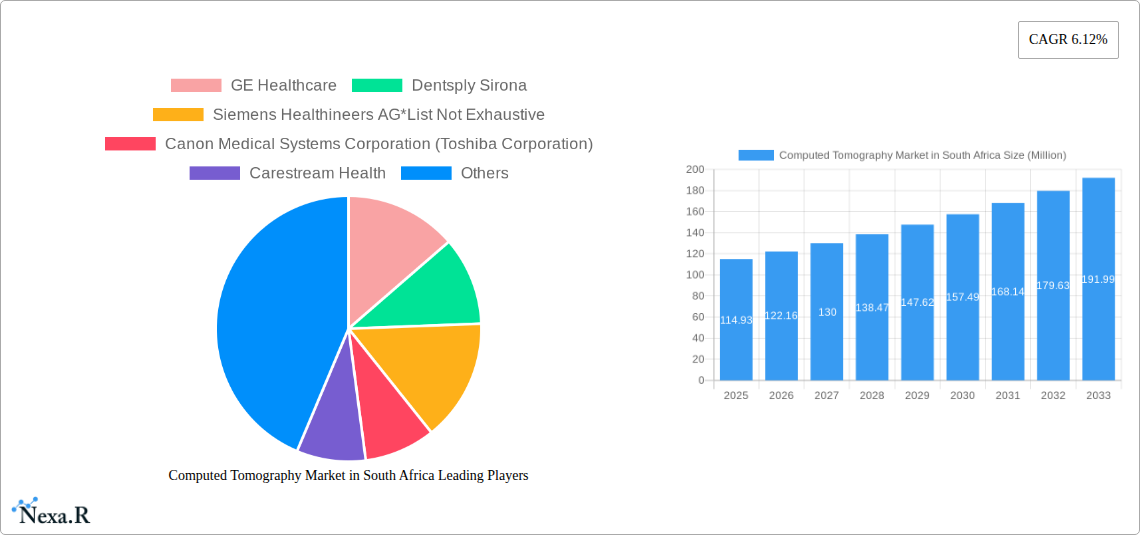
The South African Computed Tomography (CT) market, valued at approximately $114.93 million in 2025, is projected to experience robust growth, driven by factors such as increasing prevalence of chronic diseases (cancer, cardiovascular diseases, neurological disorders), rising healthcare expenditure, and technological advancements leading to improved image quality and faster scan times. The market is segmented by type (low, medium, and high slice CT scanners), application (oncology, neurology, cardiovascular, musculoskeletal, and other applications), and end-user (hospitals and diagnostic centers). The high slice CT segment is expected to dominate due to its superior imaging capabilities, enabling more precise diagnoses and treatment planning. Growth in the oncology and neurology application segments will be particularly strong due to the increasing incidence of cancers and neurological conditions in South Africa. However, factors such as high equipment costs, limited healthcare infrastructure in certain regions, and a skilled radiologist shortage could potentially restrain market expansion. Key players like GE Healthcare, Dentsply Sirona, Siemens Healthineers, and Canon Medical Systems are actively competing within this dynamic market, focusing on technological innovation and strategic partnerships to gain market share. The forecast period (2025-2033) anticipates a continued upward trajectory, fueled by government initiatives aimed at improving healthcare access and infrastructure development.
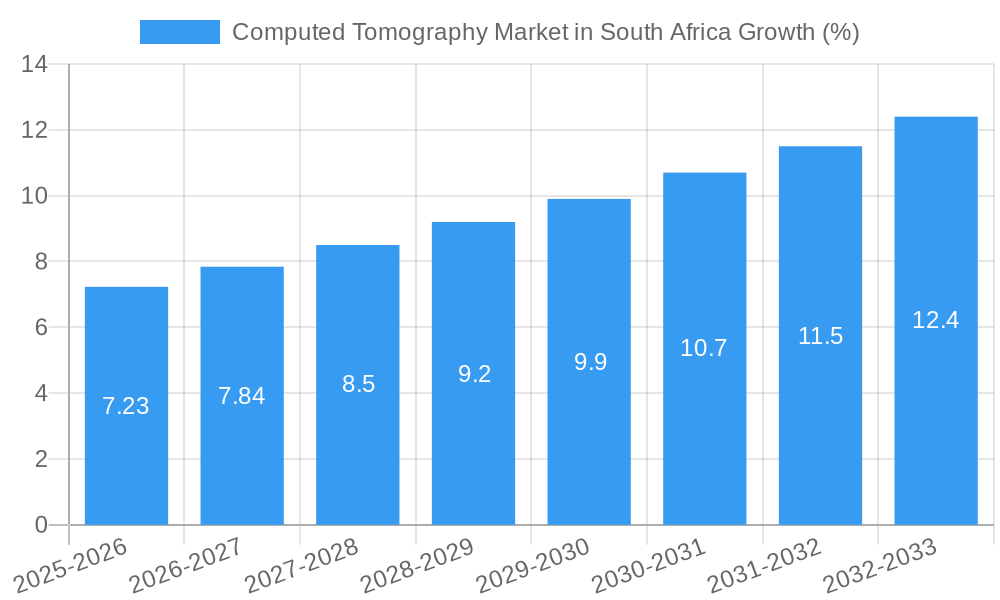
Considering a CAGR of 6.12%, and projecting logically based on typical market growth patterns in developing economies with similar healthcare infrastructure, we can anticipate a steady increase in the South African CT market throughout the forecast period. The growth will likely be more pronounced in urban areas with better healthcare facilities compared to rural areas where access remains limited. The market will likely see greater penetration of advanced imaging techniques, further boosting the demand for higher-end CT scanners. Competition among established players and the potential entry of new players are expected to influence pricing and market dynamics, potentially benefiting consumers through increased accessibility and competitive pricing in the long run.
Computed Tomography Market in South Africa: A Comprehensive Market Report (2019-2033)
This in-depth report provides a comprehensive analysis of the Computed Tomography (CT) market in South Africa, covering market dynamics, growth trends, key players, and future outlook. The report utilizes data from the historical period (2019-2024), base year (2025), and projects growth through the forecast period (2025-2033). The South African CT market is segmented by type (Low Slice, Medium Slice, High Slice), application (Oncology, Neurology, Cardiovascular, Musculoskeletal, Other Applications), and end-user (Hospitals, Diagnostic Centers, Other End Users). The total market value is presented in Million units.
Keywords: South Africa CT Scan Market, Computed Tomography Market South Africa, Medical Imaging South Africa, Radiology Equipment South Africa, CT Scan Market Size South Africa, CT Scan Market Growth South Africa, Low Slice CT, Medium Slice CT, High Slice CT, Oncology CT Scan, Neurology CT Scan, Cardiovascular CT Scan, Musculoskeletal CT Scan, Hospital CT Scan, Diagnostic Center CT Scan, GE Healthcare, Siemens Healthineers, Philips Healthcare, South Africa Healthcare Market.
Computed Tomography Market in South Africa Market Dynamics & Structure
The South African Computed Tomography market is characterized by moderate concentration, with key players like GE Healthcare, Siemens Healthineers AG, Koninklijke Philips NV, Fujifilm Holdings Corporation, Canon Medical Systems Corporation (Toshiba Corporation), Dentsply Sirona, and Carestream Health holding significant market share. The market is driven by technological advancements, particularly in high-slice CT scanners offering improved image quality and faster scan times. However, regulatory hurdles and infrastructure limitations in certain regions pose challenges. The increasing prevalence of chronic diseases and a growing elderly population fuel demand. M&A activity, as evidenced by Life Healthcare's acquisition of East Coast Radiology in 2022, indicates consolidation and expansion strategies within the sector.
- Market Concentration: Moderately concentrated, with top players holding xx% market share (2025).
- Technological Innovation: High-slice CT scanners are driving market growth with improved resolution and speed.
- Regulatory Framework: SAHPRA (South African Health Products Regulatory Authority) regulations influence market access.
- Competitive Substitutes: MRI and ultrasound imaging are competitive alternatives.
- End-User Demographics: Growing elderly population and rising prevalence of chronic diseases are key drivers.
- M&A Trends: Increased consolidation through acquisitions and partnerships observed in recent years, xx deals in the last 5 years.
Computed Tomography Market in South Africa Growth Trends & Insights
The South African CT market experienced significant growth during the historical period (2019-2024), with a Compound Annual Growth Rate (CAGR) of xx%. This growth is projected to continue during the forecast period (2025-2033), with a CAGR of xx%, driven by factors such as increasing healthcare expenditure, rising prevalence of chronic diseases like cancer and cardiovascular diseases, government initiatives to improve healthcare infrastructure, and technological advancements in CT scan technology. Market penetration is estimated at xx% in 2025, with substantial growth potential in underserved regions. The adoption of advanced CT technologies like multislice CT scanners and dual-energy CT is also expected to contribute significantly to market growth. Consumer behavior shifts are seen towards greater demand for quicker, more accurate, and less invasive diagnostic techniques, further propelling market expansion.
Dominant Regions, Countries, or Segments in Computed Tomography Market in South Africa
The major metropolitan areas like Gauteng, Western Cape, and KwaZulu-Natal account for the largest share of the CT market in South Africa due to higher concentration of hospitals, diagnostic centers, and specialized medical facilities. Within the segmentation:
- By Type: High-slice CT scanners are dominant, driven by their superior image quality and speed.
- By Application: Oncology and cardiovascular applications are leading segments, reflecting high prevalence of related diseases.
- By End User: Hospitals dominate the market due to their comprehensive diagnostic capabilities and higher patient volumes.
Key Drivers:
- Government initiatives: Investments in healthcare infrastructure and medical technology.
- Private sector investment: Increased spending on diagnostic imaging equipment.
- Rising prevalence of chronic diseases: Driving demand for accurate and timely diagnosis.
Computed Tomography Market in South Africa Product Landscape
The South African CT market features a diverse range of products, from basic low-slice to advanced high-slice scanners. Key innovations include iterative reconstruction techniques for reduced radiation dose, multi-slice capabilities for faster scan times, and advanced software for improved image analysis. Manufacturers focus on delivering high-quality images, reducing scan times, minimizing radiation exposure, and user-friendly interfaces. Unique selling propositions often revolve around speed, image quality, and radiation dose reduction.
Key Drivers, Barriers & Challenges in Computed Tomography Market in South Africa
Key Drivers:
- Increasing prevalence of chronic diseases requiring advanced imaging.
- Technological advancements in CT scan technology.
- Government initiatives to improve healthcare infrastructure.
Key Barriers and Challenges:
- High cost of CT scanners, limiting accessibility in underserved areas.
- Limited skilled technicians and radiologists in certain regions.
- Regulatory hurdles and complex procurement processes.
- Supply chain disruptions, affecting equipment availability and servicing. This has led to an estimated xx% increase in lead times for certain components in 2023.
Emerging Opportunities in Computed Tomography Market in South Africa
- Tele radiology: Remote interpretation of CT scans could address the shortage of radiologists in rural areas.
- Artificial Intelligence (AI): AI-powered image analysis tools can improve diagnostic accuracy and efficiency.
- Expansion into underserved regions: Significant untapped market potential exists beyond major cities.
Growth Accelerators in the Computed Tomography Market in South Africa Industry
Strategic partnerships between healthcare providers and technology companies are accelerating market growth. Investments in training and development programs to address the shortage of skilled personnel are also crucial. Furthermore, innovative financing models that facilitate access to advanced CT technology for smaller facilities will significantly expand market penetration.
Key Players Shaping the Computed Tomography Market in South Africa Market
- GE Healthcare
- Dentsply Sirona
- Siemens Healthineers AG
- Canon Medical Systems Corporation (Toshiba Corporation)
- Carestream Health
- Koninklijke Philips NV
- Fujifilm Holdings Corporation
Notable Milestones in Computed Tomography Market in South Africa Sector
- February 2022: Life Healthcare's acquisition of East Coast Radiology expands its imaging capabilities in the Eastern Cape.
- August 2021: Partnership between IFC and BRP enhances access to high-quality diagnostic services, including CT scans, particularly for infectious diseases.
In-Depth Computed Tomography Market in South Africa Market Outlook
The South African CT market is poised for robust growth in the coming years. Continued investments in healthcare infrastructure, technological advancements, and strategic partnerships will fuel market expansion. Addressing challenges related to accessibility and affordability remains crucial for unlocking the full market potential and improving healthcare outcomes across the country. The focus on advanced imaging technologies and AI-powered solutions will create further opportunities for growth and innovation within the sector.
Computed Tomography Market in South Africa Segmentation
-
1. Type
- 1.1. Low Slice
- 1.2. Medium Slice
- 1.3. High Slice
-
2. Application
- 2.1. Oncology
- 2.2. Neurology
- 2.3. Cardiovascular
- 2.4. Musculoskeletal
- 2.5. Other Applications
-
3. End User
- 3.1. Hospitals
- 3.2. Diagnostic Centers
- 3.3. Other End Users
Computed Tomography Market in South Africa Segmentation By Geography
-
1. North America
- 1.1. United States
- 1.2. Canada
- 1.3. Mexico
-
2. South America
- 2.1. Brazil
- 2.2. Argentina
- 2.3. Rest of South America
-
3. Europe
- 3.1. United Kingdom
- 3.2. Germany
- 3.3. France
- 3.4. Italy
- 3.5. Spain
- 3.6. Russia
- 3.7. Benelux
- 3.8. Nordics
- 3.9. Rest of Europe
-
4. Middle East & Africa
- 4.1. Turkey
- 4.2. Israel
- 4.3. GCC
- 4.4. North Africa
- 4.5. South Africa
- 4.6. Rest of Middle East & Africa
-
5. Asia Pacific
- 5.1. China
- 5.2. India
- 5.3. Japan
- 5.4. South Korea
- 5.5. ASEAN
- 5.6. Oceania
- 5.7. Rest of Asia Pacific
Computed Tomography Market in South Africa REPORT HIGHLIGHTS
| Aspects | Details |
|---|---|
| Study Period | 2019-2033 |
| Base Year | 2024 |
| Estimated Year | 2025 |
| Forecast Period | 2025-2033 |
| Historical Period | 2019-2024 |
| Growth Rate | CAGR of 6.12% from 2019-2033 |
| Segmentation |
|
Table of Contents
- 1. Introduction
- 1.1. Research Scope
- 1.2. Market Segmentation
- 1.3. Research Methodology
- 1.4. Definitions and Assumptions
- 2. Executive Summary
- 2.1. Introduction
- 3. Market Dynamics
- 3.1. Introduction
- 3.2. Market Drivers
- 3.2.1. Increasing Prevalence of Chronic Diseases; Rising Geriatric Population; Increasing Technological Advancements
- 3.3. Market Restrains
- 3.3.1. Lack Of Proper Reimbursement And Stringent Regulatory Approval Procedures; High Cost of Equipment
- 3.4. Market Trends
- 3.4.1. Oncology Segment is Expected to Hold a Significant Market Share Over the Forecast Period
- 4. Market Factor Analysis
- 4.1. Porters Five Forces
- 4.2. Supply/Value Chain
- 4.3. PESTEL analysis
- 4.4. Market Entropy
- 4.5. Patent/Trademark Analysis
- 5. Global Computed Tomography Market in South Africa Analysis, Insights and Forecast, 2019-2031
- 5.1. Market Analysis, Insights and Forecast - by Type
- 5.1.1. Low Slice
- 5.1.2. Medium Slice
- 5.1.3. High Slice
- 5.2. Market Analysis, Insights and Forecast - by Application
- 5.2.1. Oncology
- 5.2.2. Neurology
- 5.2.3. Cardiovascular
- 5.2.4. Musculoskeletal
- 5.2.5. Other Applications
- 5.3. Market Analysis, Insights and Forecast - by End User
- 5.3.1. Hospitals
- 5.3.2. Diagnostic Centers
- 5.3.3. Other End Users
- 5.4. Market Analysis, Insights and Forecast - by Region
- 5.4.1. North America
- 5.4.2. South America
- 5.4.3. Europe
- 5.4.4. Middle East & Africa
- 5.4.5. Asia Pacific
- 5.1. Market Analysis, Insights and Forecast - by Type
- 6. North America Computed Tomography Market in South Africa Analysis, Insights and Forecast, 2019-2031
- 6.1. Market Analysis, Insights and Forecast - by Type
- 6.1.1. Low Slice
- 6.1.2. Medium Slice
- 6.1.3. High Slice
- 6.2. Market Analysis, Insights and Forecast - by Application
- 6.2.1. Oncology
- 6.2.2. Neurology
- 6.2.3. Cardiovascular
- 6.2.4. Musculoskeletal
- 6.2.5. Other Applications
- 6.3. Market Analysis, Insights and Forecast - by End User
- 6.3.1. Hospitals
- 6.3.2. Diagnostic Centers
- 6.3.3. Other End Users
- 6.1. Market Analysis, Insights and Forecast - by Type
- 7. South America Computed Tomography Market in South Africa Analysis, Insights and Forecast, 2019-2031
- 7.1. Market Analysis, Insights and Forecast - by Type
- 7.1.1. Low Slice
- 7.1.2. Medium Slice
- 7.1.3. High Slice
- 7.2. Market Analysis, Insights and Forecast - by Application
- 7.2.1. Oncology
- 7.2.2. Neurology
- 7.2.3. Cardiovascular
- 7.2.4. Musculoskeletal
- 7.2.5. Other Applications
- 7.3. Market Analysis, Insights and Forecast - by End User
- 7.3.1. Hospitals
- 7.3.2. Diagnostic Centers
- 7.3.3. Other End Users
- 7.1. Market Analysis, Insights and Forecast - by Type
- 8. Europe Computed Tomography Market in South Africa Analysis, Insights and Forecast, 2019-2031
- 8.1. Market Analysis, Insights and Forecast - by Type
- 8.1.1. Low Slice
- 8.1.2. Medium Slice
- 8.1.3. High Slice
- 8.2. Market Analysis, Insights and Forecast - by Application
- 8.2.1. Oncology
- 8.2.2. Neurology
- 8.2.3. Cardiovascular
- 8.2.4. Musculoskeletal
- 8.2.5. Other Applications
- 8.3. Market Analysis, Insights and Forecast - by End User
- 8.3.1. Hospitals
- 8.3.2. Diagnostic Centers
- 8.3.3. Other End Users
- 8.1. Market Analysis, Insights and Forecast - by Type
- 9. Middle East & Africa Computed Tomography Market in South Africa Analysis, Insights and Forecast, 2019-2031
- 9.1. Market Analysis, Insights and Forecast - by Type
- 9.1.1. Low Slice
- 9.1.2. Medium Slice
- 9.1.3. High Slice
- 9.2. Market Analysis, Insights and Forecast - by Application
- 9.2.1. Oncology
- 9.2.2. Neurology
- 9.2.3. Cardiovascular
- 9.2.4. Musculoskeletal
- 9.2.5. Other Applications
- 9.3. Market Analysis, Insights and Forecast - by End User
- 9.3.1. Hospitals
- 9.3.2. Diagnostic Centers
- 9.3.3. Other End Users
- 9.1. Market Analysis, Insights and Forecast - by Type
- 10. Asia Pacific Computed Tomography Market in South Africa Analysis, Insights and Forecast, 2019-2031
- 10.1. Market Analysis, Insights and Forecast - by Type
- 10.1.1. Low Slice
- 10.1.2. Medium Slice
- 10.1.3. High Slice
- 10.2. Market Analysis, Insights and Forecast - by Application
- 10.2.1. Oncology
- 10.2.2. Neurology
- 10.2.3. Cardiovascular
- 10.2.4. Musculoskeletal
- 10.2.5. Other Applications
- 10.3. Market Analysis, Insights and Forecast - by End User
- 10.3.1. Hospitals
- 10.3.2. Diagnostic Centers
- 10.3.3. Other End Users
- 10.1. Market Analysis, Insights and Forecast - by Type
- 11. South Africa Computed Tomography Market in South Africa Analysis, Insights and Forecast, 2019-2031
- 12. Sudan Computed Tomography Market in South Africa Analysis, Insights and Forecast, 2019-2031
- 13. Uganda Computed Tomography Market in South Africa Analysis, Insights and Forecast, 2019-2031
- 14. Tanzania Computed Tomography Market in South Africa Analysis, Insights and Forecast, 2019-2031
- 15. Kenya Computed Tomography Market in South Africa Analysis, Insights and Forecast, 2019-2031
- 16. Rest of Africa Computed Tomography Market in South Africa Analysis, Insights and Forecast, 2019-2031
- 17. Competitive Analysis
- 17.1. Global Market Share Analysis 2024
- 17.2. Company Profiles
- 17.2.1 GE Healthcare
- 17.2.1.1. Overview
- 17.2.1.2. Products
- 17.2.1.3. SWOT Analysis
- 17.2.1.4. Recent Developments
- 17.2.1.5. Financials (Based on Availability)
- 17.2.2 Dentsply Sirona
- 17.2.2.1. Overview
- 17.2.2.2. Products
- 17.2.2.3. SWOT Analysis
- 17.2.2.4. Recent Developments
- 17.2.2.5. Financials (Based on Availability)
- 17.2.3 Siemens Healthineers AG*List Not Exhaustive
- 17.2.3.1. Overview
- 17.2.3.2. Products
- 17.2.3.3. SWOT Analysis
- 17.2.3.4. Recent Developments
- 17.2.3.5. Financials (Based on Availability)
- 17.2.4 Canon Medical Systems Corporation (Toshiba Corporation)
- 17.2.4.1. Overview
- 17.2.4.2. Products
- 17.2.4.3. SWOT Analysis
- 17.2.4.4. Recent Developments
- 17.2.4.5. Financials (Based on Availability)
- 17.2.5 Carestream Health
- 17.2.5.1. Overview
- 17.2.5.2. Products
- 17.2.5.3. SWOT Analysis
- 17.2.5.4. Recent Developments
- 17.2.5.5. Financials (Based on Availability)
- 17.2.6 Koninklijke Philips NV
- 17.2.6.1. Overview
- 17.2.6.2. Products
- 17.2.6.3. SWOT Analysis
- 17.2.6.4. Recent Developments
- 17.2.6.5. Financials (Based on Availability)
- 17.2.7 Fujifilm Holdings Corporation
- 17.2.7.1. Overview
- 17.2.7.2. Products
- 17.2.7.3. SWOT Analysis
- 17.2.7.4. Recent Developments
- 17.2.7.5. Financials (Based on Availability)
- 17.2.1 GE Healthcare
List of Figures
- Figure 1: Global Computed Tomography Market in South Africa Revenue Breakdown (Million, %) by Region 2024 & 2032
- Figure 2: Africa Computed Tomography Market in South Africa Revenue (Million), by Country 2024 & 2032
- Figure 3: Africa Computed Tomography Market in South Africa Revenue Share (%), by Country 2024 & 2032
- Figure 4: North America Computed Tomography Market in South Africa Revenue (Million), by Type 2024 & 2032
- Figure 5: North America Computed Tomography Market in South Africa Revenue Share (%), by Type 2024 & 2032
- Figure 6: North America Computed Tomography Market in South Africa Revenue (Million), by Application 2024 & 2032
- Figure 7: North America Computed Tomography Market in South Africa Revenue Share (%), by Application 2024 & 2032
- Figure 8: North America Computed Tomography Market in South Africa Revenue (Million), by End User 2024 & 2032
- Figure 9: North America Computed Tomography Market in South Africa Revenue Share (%), by End User 2024 & 2032
- Figure 10: North America Computed Tomography Market in South Africa Revenue (Million), by Country 2024 & 2032
- Figure 11: North America Computed Tomography Market in South Africa Revenue Share (%), by Country 2024 & 2032
- Figure 12: South America Computed Tomography Market in South Africa Revenue (Million), by Type 2024 & 2032
- Figure 13: South America Computed Tomography Market in South Africa Revenue Share (%), by Type 2024 & 2032
- Figure 14: South America Computed Tomography Market in South Africa Revenue (Million), by Application 2024 & 2032
- Figure 15: South America Computed Tomography Market in South Africa Revenue Share (%), by Application 2024 & 2032
- Figure 16: South America Computed Tomography Market in South Africa Revenue (Million), by End User 2024 & 2032
- Figure 17: South America Computed Tomography Market in South Africa Revenue Share (%), by End User 2024 & 2032
- Figure 18: South America Computed Tomography Market in South Africa Revenue (Million), by Country 2024 & 2032
- Figure 19: South America Computed Tomography Market in South Africa Revenue Share (%), by Country 2024 & 2032
- Figure 20: Europe Computed Tomography Market in South Africa Revenue (Million), by Type 2024 & 2032
- Figure 21: Europe Computed Tomography Market in South Africa Revenue Share (%), by Type 2024 & 2032
- Figure 22: Europe Computed Tomography Market in South Africa Revenue (Million), by Application 2024 & 2032
- Figure 23: Europe Computed Tomography Market in South Africa Revenue Share (%), by Application 2024 & 2032
- Figure 24: Europe Computed Tomography Market in South Africa Revenue (Million), by End User 2024 & 2032
- Figure 25: Europe Computed Tomography Market in South Africa Revenue Share (%), by End User 2024 & 2032
- Figure 26: Europe Computed Tomography Market in South Africa Revenue (Million), by Country 2024 & 2032
- Figure 27: Europe Computed Tomography Market in South Africa Revenue Share (%), by Country 2024 & 2032
- Figure 28: Middle East & Africa Computed Tomography Market in South Africa Revenue (Million), by Type 2024 & 2032
- Figure 29: Middle East & Africa Computed Tomography Market in South Africa Revenue Share (%), by Type 2024 & 2032
- Figure 30: Middle East & Africa Computed Tomography Market in South Africa Revenue (Million), by Application 2024 & 2032
- Figure 31: Middle East & Africa Computed Tomography Market in South Africa Revenue Share (%), by Application 2024 & 2032
- Figure 32: Middle East & Africa Computed Tomography Market in South Africa Revenue (Million), by End User 2024 & 2032
- Figure 33: Middle East & Africa Computed Tomography Market in South Africa Revenue Share (%), by End User 2024 & 2032
- Figure 34: Middle East & Africa Computed Tomography Market in South Africa Revenue (Million), by Country 2024 & 2032
- Figure 35: Middle East & Africa Computed Tomography Market in South Africa Revenue Share (%), by Country 2024 & 2032
- Figure 36: Asia Pacific Computed Tomography Market in South Africa Revenue (Million), by Type 2024 & 2032
- Figure 37: Asia Pacific Computed Tomography Market in South Africa Revenue Share (%), by Type 2024 & 2032
- Figure 38: Asia Pacific Computed Tomography Market in South Africa Revenue (Million), by Application 2024 & 2032
- Figure 39: Asia Pacific Computed Tomography Market in South Africa Revenue Share (%), by Application 2024 & 2032
- Figure 40: Asia Pacific Computed Tomography Market in South Africa Revenue (Million), by End User 2024 & 2032
- Figure 41: Asia Pacific Computed Tomography Market in South Africa Revenue Share (%), by End User 2024 & 2032
- Figure 42: Asia Pacific Computed Tomography Market in South Africa Revenue (Million), by Country 2024 & 2032
- Figure 43: Asia Pacific Computed Tomography Market in South Africa Revenue Share (%), by Country 2024 & 2032
List of Tables
- Table 1: Global Computed Tomography Market in South Africa Revenue Million Forecast, by Region 2019 & 2032
- Table 2: Global Computed Tomography Market in South Africa Revenue Million Forecast, by Type 2019 & 2032
- Table 3: Global Computed Tomography Market in South Africa Revenue Million Forecast, by Application 2019 & 2032
- Table 4: Global Computed Tomography Market in South Africa Revenue Million Forecast, by End User 2019 & 2032
- Table 5: Global Computed Tomography Market in South Africa Revenue Million Forecast, by Region 2019 & 2032
- Table 6: Global Computed Tomography Market in South Africa Revenue Million Forecast, by Country 2019 & 2032
- Table 7: South Africa Computed Tomography Market in South Africa Revenue (Million) Forecast, by Application 2019 & 2032
- Table 8: Sudan Computed Tomography Market in South Africa Revenue (Million) Forecast, by Application 2019 & 2032
- Table 9: Uganda Computed Tomography Market in South Africa Revenue (Million) Forecast, by Application 2019 & 2032
- Table 10: Tanzania Computed Tomography Market in South Africa Revenue (Million) Forecast, by Application 2019 & 2032
- Table 11: Kenya Computed Tomography Market in South Africa Revenue (Million) Forecast, by Application 2019 & 2032
- Table 12: Rest of Africa Computed Tomography Market in South Africa Revenue (Million) Forecast, by Application 2019 & 2032
- Table 13: Global Computed Tomography Market in South Africa Revenue Million Forecast, by Type 2019 & 2032
- Table 14: Global Computed Tomography Market in South Africa Revenue Million Forecast, by Application 2019 & 2032
- Table 15: Global Computed Tomography Market in South Africa Revenue Million Forecast, by End User 2019 & 2032
- Table 16: Global Computed Tomography Market in South Africa Revenue Million Forecast, by Country 2019 & 2032
- Table 17: United States Computed Tomography Market in South Africa Revenue (Million) Forecast, by Application 2019 & 2032
- Table 18: Canada Computed Tomography Market in South Africa Revenue (Million) Forecast, by Application 2019 & 2032
- Table 19: Mexico Computed Tomography Market in South Africa Revenue (Million) Forecast, by Application 2019 & 2032
- Table 20: Global Computed Tomography Market in South Africa Revenue Million Forecast, by Type 2019 & 2032
- Table 21: Global Computed Tomography Market in South Africa Revenue Million Forecast, by Application 2019 & 2032
- Table 22: Global Computed Tomography Market in South Africa Revenue Million Forecast, by End User 2019 & 2032
- Table 23: Global Computed Tomography Market in South Africa Revenue Million Forecast, by Country 2019 & 2032
- Table 24: Brazil Computed Tomography Market in South Africa Revenue (Million) Forecast, by Application 2019 & 2032
- Table 25: Argentina Computed Tomography Market in South Africa Revenue (Million) Forecast, by Application 2019 & 2032
- Table 26: Rest of South America Computed Tomography Market in South Africa Revenue (Million) Forecast, by Application 2019 & 2032
- Table 27: Global Computed Tomography Market in South Africa Revenue Million Forecast, by Type 2019 & 2032
- Table 28: Global Computed Tomography Market in South Africa Revenue Million Forecast, by Application 2019 & 2032
- Table 29: Global Computed Tomography Market in South Africa Revenue Million Forecast, by End User 2019 & 2032
- Table 30: Global Computed Tomography Market in South Africa Revenue Million Forecast, by Country 2019 & 2032
- Table 31: United Kingdom Computed Tomography Market in South Africa Revenue (Million) Forecast, by Application 2019 & 2032
- Table 32: Germany Computed Tomography Market in South Africa Revenue (Million) Forecast, by Application 2019 & 2032
- Table 33: France Computed Tomography Market in South Africa Revenue (Million) Forecast, by Application 2019 & 2032
- Table 34: Italy Computed Tomography Market in South Africa Revenue (Million) Forecast, by Application 2019 & 2032
- Table 35: Spain Computed Tomography Market in South Africa Revenue (Million) Forecast, by Application 2019 & 2032
- Table 36: Russia Computed Tomography Market in South Africa Revenue (Million) Forecast, by Application 2019 & 2032
- Table 37: Benelux Computed Tomography Market in South Africa Revenue (Million) Forecast, by Application 2019 & 2032
- Table 38: Nordics Computed Tomography Market in South Africa Revenue (Million) Forecast, by Application 2019 & 2032
- Table 39: Rest of Europe Computed Tomography Market in South Africa Revenue (Million) Forecast, by Application 2019 & 2032
- Table 40: Global Computed Tomography Market in South Africa Revenue Million Forecast, by Type 2019 & 2032
- Table 41: Global Computed Tomography Market in South Africa Revenue Million Forecast, by Application 2019 & 2032
- Table 42: Global Computed Tomography Market in South Africa Revenue Million Forecast, by End User 2019 & 2032
- Table 43: Global Computed Tomography Market in South Africa Revenue Million Forecast, by Country 2019 & 2032
- Table 44: Turkey Computed Tomography Market in South Africa Revenue (Million) Forecast, by Application 2019 & 2032
- Table 45: Israel Computed Tomography Market in South Africa Revenue (Million) Forecast, by Application 2019 & 2032
- Table 46: GCC Computed Tomography Market in South Africa Revenue (Million) Forecast, by Application 2019 & 2032
- Table 47: North Africa Computed Tomography Market in South Africa Revenue (Million) Forecast, by Application 2019 & 2032
- Table 48: South Africa Computed Tomography Market in South Africa Revenue (Million) Forecast, by Application 2019 & 2032
- Table 49: Rest of Middle East & Africa Computed Tomography Market in South Africa Revenue (Million) Forecast, by Application 2019 & 2032
- Table 50: Global Computed Tomography Market in South Africa Revenue Million Forecast, by Type 2019 & 2032
- Table 51: Global Computed Tomography Market in South Africa Revenue Million Forecast, by Application 2019 & 2032
- Table 52: Global Computed Tomography Market in South Africa Revenue Million Forecast, by End User 2019 & 2032
- Table 53: Global Computed Tomography Market in South Africa Revenue Million Forecast, by Country 2019 & 2032
- Table 54: China Computed Tomography Market in South Africa Revenue (Million) Forecast, by Application 2019 & 2032
- Table 55: India Computed Tomography Market in South Africa Revenue (Million) Forecast, by Application 2019 & 2032
- Table 56: Japan Computed Tomography Market in South Africa Revenue (Million) Forecast, by Application 2019 & 2032
- Table 57: South Korea Computed Tomography Market in South Africa Revenue (Million) Forecast, by Application 2019 & 2032
- Table 58: ASEAN Computed Tomography Market in South Africa Revenue (Million) Forecast, by Application 2019 & 2032
- Table 59: Oceania Computed Tomography Market in South Africa Revenue (Million) Forecast, by Application 2019 & 2032
- Table 60: Rest of Asia Pacific Computed Tomography Market in South Africa Revenue (Million) Forecast, by Application 2019 & 2032
Frequently Asked Questions
1. What is the projected Compound Annual Growth Rate (CAGR) of the Computed Tomography Market in South Africa?
The projected CAGR is approximately 6.12%.
2. Which companies are prominent players in the Computed Tomography Market in South Africa?
Key companies in the market include GE Healthcare, Dentsply Sirona, Siemens Healthineers AG*List Not Exhaustive, Canon Medical Systems Corporation (Toshiba Corporation), Carestream Health, Koninklijke Philips NV, Fujifilm Holdings Corporation.
3. What are the main segments of the Computed Tomography Market in South Africa?
The market segments include Type, Application, End User.
4. Can you provide details about the market size?
The market size is estimated to be USD 114.93 Million as of 2022.
5. What are some drivers contributing to market growth?
Increasing Prevalence of Chronic Diseases; Rising Geriatric Population; Increasing Technological Advancements.
6. What are the notable trends driving market growth?
Oncology Segment is Expected to Hold a Significant Market Share Over the Forecast Period.
7. Are there any restraints impacting market growth?
Lack Of Proper Reimbursement And Stringent Regulatory Approval Procedures; High Cost of Equipment.
8. Can you provide examples of recent developments in the market?
In February 2022, in an effort to expand and diversify its portfolio across its southern African operations, Life Healthcare, a healthcare provider in South Africa acquired the non-clinical imaging operations of East Coast Radiology, a radiology practice operating at four of Life Healthcare's Eastern Cape hospitals.
9. What pricing options are available for accessing the report?
Pricing options include single-user, multi-user, and enterprise licenses priced at USD 3800, USD 4500, and USD 5800 respectively.
10. Is the market size provided in terms of value or volume?
The market size is provided in terms of value, measured in Million.
11. Are there any specific market keywords associated with the report?
Yes, the market keyword associated with the report is "Computed Tomography Market in South Africa," which aids in identifying and referencing the specific market segment covered.
12. How do I determine which pricing option suits my needs best?
The pricing options vary based on user requirements and access needs. Individual users may opt for single-user licenses, while businesses requiring broader access may choose multi-user or enterprise licenses for cost-effective access to the report.
13. Are there any additional resources or data provided in the Computed Tomography Market in South Africa report?
While the report offers comprehensive insights, it's advisable to review the specific contents or supplementary materials provided to ascertain if additional resources or data are available.
14. How can I stay updated on further developments or reports in the Computed Tomography Market in South Africa?
To stay informed about further developments, trends, and reports in the Computed Tomography Market in South Africa, consider subscribing to industry newsletters, following relevant companies and organizations, or regularly checking reputable industry news sources and publications.
Methodology
Step 1 - Identification of Relevant Samples Size from Population Database


Step 2 - Approaches for Defining Global Market Size (Value, Volume* & Price*)

Note*: In applicable scenarios
Step 3 - Data Sources
Primary Research
- Web Analytics
- Survey Reports
- Research Institute
- Latest Research Reports
- Opinion Leaders
Secondary Research
- Annual Reports
- White Paper
- Latest Press Release
- Industry Association
- Paid Database
- Investor Presentations

Step 4 - Data Triangulation
Involves using different sources of information in order to increase the validity of a study
These sources are likely to be stakeholders in a program - participants, other researchers, program staff, other community members, and so on.
Then we put all data in single framework & apply various statistical tools to find out the dynamic on the market.
During the analysis stage, feedback from the stakeholder groups would be compared to determine areas of agreement as well as areas of divergence
