

Key Insights
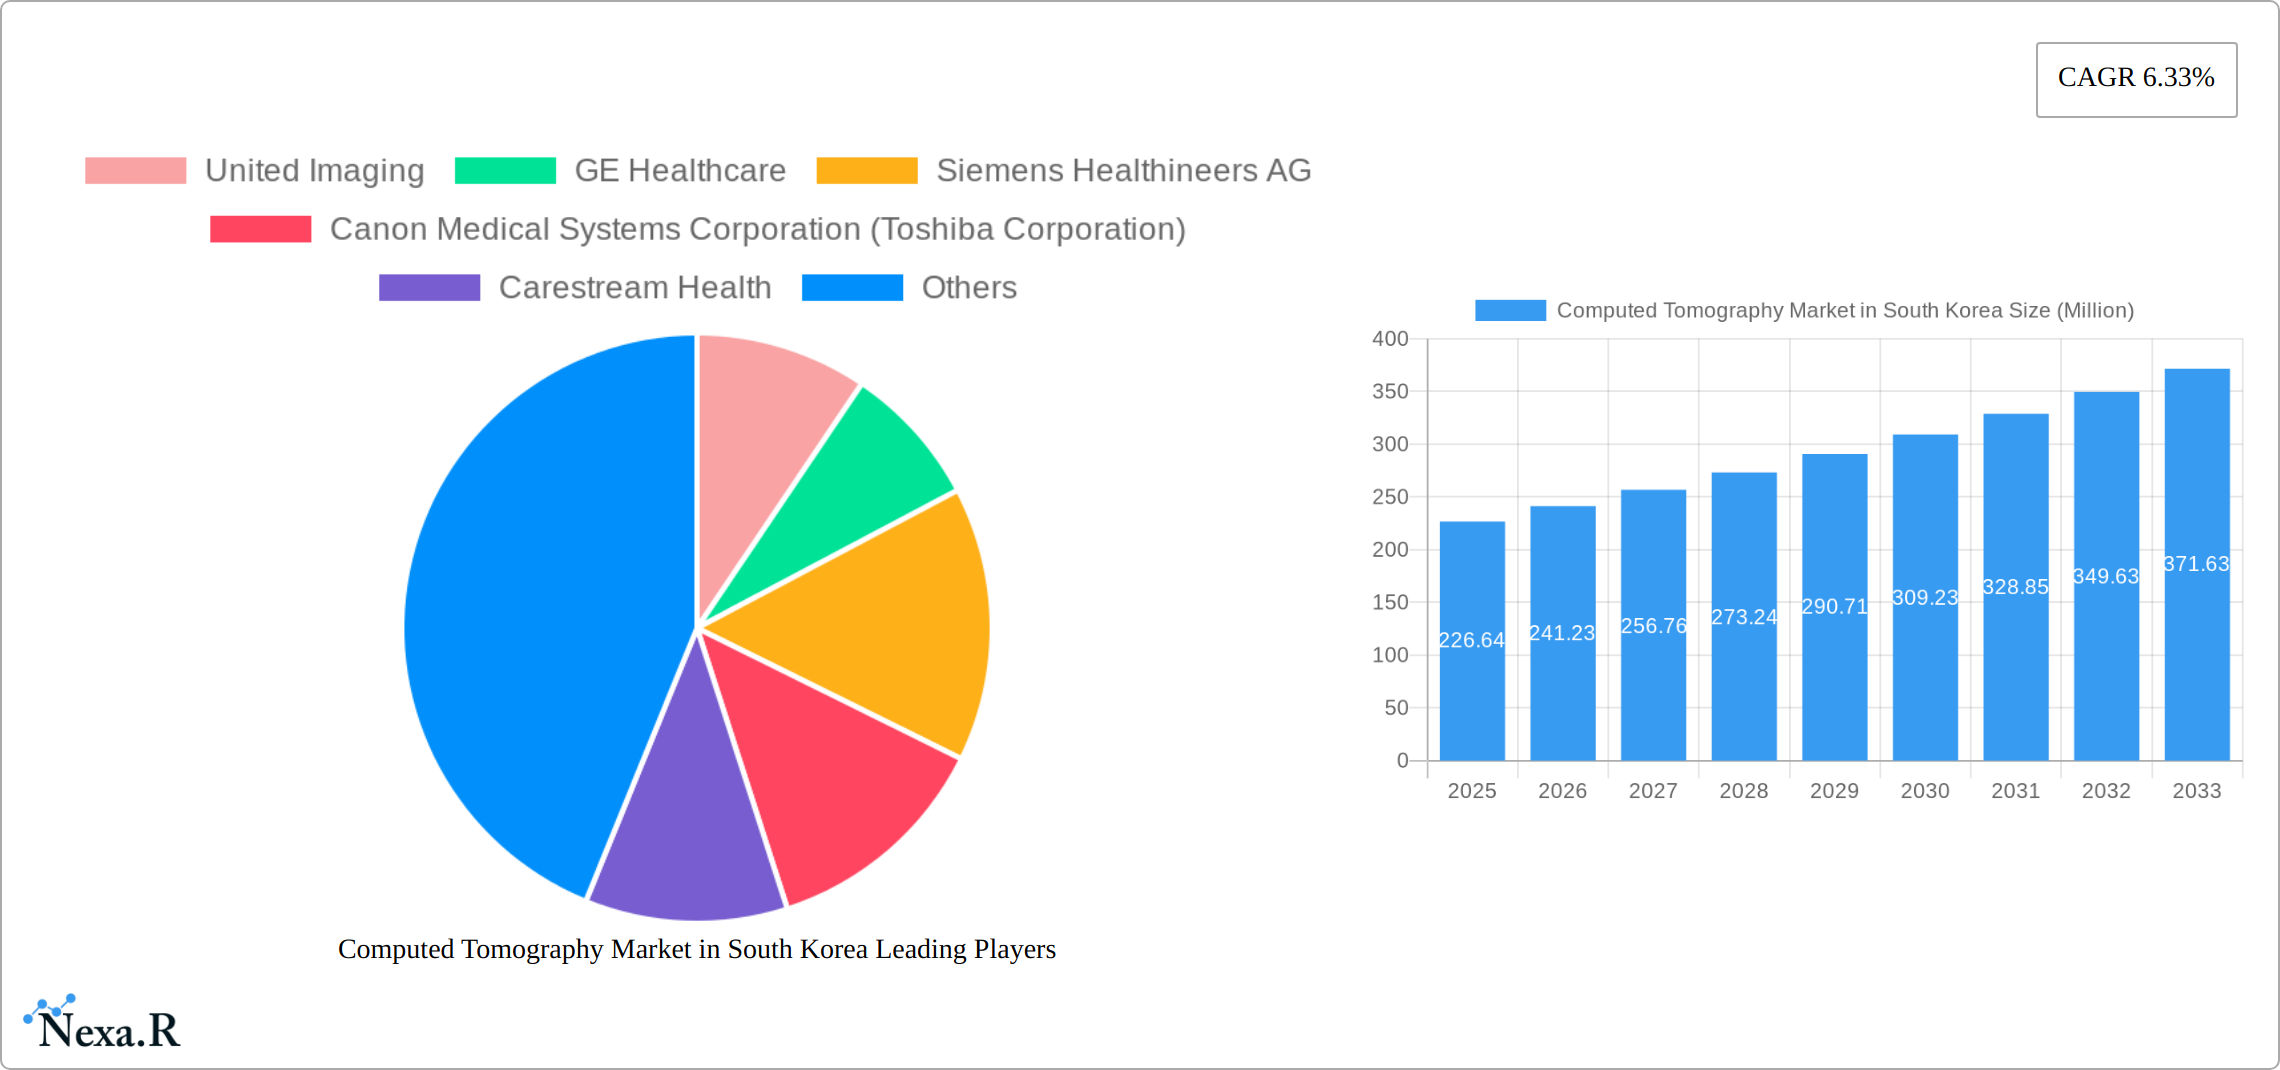
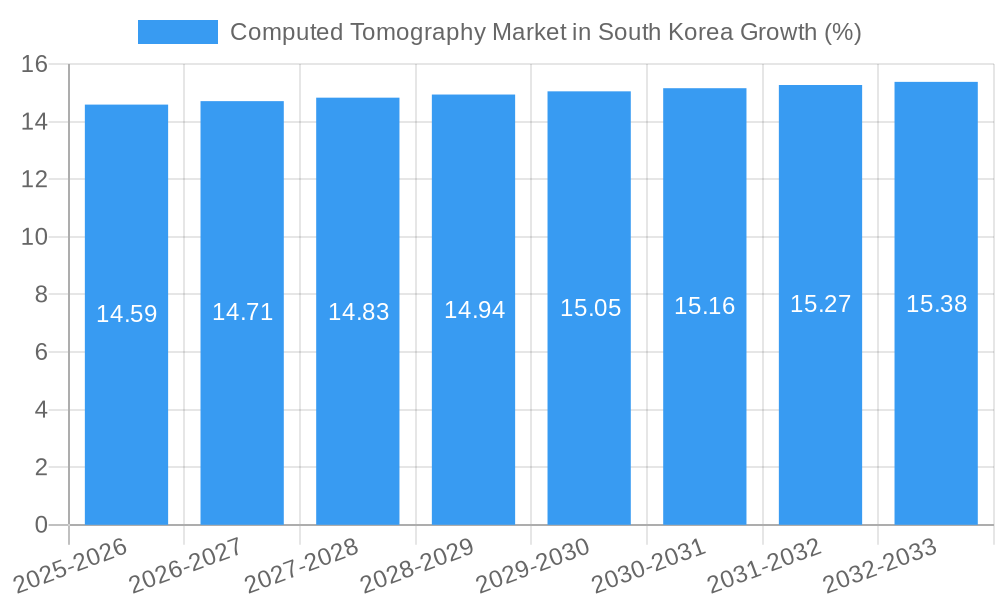
The South Korean computed tomography (CT) market, valued at $226.64 million in 2025, is projected to experience robust growth, driven by a rising elderly population necessitating increased diagnostic imaging, advancements in CT technology offering improved image quality and faster scan times, and a growing prevalence of chronic diseases like cancer and cardiovascular ailments requiring frequent CT scans. The market's expansion is further fueled by increasing government initiatives promoting healthcare infrastructure development and the adoption of advanced medical technologies. While factors like high equipment costs and stringent regulatory approvals can pose challenges, the overall market outlook remains positive, with a projected Compound Annual Growth Rate (CAGR) of 6.33% from 2025 to 2033. The market is segmented by type (low, medium, and high slice CT scanners), application (oncology, neurology, cardiovascular, musculoskeletal, and other applications), and end-user (hospitals, diagnostic centers, and other end-users). Hospitals currently hold the largest market share, reflecting the crucial role of CT in inpatient diagnostics. Key players like United Imaging, GE Healthcare, Siemens Healthineers, Canon Medical Systems, Carestream Health, Philips, and Planmeca are actively shaping the market through technological innovations and strategic partnerships.
The high-slice CT segment is expected to witness the fastest growth, driven by its superior image quality and ability to perform complex scans. Oncology remains a dominant application segment, reflecting the critical role of CT in cancer diagnosis and treatment planning. Looking ahead, the integration of artificial intelligence (AI) in CT imaging is poised to revolutionize the field by improving diagnostic accuracy and efficiency. This market segment is ripe for growth from private investment, government grants, and healthcare technology innovation. Continued expansion will hinge on the successful navigation of regulatory hurdles, strategic collaborations, and sustained investment in technological advancements. The market’s dynamic nature presents opportunities for both established players and emerging companies to capitalize on the growing demand for advanced imaging solutions in South Korea.
Computed Tomography Market in South Korea: A Comprehensive Report (2019-2033)
This in-depth report provides a comprehensive analysis of the Computed Tomography (CT) market in South Korea, encompassing market dynamics, growth trends, regional segmentation, product landscape, key drivers and barriers, emerging opportunities, and key players. The report covers the period 2019-2033, with a focus on the base year 2025 and a forecast period of 2025-2033. The South Korean CT market, a crucial sub-segment of the broader Asia-Pacific medical imaging equipment market, offers valuable insights into the evolving healthcare landscape. This report is essential for industry professionals, investors, and strategic decision-makers seeking a detailed understanding of this dynamic market. Market values are presented in million units.
Computed Tomography Market in South Korea Market Dynamics & Structure
The South Korean CT market is characterized by a moderately concentrated landscape, with major international players dominating alongside a few domestic providers. Technological innovation, driven by advancements in image quality, speed, and radiation dose reduction, is a key market driver. Stringent regulatory frameworks, aligned with global standards, ensure the safety and efficacy of CT devices. The market faces competition from alternative imaging modalities like MRI and ultrasound, but CT's strengths in speed and versatility maintain its position. End-user demographics show a growing elderly population requiring increased diagnostic imaging, bolstering market demand. The M&A activity has been relatively low in recent years, with a predicted xx deals in the forecast period, reflecting a stable but competitive environment.
- Market Concentration: Moderately concentrated, with top 5 players holding approximately xx% market share in 2025.
- Technological Innovation: Focus on multi-slice CT, AI-powered image analysis, and dose reduction technologies.
- Regulatory Framework: Stringent regulations ensure quality and safety, aligning with international standards (e.g., those from the Ministry of Food and Drug Safety).
- Competitive Substitutes: MRI, ultrasound, and other advanced imaging techniques.
- End-User Demographics: Aging population and rising prevalence of chronic diseases drive demand.
- M&A Trends: Relatively low M&A activity, with a predicted xx deals in the forecast period.
Computed Tomography Market in South Korea Growth Trends & Insights
The South Korean CT market experienced robust growth during the historical period (2019-2024), with a CAGR of xx%. This growth is attributed to increased healthcare spending, rising prevalence of chronic diseases, technological advancements, and government initiatives to improve healthcare infrastructure. Market penetration in hospitals and diagnostic centers remains high, with ongoing growth potential in other end-user segments. Technological disruptions, such as the integration of AI and improved image reconstruction techniques, are driving adoption rates and enhancing diagnostic capabilities. Shifts in consumer behavior, including increased demand for faster and more precise diagnostic solutions, further contribute to market expansion. The forecast period (2025-2033) projects a CAGR of xx%, with the market size expected to reach xx million units by 2033.
Dominant Regions, Countries, or Segments in Computed Tomography Market in South Korea
Seoul and other major metropolitan areas in South Korea significantly dominate the Computed Tomography (CT) market. This dominance stems from a high concentration of hospitals and diagnostic centers, coupled with a relatively high prevalence of chronic diseases requiring advanced imaging. The high-slice CT segment exhibits the most rapid growth, reflecting the increasing demand for sophisticated imaging capabilities. Within applications, Oncology and Cardiovascular applications command the largest market share, driven by the substantial prevalence of related diseases. Hospitals currently represent the largest end-user segment; however, diagnostic imaging centers are projected to experience considerable growth throughout the forecast period. This growth is further fueled by the increasing adoption of outpatient diagnostic services and a government push towards preventative healthcare measures.
- Key Drivers:
- High concentration of healthcare facilities and specialists in major urban centers.
- Rising prevalence of cancer, cardiovascular diseases, and other chronic conditions necessitating advanced diagnostic imaging.
- Government initiatives and investments in modernizing healthcare infrastructure and promoting preventative healthcare.
- Increasing demand for faster, higher-resolution imaging with reduced radiation exposure.
- Growing adoption of AI-powered image analysis for improved diagnostic accuracy and efficiency.
- Dominant Segments:
- Type: High-slice CT scanners, with a notable increase in Multi-detector CT (MDCT) and Dual-energy CT (DECT) systems.
- Application: Oncology, Cardiovascular, Neurology, and Trauma, reflecting the diverse clinical needs of the South Korean healthcare system.
- End User: Hospitals, followed by rapidly growing diagnostic imaging centers and specialized clinics.
Computed Tomography Market in South Korea Product Landscape
The South Korean CT market showcases a diverse range of products, encompassing low-slice to high-slice systems designed to meet various clinical requirements. Recent innovations prioritize enhanced image quality, reduced radiation doses, and the integration of Artificial Intelligence (AI) for automated image analysis and improved diagnostic workflows. Key product features driving market adoption include advanced reconstruction algorithms, cutting-edge detector technology, and significantly faster scan times that minimize patient discomfort and improve throughput. The market is witnessing a strong trend towards the adoption of multi-detector CT (MDCT) and dual-energy CT (DECT) systems, enabling detailed anatomical and functional information for more precise diagnoses and treatment planning. The integration of cloud-based solutions for image storage and remote access further enhances efficiency and connectivity across healthcare facilities.
Key Drivers, Barriers & Challenges in Computed Tomography Market in South Korea
Key Drivers: Technological advancements like AI integration, increased healthcare spending, government initiatives promoting healthcare infrastructure development, and the rising prevalence of chronic diseases drive market growth.
Key Challenges: High initial investment costs for advanced CT systems, limited reimbursement policies for certain procedures, competition from alternative imaging modalities, and potential supply chain disruptions represent significant hurdles.
Emerging Opportunities in Computed Tomography Market in South Korea
Significant emerging opportunities exist within the South Korean CT market. These include the expansion of CT services into smaller hospitals and clinics located in rural areas, leading to enhanced access to advanced diagnostic imaging across the country. The development of specialized CT applications tailored to specific diseases, such as advanced applications for oncology and cardiovascular disease, will also drive growth. The integration of telemedicine for remote diagnostics promises improved access to specialist expertise, particularly beneficial in geographically dispersed regions. The rising demand for minimally invasive procedures and the increasing adoption of AI and cloud computing technologies provide further avenues for substantial market expansion. A focus on preventative healthcare initiatives and early detection programs also presents opportunities for increased CT utilization.
Growth Accelerators in the Computed Tomography Market in South Korea Industry
Long-term growth will be fueled by technological innovations in image reconstruction and AI-powered diagnostics, as well as strategic partnerships between manufacturers and healthcare providers. Government initiatives supporting healthcare infrastructure and increasing access to diagnostic imaging will play a significant role in market expansion.
Key Players Shaping the Computed Tomography Market in South Korea Market
- United Imaging
- GE Healthcare
- Siemens Healthineers AG
- Canon Medical Systems Corporation (Toshiba Corporation)
- Carestream Health
- Koninklijke Philips NV
- Planmeca Group (Planmed OY)
Notable Milestones in Computed Tomography Market in South Korea Sector
- March 2022: Philips Korea unveils Greeting CT Premium at KIMES2022.
- January 2022: Bayer AG's MEDRAD Centargo receives approval from the South Korean Ministry of Food and Drug Safety.
In-Depth Computed Tomography Market in South Korea Market Outlook
The South Korean CT market is projected to experience sustained growth, driven by several key factors. These include continuous technological advancements leading to more sophisticated and efficient CT systems, a rising healthcare expenditure reflecting government investment and growing awareness of the importance of preventative healthcare, and an aging population with a higher prevalence of chronic diseases. Strategic partnerships that focus on delivering comprehensive imaging solutions incorporating AI-driven diagnostics and image analysis will be crucial for success within this competitive market. The market offers significant opportunities for established players to expand their market share and for new entrants to capitalize on the growing demand for high-quality, technologically advanced imaging technologies within the dynamic South Korean healthcare landscape.
Computed Tomography Market in South Korea Segmentation
-
1. Type
- 1.1. Low Slice
- 1.2. Medium Slice
- 1.3. High Slice
-
2. Application
- 2.1. Oncology
- 2.2. Neurology
- 2.3. Cardiovascular
- 2.4. Musculoskeletal
- 2.5. Other Applications
-
3. End User
- 3.1. Hospitals
- 3.2. Diagnostic Centers
- 3.3. Other End Users
Computed Tomography Market in South Korea Segmentation By Geography
-
1. North America
- 1.1. United States
- 1.2. Canada
- 1.3. Mexico
-
2. South America
- 2.1. Brazil
- 2.2. Argentina
- 2.3. Rest of South America
-
3. Europe
- 3.1. United Kingdom
- 3.2. Germany
- 3.3. France
- 3.4. Italy
- 3.5. Spain
- 3.6. Russia
- 3.7. Benelux
- 3.8. Nordics
- 3.9. Rest of Europe
-
4. Middle East & Africa
- 4.1. Turkey
- 4.2. Israel
- 4.3. GCC
- 4.4. North Africa
- 4.5. South Africa
- 4.6. Rest of Middle East & Africa
-
5. Asia Pacific
- 5.1. China
- 5.2. India
- 5.3. Japan
- 5.4. South Korea
- 5.5. ASEAN
- 5.6. Oceania
- 5.7. Rest of Asia Pacific
Computed Tomography Market in South Korea REPORT HIGHLIGHTS
| Aspects | Details |
|---|---|
| Study Period | 2019-2033 |
| Base Year | 2024 |
| Estimated Year | 2025 |
| Forecast Period | 2025-2033 |
| Historical Period | 2019-2024 |
| Growth Rate | CAGR of 6.33% from 2019-2033 |
| Segmentation |
|
Table of Contents
- 1. Introduction
- 1.1. Research Scope
- 1.2. Market Segmentation
- 1.3. Research Methodology
- 1.4. Definitions and Assumptions
- 2. Executive Summary
- 2.1. Introduction
- 3. Market Dynamics
- 3.1. Introduction
- 3.2. Market Drivers
- 3.2.1. Increasing Prevalence of Chronic Diseases; Rising Geriatric Population; Increasing Technological Advancements
- 3.3. Market Restrains
- 3.3.1. Lack Of Proper Reimbursement And Stringent Regulatory Approval Procedures; High Cost of Equipment
- 3.4. Market Trends
- 3.4.1. Oncology Segment is Expected to Hold a Significant Market Share Over the Forecast Period
- 4. Market Factor Analysis
- 4.1. Porters Five Forces
- 4.2. Supply/Value Chain
- 4.3. PESTEL analysis
- 4.4. Market Entropy
- 4.5. Patent/Trademark Analysis
- 5. Global Computed Tomography Market in South Korea Analysis, Insights and Forecast, 2019-2031
- 5.1. Market Analysis, Insights and Forecast - by Type
- 5.1.1. Low Slice
- 5.1.2. Medium Slice
- 5.1.3. High Slice
- 5.2. Market Analysis, Insights and Forecast - by Application
- 5.2.1. Oncology
- 5.2.2. Neurology
- 5.2.3. Cardiovascular
- 5.2.4. Musculoskeletal
- 5.2.5. Other Applications
- 5.3. Market Analysis, Insights and Forecast - by End User
- 5.3.1. Hospitals
- 5.3.2. Diagnostic Centers
- 5.3.3. Other End Users
- 5.4. Market Analysis, Insights and Forecast - by Region
- 5.4.1. North America
- 5.4.2. South America
- 5.4.3. Europe
- 5.4.4. Middle East & Africa
- 5.4.5. Asia Pacific
- 5.1. Market Analysis, Insights and Forecast - by Type
- 6. North America Computed Tomography Market in South Korea Analysis, Insights and Forecast, 2019-2031
- 6.1. Market Analysis, Insights and Forecast - by Type
- 6.1.1. Low Slice
- 6.1.2. Medium Slice
- 6.1.3. High Slice
- 6.2. Market Analysis, Insights and Forecast - by Application
- 6.2.1. Oncology
- 6.2.2. Neurology
- 6.2.3. Cardiovascular
- 6.2.4. Musculoskeletal
- 6.2.5. Other Applications
- 6.3. Market Analysis, Insights and Forecast - by End User
- 6.3.1. Hospitals
- 6.3.2. Diagnostic Centers
- 6.3.3. Other End Users
- 6.1. Market Analysis, Insights and Forecast - by Type
- 7. South America Computed Tomography Market in South Korea Analysis, Insights and Forecast, 2019-2031
- 7.1. Market Analysis, Insights and Forecast - by Type
- 7.1.1. Low Slice
- 7.1.2. Medium Slice
- 7.1.3. High Slice
- 7.2. Market Analysis, Insights and Forecast - by Application
- 7.2.1. Oncology
- 7.2.2. Neurology
- 7.2.3. Cardiovascular
- 7.2.4. Musculoskeletal
- 7.2.5. Other Applications
- 7.3. Market Analysis, Insights and Forecast - by End User
- 7.3.1. Hospitals
- 7.3.2. Diagnostic Centers
- 7.3.3. Other End Users
- 7.1. Market Analysis, Insights and Forecast - by Type
- 8. Europe Computed Tomography Market in South Korea Analysis, Insights and Forecast, 2019-2031
- 8.1. Market Analysis, Insights and Forecast - by Type
- 8.1.1. Low Slice
- 8.1.2. Medium Slice
- 8.1.3. High Slice
- 8.2. Market Analysis, Insights and Forecast - by Application
- 8.2.1. Oncology
- 8.2.2. Neurology
- 8.2.3. Cardiovascular
- 8.2.4. Musculoskeletal
- 8.2.5. Other Applications
- 8.3. Market Analysis, Insights and Forecast - by End User
- 8.3.1. Hospitals
- 8.3.2. Diagnostic Centers
- 8.3.3. Other End Users
- 8.1. Market Analysis, Insights and Forecast - by Type
- 9. Middle East & Africa Computed Tomography Market in South Korea Analysis, Insights and Forecast, 2019-2031
- 9.1. Market Analysis, Insights and Forecast - by Type
- 9.1.1. Low Slice
- 9.1.2. Medium Slice
- 9.1.3. High Slice
- 9.2. Market Analysis, Insights and Forecast - by Application
- 9.2.1. Oncology
- 9.2.2. Neurology
- 9.2.3. Cardiovascular
- 9.2.4. Musculoskeletal
- 9.2.5. Other Applications
- 9.3. Market Analysis, Insights and Forecast - by End User
- 9.3.1. Hospitals
- 9.3.2. Diagnostic Centers
- 9.3.3. Other End Users
- 9.1. Market Analysis, Insights and Forecast - by Type
- 10. Asia Pacific Computed Tomography Market in South Korea Analysis, Insights and Forecast, 2019-2031
- 10.1. Market Analysis, Insights and Forecast - by Type
- 10.1.1. Low Slice
- 10.1.2. Medium Slice
- 10.1.3. High Slice
- 10.2. Market Analysis, Insights and Forecast - by Application
- 10.2.1. Oncology
- 10.2.2. Neurology
- 10.2.3. Cardiovascular
- 10.2.4. Musculoskeletal
- 10.2.5. Other Applications
- 10.3. Market Analysis, Insights and Forecast - by End User
- 10.3.1. Hospitals
- 10.3.2. Diagnostic Centers
- 10.3.3. Other End Users
- 10.1. Market Analysis, Insights and Forecast - by Type
- 11. Competitive Analysis
- 11.1. Global Market Share Analysis 2024
- 11.2. Company Profiles
- 11.2.1 United Imaging
- 11.2.1.1. Overview
- 11.2.1.2. Products
- 11.2.1.3. SWOT Analysis
- 11.2.1.4. Recent Developments
- 11.2.1.5. Financials (Based on Availability)
- 11.2.2 GE Healthcare
- 11.2.2.1. Overview
- 11.2.2.2. Products
- 11.2.2.3. SWOT Analysis
- 11.2.2.4. Recent Developments
- 11.2.2.5. Financials (Based on Availability)
- 11.2.3 Siemens Healthineers AG
- 11.2.3.1. Overview
- 11.2.3.2. Products
- 11.2.3.3. SWOT Analysis
- 11.2.3.4. Recent Developments
- 11.2.3.5. Financials (Based on Availability)
- 11.2.4 Canon Medical Systems Corporation (Toshiba Corporation)
- 11.2.4.1. Overview
- 11.2.4.2. Products
- 11.2.4.3. SWOT Analysis
- 11.2.4.4. Recent Developments
- 11.2.4.5. Financials (Based on Availability)
- 11.2.5 Carestream Health
- 11.2.5.1. Overview
- 11.2.5.2. Products
- 11.2.5.3. SWOT Analysis
- 11.2.5.4. Recent Developments
- 11.2.5.5. Financials (Based on Availability)
- 11.2.6 Koninklijke Philips NV
- 11.2.6.1. Overview
- 11.2.6.2. Products
- 11.2.6.3. SWOT Analysis
- 11.2.6.4. Recent Developments
- 11.2.6.5. Financials (Based on Availability)
- 11.2.7 Planmeca Group (Planmed OY)
- 11.2.7.1. Overview
- 11.2.7.2. Products
- 11.2.7.3. SWOT Analysis
- 11.2.7.4. Recent Developments
- 11.2.7.5. Financials (Based on Availability)
- 11.2.1 United Imaging
List of Figures
- Figure 1: Global Computed Tomography Market in South Korea Revenue Breakdown (Million, %) by Region 2024 & 2032
- Figure 2: South Korea Computed Tomography Market in South Korea Revenue (Million), by Country 2024 & 2032
- Figure 3: South Korea Computed Tomography Market in South Korea Revenue Share (%), by Country 2024 & 2032
- Figure 4: North America Computed Tomography Market in South Korea Revenue (Million), by Type 2024 & 2032
- Figure 5: North America Computed Tomography Market in South Korea Revenue Share (%), by Type 2024 & 2032
- Figure 6: North America Computed Tomography Market in South Korea Revenue (Million), by Application 2024 & 2032
- Figure 7: North America Computed Tomography Market in South Korea Revenue Share (%), by Application 2024 & 2032
- Figure 8: North America Computed Tomography Market in South Korea Revenue (Million), by End User 2024 & 2032
- Figure 9: North America Computed Tomography Market in South Korea Revenue Share (%), by End User 2024 & 2032
- Figure 10: North America Computed Tomography Market in South Korea Revenue (Million), by Country 2024 & 2032
- Figure 11: North America Computed Tomography Market in South Korea Revenue Share (%), by Country 2024 & 2032
- Figure 12: South America Computed Tomography Market in South Korea Revenue (Million), by Type 2024 & 2032
- Figure 13: South America Computed Tomography Market in South Korea Revenue Share (%), by Type 2024 & 2032
- Figure 14: South America Computed Tomography Market in South Korea Revenue (Million), by Application 2024 & 2032
- Figure 15: South America Computed Tomography Market in South Korea Revenue Share (%), by Application 2024 & 2032
- Figure 16: South America Computed Tomography Market in South Korea Revenue (Million), by End User 2024 & 2032
- Figure 17: South America Computed Tomography Market in South Korea Revenue Share (%), by End User 2024 & 2032
- Figure 18: South America Computed Tomography Market in South Korea Revenue (Million), by Country 2024 & 2032
- Figure 19: South America Computed Tomography Market in South Korea Revenue Share (%), by Country 2024 & 2032
- Figure 20: Europe Computed Tomography Market in South Korea Revenue (Million), by Type 2024 & 2032
- Figure 21: Europe Computed Tomography Market in South Korea Revenue Share (%), by Type 2024 & 2032
- Figure 22: Europe Computed Tomography Market in South Korea Revenue (Million), by Application 2024 & 2032
- Figure 23: Europe Computed Tomography Market in South Korea Revenue Share (%), by Application 2024 & 2032
- Figure 24: Europe Computed Tomography Market in South Korea Revenue (Million), by End User 2024 & 2032
- Figure 25: Europe Computed Tomography Market in South Korea Revenue Share (%), by End User 2024 & 2032
- Figure 26: Europe Computed Tomography Market in South Korea Revenue (Million), by Country 2024 & 2032
- Figure 27: Europe Computed Tomography Market in South Korea Revenue Share (%), by Country 2024 & 2032
- Figure 28: Middle East & Africa Computed Tomography Market in South Korea Revenue (Million), by Type 2024 & 2032
- Figure 29: Middle East & Africa Computed Tomography Market in South Korea Revenue Share (%), by Type 2024 & 2032
- Figure 30: Middle East & Africa Computed Tomography Market in South Korea Revenue (Million), by Application 2024 & 2032
- Figure 31: Middle East & Africa Computed Tomography Market in South Korea Revenue Share (%), by Application 2024 & 2032
- Figure 32: Middle East & Africa Computed Tomography Market in South Korea Revenue (Million), by End User 2024 & 2032
- Figure 33: Middle East & Africa Computed Tomography Market in South Korea Revenue Share (%), by End User 2024 & 2032
- Figure 34: Middle East & Africa Computed Tomography Market in South Korea Revenue (Million), by Country 2024 & 2032
- Figure 35: Middle East & Africa Computed Tomography Market in South Korea Revenue Share (%), by Country 2024 & 2032
- Figure 36: Asia Pacific Computed Tomography Market in South Korea Revenue (Million), by Type 2024 & 2032
- Figure 37: Asia Pacific Computed Tomography Market in South Korea Revenue Share (%), by Type 2024 & 2032
- Figure 38: Asia Pacific Computed Tomography Market in South Korea Revenue (Million), by Application 2024 & 2032
- Figure 39: Asia Pacific Computed Tomography Market in South Korea Revenue Share (%), by Application 2024 & 2032
- Figure 40: Asia Pacific Computed Tomography Market in South Korea Revenue (Million), by End User 2024 & 2032
- Figure 41: Asia Pacific Computed Tomography Market in South Korea Revenue Share (%), by End User 2024 & 2032
- Figure 42: Asia Pacific Computed Tomography Market in South Korea Revenue (Million), by Country 2024 & 2032
- Figure 43: Asia Pacific Computed Tomography Market in South Korea Revenue Share (%), by Country 2024 & 2032
List of Tables
- Table 1: Global Computed Tomography Market in South Korea Revenue Million Forecast, by Region 2019 & 2032
- Table 2: Global Computed Tomography Market in South Korea Revenue Million Forecast, by Type 2019 & 2032
- Table 3: Global Computed Tomography Market in South Korea Revenue Million Forecast, by Application 2019 & 2032
- Table 4: Global Computed Tomography Market in South Korea Revenue Million Forecast, by End User 2019 & 2032
- Table 5: Global Computed Tomography Market in South Korea Revenue Million Forecast, by Region 2019 & 2032
- Table 6: Global Computed Tomography Market in South Korea Revenue Million Forecast, by Country 2019 & 2032
- Table 7: Global Computed Tomography Market in South Korea Revenue Million Forecast, by Type 2019 & 2032
- Table 8: Global Computed Tomography Market in South Korea Revenue Million Forecast, by Application 2019 & 2032
- Table 9: Global Computed Tomography Market in South Korea Revenue Million Forecast, by End User 2019 & 2032
- Table 10: Global Computed Tomography Market in South Korea Revenue Million Forecast, by Country 2019 & 2032
- Table 11: United States Computed Tomography Market in South Korea Revenue (Million) Forecast, by Application 2019 & 2032
- Table 12: Canada Computed Tomography Market in South Korea Revenue (Million) Forecast, by Application 2019 & 2032
- Table 13: Mexico Computed Tomography Market in South Korea Revenue (Million) Forecast, by Application 2019 & 2032
- Table 14: Global Computed Tomography Market in South Korea Revenue Million Forecast, by Type 2019 & 2032
- Table 15: Global Computed Tomography Market in South Korea Revenue Million Forecast, by Application 2019 & 2032
- Table 16: Global Computed Tomography Market in South Korea Revenue Million Forecast, by End User 2019 & 2032
- Table 17: Global Computed Tomography Market in South Korea Revenue Million Forecast, by Country 2019 & 2032
- Table 18: Brazil Computed Tomography Market in South Korea Revenue (Million) Forecast, by Application 2019 & 2032
- Table 19: Argentina Computed Tomography Market in South Korea Revenue (Million) Forecast, by Application 2019 & 2032
- Table 20: Rest of South America Computed Tomography Market in South Korea Revenue (Million) Forecast, by Application 2019 & 2032
- Table 21: Global Computed Tomography Market in South Korea Revenue Million Forecast, by Type 2019 & 2032
- Table 22: Global Computed Tomography Market in South Korea Revenue Million Forecast, by Application 2019 & 2032
- Table 23: Global Computed Tomography Market in South Korea Revenue Million Forecast, by End User 2019 & 2032
- Table 24: Global Computed Tomography Market in South Korea Revenue Million Forecast, by Country 2019 & 2032
- Table 25: United Kingdom Computed Tomography Market in South Korea Revenue (Million) Forecast, by Application 2019 & 2032
- Table 26: Germany Computed Tomography Market in South Korea Revenue (Million) Forecast, by Application 2019 & 2032
- Table 27: France Computed Tomography Market in South Korea Revenue (Million) Forecast, by Application 2019 & 2032
- Table 28: Italy Computed Tomography Market in South Korea Revenue (Million) Forecast, by Application 2019 & 2032
- Table 29: Spain Computed Tomography Market in South Korea Revenue (Million) Forecast, by Application 2019 & 2032
- Table 30: Russia Computed Tomography Market in South Korea Revenue (Million) Forecast, by Application 2019 & 2032
- Table 31: Benelux Computed Tomography Market in South Korea Revenue (Million) Forecast, by Application 2019 & 2032
- Table 32: Nordics Computed Tomography Market in South Korea Revenue (Million) Forecast, by Application 2019 & 2032
- Table 33: Rest of Europe Computed Tomography Market in South Korea Revenue (Million) Forecast, by Application 2019 & 2032
- Table 34: Global Computed Tomography Market in South Korea Revenue Million Forecast, by Type 2019 & 2032
- Table 35: Global Computed Tomography Market in South Korea Revenue Million Forecast, by Application 2019 & 2032
- Table 36: Global Computed Tomography Market in South Korea Revenue Million Forecast, by End User 2019 & 2032
- Table 37: Global Computed Tomography Market in South Korea Revenue Million Forecast, by Country 2019 & 2032
- Table 38: Turkey Computed Tomography Market in South Korea Revenue (Million) Forecast, by Application 2019 & 2032
- Table 39: Israel Computed Tomography Market in South Korea Revenue (Million) Forecast, by Application 2019 & 2032
- Table 40: GCC Computed Tomography Market in South Korea Revenue (Million) Forecast, by Application 2019 & 2032
- Table 41: North Africa Computed Tomography Market in South Korea Revenue (Million) Forecast, by Application 2019 & 2032
- Table 42: South Africa Computed Tomography Market in South Korea Revenue (Million) Forecast, by Application 2019 & 2032
- Table 43: Rest of Middle East & Africa Computed Tomography Market in South Korea Revenue (Million) Forecast, by Application 2019 & 2032
- Table 44: Global Computed Tomography Market in South Korea Revenue Million Forecast, by Type 2019 & 2032
- Table 45: Global Computed Tomography Market in South Korea Revenue Million Forecast, by Application 2019 & 2032
- Table 46: Global Computed Tomography Market in South Korea Revenue Million Forecast, by End User 2019 & 2032
- Table 47: Global Computed Tomography Market in South Korea Revenue Million Forecast, by Country 2019 & 2032
- Table 48: China Computed Tomography Market in South Korea Revenue (Million) Forecast, by Application 2019 & 2032
- Table 49: India Computed Tomography Market in South Korea Revenue (Million) Forecast, by Application 2019 & 2032
- Table 50: Japan Computed Tomography Market in South Korea Revenue (Million) Forecast, by Application 2019 & 2032
- Table 51: South Korea Computed Tomography Market in South Korea Revenue (Million) Forecast, by Application 2019 & 2032
- Table 52: ASEAN Computed Tomography Market in South Korea Revenue (Million) Forecast, by Application 2019 & 2032
- Table 53: Oceania Computed Tomography Market in South Korea Revenue (Million) Forecast, by Application 2019 & 2032
- Table 54: Rest of Asia Pacific Computed Tomography Market in South Korea Revenue (Million) Forecast, by Application 2019 & 2032
Frequently Asked Questions
1. What is the projected Compound Annual Growth Rate (CAGR) of the Computed Tomography Market in South Korea?
The projected CAGR is approximately 6.33%.
2. Which companies are prominent players in the Computed Tomography Market in South Korea?
Key companies in the market include United Imaging, GE Healthcare, Siemens Healthineers AG, Canon Medical Systems Corporation (Toshiba Corporation), Carestream Health, Koninklijke Philips NV, Planmeca Group (Planmed OY).
3. What are the main segments of the Computed Tomography Market in South Korea?
The market segments include Type, Application, End User.
4. Can you provide details about the market size?
The market size is estimated to be USD 226.64 Million as of 2022.
5. What are some drivers contributing to market growth?
Increasing Prevalence of Chronic Diseases; Rising Geriatric Population; Increasing Technological Advancements.
6. What are the notable trends driving market growth?
Oncology Segment is Expected to Hold a Significant Market Share Over the Forecast Period.
7. Are there any restraints impacting market growth?
Lack Of Proper Reimbursement And Stringent Regulatory Approval Procedures; High Cost of Equipment.
8. Can you provide examples of recent developments in the market?
In March 2022, Philips Korea unveiled Greeting CT Premium at 37th Korea International Medical & Hospital Equipment Show (KIMES2022) held at Samsung-dong COEX in Seoul.
9. What pricing options are available for accessing the report?
Pricing options include single-user, multi-user, and enterprise licenses priced at USD 3800, USD 4500, and USD 5800 respectively.
10. Is the market size provided in terms of value or volume?
The market size is provided in terms of value, measured in Million.
11. Are there any specific market keywords associated with the report?
Yes, the market keyword associated with the report is "Computed Tomography Market in South Korea," which aids in identifying and referencing the specific market segment covered.
12. How do I determine which pricing option suits my needs best?
The pricing options vary based on user requirements and access needs. Individual users may opt for single-user licenses, while businesses requiring broader access may choose multi-user or enterprise licenses for cost-effective access to the report.
13. Are there any additional resources or data provided in the Computed Tomography Market in South Korea report?
While the report offers comprehensive insights, it's advisable to review the specific contents or supplementary materials provided to ascertain if additional resources or data are available.
14. How can I stay updated on further developments or reports in the Computed Tomography Market in South Korea?
To stay informed about further developments, trends, and reports in the Computed Tomography Market in South Korea, consider subscribing to industry newsletters, following relevant companies and organizations, or regularly checking reputable industry news sources and publications.
Methodology
Step 1 - Identification of Relevant Samples Size from Population Database


Step 2 - Approaches for Defining Global Market Size (Value, Volume* & Price*)

Note*: In applicable scenarios
Step 3 - Data Sources
Primary Research
- Web Analytics
- Survey Reports
- Research Institute
- Latest Research Reports
- Opinion Leaders
Secondary Research
- Annual Reports
- White Paper
- Latest Press Release
- Industry Association
- Paid Database
- Investor Presentations

Step 4 - Data Triangulation
Involves using different sources of information in order to increase the validity of a study
These sources are likely to be stakeholders in a program - participants, other researchers, program staff, other community members, and so on.
Then we put all data in single framework & apply various statistical tools to find out the dynamic on the market.
During the analysis stage, feedback from the stakeholder groups would be compared to determine areas of agreement as well as areas of divergence
