

Key Insights
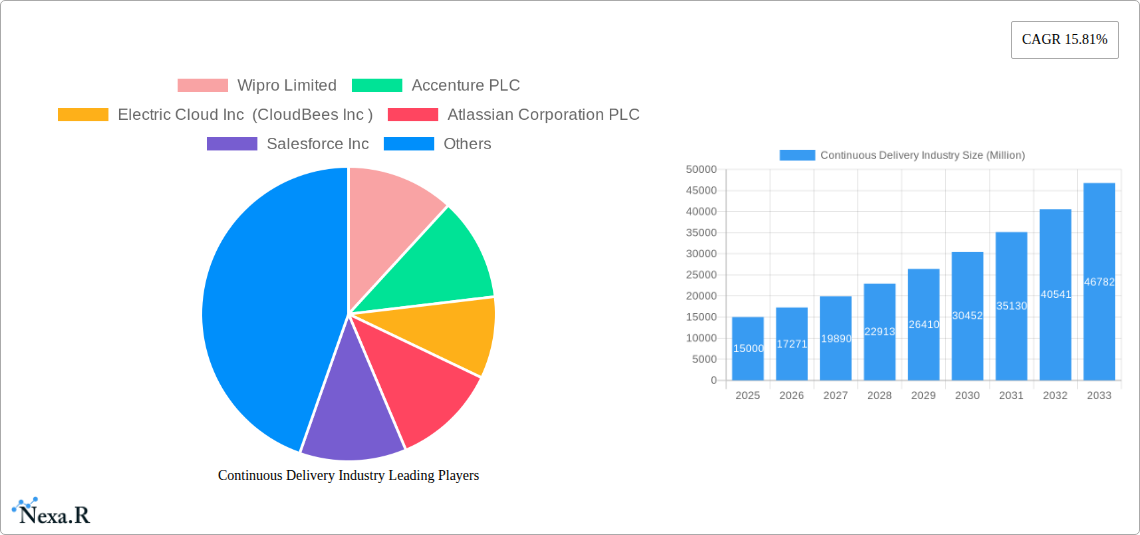
The Continuous Delivery (CD) market is experiencing robust growth, fueled by the increasing adoption of DevOps practices and the shift towards cloud-native architectures. A 15.81% Compound Annual Growth Rate (CAGR) from 2019 to 2024 suggests a significant market expansion, projected to continue through 2033. Key drivers include the need for faster software releases, improved software quality, and enhanced operational efficiency. Businesses across various sectors, notably BFSI, Telecom & IT, and Retail & Consumer Goods, are embracing CD to gain a competitive edge in the rapidly evolving digital landscape. The adoption of cloud-based CD solutions is a prominent trend, offering scalability, flexibility, and cost-effectiveness. However, challenges such as integration complexities, skill gaps, and security concerns remain as potential restraints. The market is segmented by end-user industry, deployment type (cloud vs. on-premise), and organization size (large enterprises vs. SMEs). Large enterprises currently dominate the market due to their greater resources and established DevOps infrastructures, but the SME segment is expected to witness substantial growth as they increasingly adopt CD practices to remain competitive. The North American market currently holds a significant share, driven by early adoption and technological advancements, but the Asia-Pacific region shows substantial growth potential due to its expanding digital economy and increasing tech investments.
The competitive landscape is characterized by a mix of established players like Wipro, Accenture, and IBM, along with specialized CD solution providers such as Electric Cloud (CloudBees), Atlassian, and XebiaLabs. These companies are continuously innovating, expanding their product portfolios, and forging strategic partnerships to maintain their market positions. Future growth will likely be driven by advancements in AI-powered automation, enhanced security features, and increased integration with other DevOps tools. The focus will likely shift towards addressing the challenges of complex microservices architectures and the need for greater observability and traceability throughout the CD pipeline. The market's sustained growth trajectory highlights the critical role of continuous delivery in enabling organizations to deliver software faster, more reliably, and with greater business value. This underscores the importance of CD as a cornerstone of modern software development and deployment strategies.
Continuous Delivery Industry Market Report: 2019-2033
This comprehensive report provides an in-depth analysis of the Continuous Delivery industry, encompassing market dynamics, growth trends, regional dominance, product landscapes, and key players. The study period covers 2019-2033, with a base year of 2025 and a forecast period of 2025-2033. The report is invaluable for industry professionals, investors, and anyone seeking to understand the evolving landscape of continuous delivery solutions. Market values are presented in Million units.
Continuous Delivery Industry Market Dynamics & Structure
The Continuous Delivery market is experiencing robust growth, driven by the increasing adoption of DevOps practices and the need for faster software release cycles. Market concentration is moderate, with several key players vying for market share. Technological innovation, particularly in areas like AI-powered automation and cloud-native solutions, is a significant driver. Regulatory frameworks concerning data security and compliance are impacting market strategies, while competitive pressures from open-source alternatives and increasing M&A activity shape the industry landscape. The parent market is the broader Software Development Lifecycle (SDLC) market, while the child market is specifically Continuous Integration and Continuous Delivery (CI/CD) tools and services.
- Market Concentration: Moderate, with top 10 players holding approximately xx% of the market share in 2025.
- Technological Innovation: Significant advancements in AI/ML for automation and cloud-native CI/CD platforms are driving market growth.
- Regulatory Frameworks: Compliance regulations like GDPR and CCPA are influencing product development and adoption strategies.
- Competitive Substitutes: Open-source alternatives and internally developed solutions pose competition.
- M&A Activity: A moderate level of M&A activity is observed, with xx deals recorded in the past five years. This demonstrates a consolidation trend within the industry.
- End-User Demographics: Large enterprises are the primary adopters, but SMEs are increasingly adopting CI/CD practices, signifying a broadening market.
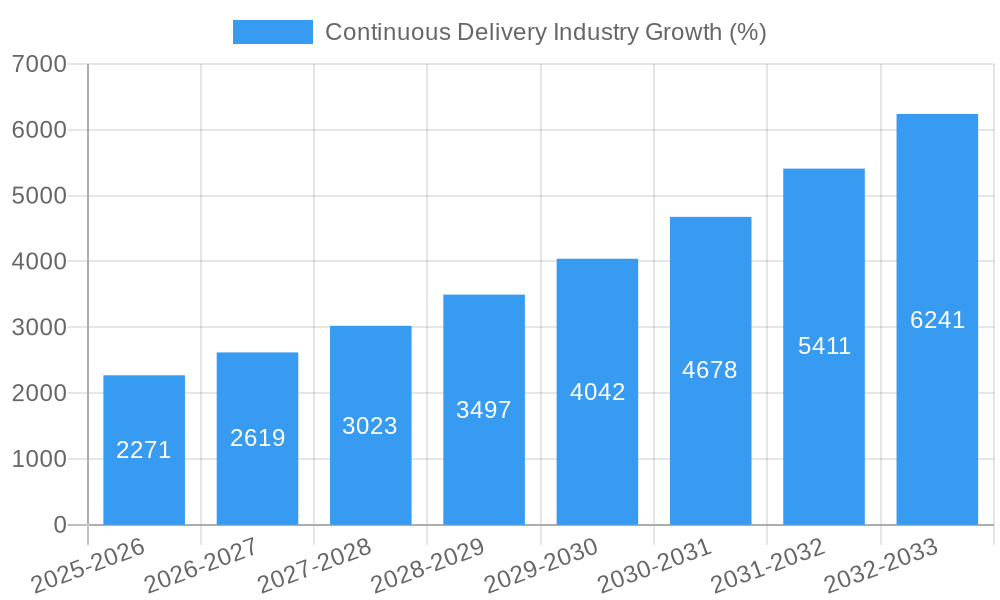
Continuous Delivery Industry Growth Trends & Insights
The Continuous Delivery market is experiencing significant growth, fueled by the increasing demand for faster software releases and improved application quality. The market size is projected to reach xx Million in 2025 and is expected to grow at a Compound Annual Growth Rate (CAGR) of xx% during the forecast period (2025-2033), reaching xx Million by 2033. Adoption rates are increasing across various industries, driven by digital transformation initiatives and the competitive landscape that necessitates faster time-to-market. Technological disruptions, such as the rise of serverless computing and edge computing, are creating new opportunities and challenges. Shifting consumer behavior, which increasingly expects seamless and frequent software updates, also fuels industry growth. Market penetration is highest in the North American region, followed by Europe. Factors influencing consumer behavior include the emphasis on quick releases with new features, increased expectations of quality, and consumer preference for frequent application updates.
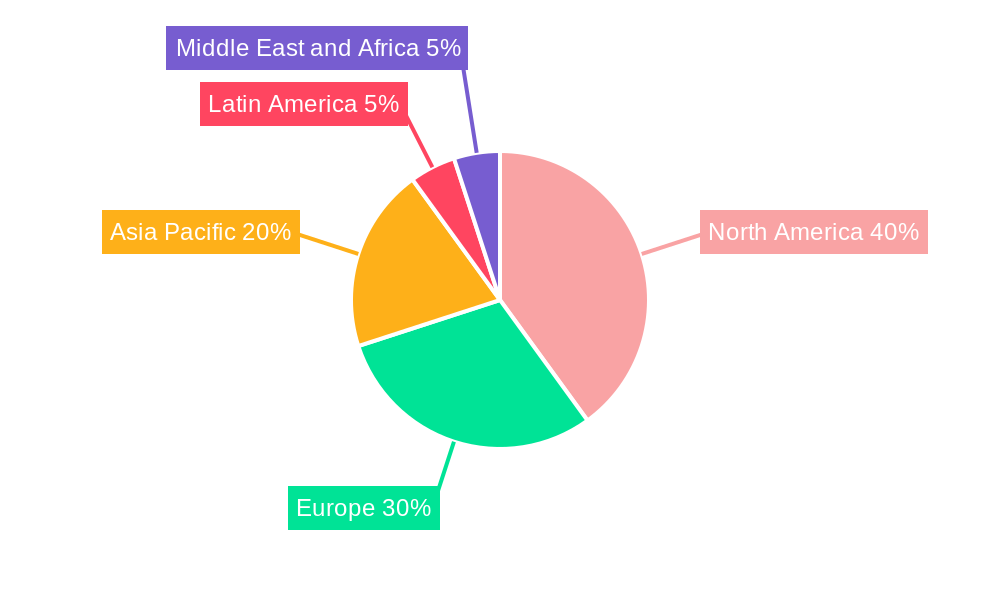
Dominant Regions, Countries, or Segments in Continuous Delivery Industry
North America holds the largest market share in the Continuous Delivery industry, followed by Europe and Asia Pacific. Within end-user industries, Telecom and IT, BFSI, and Retail and Consumer Goods are the leading segments. Cloud deployment is the dominant deployment type, showcasing the industry's shift towards cloud-native architectures. Large Enterprises dominate market share due to their greater resources and complex software portfolios.
- Leading Region: North America (Market Share: xx% in 2025).
- Leading End-User Industry: Telecom and IT (Market Share: xx% in 2025).
- Leading Deployment Type: Cloud (Market Share: xx% in 2025).
- Leading Organization Size: Large Enterprises (Market Share: xx% in 2025).
- Key Drivers: Strong digital transformation initiatives, robust IT infrastructure, and high adoption of cloud technologies in North America and large enterprises.
Continuous Delivery Industry Product Landscape
The Continuous Delivery product landscape is characterized by a wide range of solutions, including CI/CD platforms, automation tools, and application release orchestration systems. These solutions offer features such as automated testing, deployment pipelines, and real-time monitoring, ensuring faster and more reliable software releases. Key differentiators include ease of use, integration capabilities, and support for various technologies and cloud environments. The emergence of AI-powered solutions that optimize deployment processes and predict potential issues is a significant technological advancement. Recent trends include incorporating security features throughout the delivery process and embracing serverless architectures for increased scalability and cost efficiency.
Key Drivers, Barriers & Challenges in Continuous Delivery Industry
Key Drivers:
- Increasing adoption of DevOps methodologies.
- Growing demand for faster software releases.
- Rise of cloud-native applications and microservices.
- Increased focus on automation and efficiency.
Challenges and Restraints:
- Integration complexities with legacy systems.
- Security concerns related to continuous deployment.
- Skill gaps in DevOps expertise.
- High initial investment costs for implementing CI/CD solutions.
- xx% of organizations still face challenges in achieving full automation of their CI/CD pipeline in 2025.
Emerging Opportunities in Continuous Delivery Industry
Emerging opportunities lie in the expansion into untapped markets, particularly in developing economies and niche sectors like IoT and embedded systems. Innovative applications such as AI-powered testing and automated security checks offer significant potential. The rise of serverless computing is also opening new avenues for CI/CD solutions. Growing demand for improved security throughout the delivery process and the potential for greater adoption by small and medium-sized enterprises (SMEs) are significant opportunities.
Growth Accelerators in the Continuous Delivery Industry
Technological advancements like AI-driven automation, improved integration capabilities, and the evolution of cloud-native solutions are key growth accelerators. Strategic partnerships between CI/CD providers and cloud platforms broaden the market reach. The industry’s expansion into new market segments, such as IoT and edge computing, and successful market penetration among SMEs, are also strong accelerators. The increasing adoption of DevOps principles within the broader IT sector contributes significantly to long-term growth.
Key Players Shaping the Continuous Delivery Industry Market
- Wipro Limited
- Accenture PLC
- Electric Cloud Inc (CloudBees Inc)
- Atlassian Corporation PLC
- Salesforce Inc
- IBM Corporation (Red Hat Inc)
- XebiaLabs (DIGITAL AI)
- Clarive Software Inc
- Microsoft Corporation
- Flexagon LLC
- Broadcom Inc (CA Technologie)
Notable Milestones in Continuous Delivery Industry Sector
- January 2022: Harness launched a continuous delivery-as-a-service solution, aiming to simplify modern software delivery for enterprises and small businesses.
- February 2022: Google released Google Cloud Deploys, a managed continuous delivery service for Google Kubernetes Engine, enhancing security and workflow integration.
In-Depth Continuous Delivery Industry Market Outlook
The Continuous Delivery market is poised for continued strong growth, driven by persistent demand for faster and more reliable software releases. The increasing adoption of cloud-native technologies and the expanding need for automated deployments will fuel market expansion. Strategic partnerships and the development of innovative solutions will further enhance market potential. Opportunities exist in emerging technologies and untapped markets, offering significant scope for growth and innovation in the coming years.
Continuous Delivery Industry Segmentation
-
1. Deployment Type
- 1.1. Cloud
- 1.2. On-premise
-
2. Organization Size
- 2.1. Large Enterprises
- 2.2. Small and Medium-sized Enterprises
-
3. End User Industry
- 3.1. BFSI
- 3.2. Telecom and IT
- 3.3. Retail and Consumer Goods
- 3.4. Healthcare and Life Sciences
- 3.5. Manufacturing
- 3.6. Government and Defense
- 3.7. Other End User Industries
Continuous Delivery Industry Segmentation By Geography
- 1. North America
- 2. Europe
- 3. Asia
- 4. Latin America
- 5. Middle East and Africa
Continuous Delivery Industry REPORT HIGHLIGHTS
| Aspects | Details |
|---|---|
| Study Period | 2019-2033 |
| Base Year | 2024 |
| Estimated Year | 2025 |
| Forecast Period | 2025-2033 |
| Historical Period | 2019-2024 |
| Growth Rate | CAGR of 15.81% from 2019-2033 |
| Segmentation |
|
Table of Contents
- 1. Introduction
- 1.1. Research Scope
- 1.2. Market Segmentation
- 1.3. Research Methodology
- 1.4. Definitions and Assumptions
- 2. Executive Summary
- 2.1. Introduction
- 3. Market Dynamics
- 3.1. Introduction
- 3.2. Market Drivers
- 3.2.1. Increasing Demand For Automation Across Business Processes; Increasing Adoption Of Cloud Technology
- 3.3. Market Restrains
- 3.3.1. Maintaining Data Security And Privacy
- 3.4. Market Trends
- 3.4.1. Increasing Adoption of Cloud Technology in the Continuous Delivery Market
- 4. Market Factor Analysis
- 4.1. Porters Five Forces
- 4.2. Supply/Value Chain
- 4.3. PESTEL analysis
- 4.4. Market Entropy
- 4.5. Patent/Trademark Analysis
- 5. Global Continuous Delivery Industry Analysis, Insights and Forecast, 2019-2031
- 5.1. Market Analysis, Insights and Forecast - by Deployment Type
- 5.1.1. Cloud
- 5.1.2. On-premise
- 5.2. Market Analysis, Insights and Forecast - by Organization Size
- 5.2.1. Large Enterprises
- 5.2.2. Small and Medium-sized Enterprises
- 5.3. Market Analysis, Insights and Forecast - by End User Industry
- 5.3.1. BFSI
- 5.3.2. Telecom and IT
- 5.3.3. Retail and Consumer Goods
- 5.3.4. Healthcare and Life Sciences
- 5.3.5. Manufacturing
- 5.3.6. Government and Defense
- 5.3.7. Other End User Industries
- 5.4. Market Analysis, Insights and Forecast - by Region
- 5.4.1. North America
- 5.4.2. Europe
- 5.4.3. Asia
- 5.4.4. Latin America
- 5.4.5. Middle East and Africa
- 5.1. Market Analysis, Insights and Forecast - by Deployment Type
- 6. North America Continuous Delivery Industry Analysis, Insights and Forecast, 2019-2031
- 6.1. Market Analysis, Insights and Forecast - by Deployment Type
- 6.1.1. Cloud
- 6.1.2. On-premise
- 6.2. Market Analysis, Insights and Forecast - by Organization Size
- 6.2.1. Large Enterprises
- 6.2.2. Small and Medium-sized Enterprises
- 6.3. Market Analysis, Insights and Forecast - by End User Industry
- 6.3.1. BFSI
- 6.3.2. Telecom and IT
- 6.3.3. Retail and Consumer Goods
- 6.3.4. Healthcare and Life Sciences
- 6.3.5. Manufacturing
- 6.3.6. Government and Defense
- 6.3.7. Other End User Industries
- 6.1. Market Analysis, Insights and Forecast - by Deployment Type
- 7. Europe Continuous Delivery Industry Analysis, Insights and Forecast, 2019-2031
- 7.1. Market Analysis, Insights and Forecast - by Deployment Type
- 7.1.1. Cloud
- 7.1.2. On-premise
- 7.2. Market Analysis, Insights and Forecast - by Organization Size
- 7.2.1. Large Enterprises
- 7.2.2. Small and Medium-sized Enterprises
- 7.3. Market Analysis, Insights and Forecast - by End User Industry
- 7.3.1. BFSI
- 7.3.2. Telecom and IT
- 7.3.3. Retail and Consumer Goods
- 7.3.4. Healthcare and Life Sciences
- 7.3.5. Manufacturing
- 7.3.6. Government and Defense
- 7.3.7. Other End User Industries
- 7.1. Market Analysis, Insights and Forecast - by Deployment Type
- 8. Asia Continuous Delivery Industry Analysis, Insights and Forecast, 2019-2031
- 8.1. Market Analysis, Insights and Forecast - by Deployment Type
- 8.1.1. Cloud
- 8.1.2. On-premise
- 8.2. Market Analysis, Insights and Forecast - by Organization Size
- 8.2.1. Large Enterprises
- 8.2.2. Small and Medium-sized Enterprises
- 8.3. Market Analysis, Insights and Forecast - by End User Industry
- 8.3.1. BFSI
- 8.3.2. Telecom and IT
- 8.3.3. Retail and Consumer Goods
- 8.3.4. Healthcare and Life Sciences
- 8.3.5. Manufacturing
- 8.3.6. Government and Defense
- 8.3.7. Other End User Industries
- 8.1. Market Analysis, Insights and Forecast - by Deployment Type
- 9. Latin America Continuous Delivery Industry Analysis, Insights and Forecast, 2019-2031
- 9.1. Market Analysis, Insights and Forecast - by Deployment Type
- 9.1.1. Cloud
- 9.1.2. On-premise
- 9.2. Market Analysis, Insights and Forecast - by Organization Size
- 9.2.1. Large Enterprises
- 9.2.2. Small and Medium-sized Enterprises
- 9.3. Market Analysis, Insights and Forecast - by End User Industry
- 9.3.1. BFSI
- 9.3.2. Telecom and IT
- 9.3.3. Retail and Consumer Goods
- 9.3.4. Healthcare and Life Sciences
- 9.3.5. Manufacturing
- 9.3.6. Government and Defense
- 9.3.7. Other End User Industries
- 9.1. Market Analysis, Insights and Forecast - by Deployment Type
- 10. Middle East and Africa Continuous Delivery Industry Analysis, Insights and Forecast, 2019-2031
- 10.1. Market Analysis, Insights and Forecast - by Deployment Type
- 10.1.1. Cloud
- 10.1.2. On-premise
- 10.2. Market Analysis, Insights and Forecast - by Organization Size
- 10.2.1. Large Enterprises
- 10.2.2. Small and Medium-sized Enterprises
- 10.3. Market Analysis, Insights and Forecast - by End User Industry
- 10.3.1. BFSI
- 10.3.2. Telecom and IT
- 10.3.3. Retail and Consumer Goods
- 10.3.4. Healthcare and Life Sciences
- 10.3.5. Manufacturing
- 10.3.6. Government and Defense
- 10.3.7. Other End User Industries
- 10.1. Market Analysis, Insights and Forecast - by Deployment Type
- 11. North America Continuous Delivery Industry Analysis, Insights and Forecast, 2019-2031
- 11.1. Market Analysis, Insights and Forecast - By Country/Sub-region
- 11.1.1.
- 12. Europe Continuous Delivery Industry Analysis, Insights and Forecast, 2019-2031
- 12.1. Market Analysis, Insights and Forecast - By Country/Sub-region
- 12.1.1.
- 13. Asia Pacific Continuous Delivery Industry Analysis, Insights and Forecast, 2019-2031
- 13.1. Market Analysis, Insights and Forecast - By Country/Sub-region
- 13.1.1.
- 14. Latin America Continuous Delivery Industry Analysis, Insights and Forecast, 2019-2031
- 14.1. Market Analysis, Insights and Forecast - By Country/Sub-region
- 14.1.1.
- 15. Middle East and Africa Continuous Delivery Industry Analysis, Insights and Forecast, 2019-2031
- 15.1. Market Analysis, Insights and Forecast - By Country/Sub-region
- 15.1.1.
- 16. Competitive Analysis
- 16.1. Global Market Share Analysis 2024
- 16.2. Company Profiles
- 16.2.1 Wipro Limited
- 16.2.1.1. Overview
- 16.2.1.2. Products
- 16.2.1.3. SWOT Analysis
- 16.2.1.4. Recent Developments
- 16.2.1.5. Financials (Based on Availability)
- 16.2.2 Accenture PLC
- 16.2.2.1. Overview
- 16.2.2.2. Products
- 16.2.2.3. SWOT Analysis
- 16.2.2.4. Recent Developments
- 16.2.2.5. Financials (Based on Availability)
- 16.2.3 Electric Cloud Inc (CloudBees Inc )
- 16.2.3.1. Overview
- 16.2.3.2. Products
- 16.2.3.3. SWOT Analysis
- 16.2.3.4. Recent Developments
- 16.2.3.5. Financials (Based on Availability)
- 16.2.4 Atlassian Corporation PLC
- 16.2.4.1. Overview
- 16.2.4.2. Products
- 16.2.4.3. SWOT Analysis
- 16.2.4.4. Recent Developments
- 16.2.4.5. Financials (Based on Availability)
- 16.2.5 Salesforce Inc
- 16.2.5.1. Overview
- 16.2.5.2. Products
- 16.2.5.3. SWOT Analysis
- 16.2.5.4. Recent Developments
- 16.2.5.5. Financials (Based on Availability)
- 16.2.6 IBM Corporation (Red Hata Inc )
- 16.2.6.1. Overview
- 16.2.6.2. Products
- 16.2.6.3. SWOT Analysis
- 16.2.6.4. Recent Developments
- 16.2.6.5. Financials (Based on Availability)
- 16.2.7 XebiaLabs (DIGITAL AI)
- 16.2.7.1. Overview
- 16.2.7.2. Products
- 16.2.7.3. SWOT Analysis
- 16.2.7.4. Recent Developments
- 16.2.7.5. Financials (Based on Availability)
- 16.2.8 Clarive Software Inc
- 16.2.8.1. Overview
- 16.2.8.2. Products
- 16.2.8.3. SWOT Analysis
- 16.2.8.4. Recent Developments
- 16.2.8.5. Financials (Based on Availability)
- 16.2.9 Microsoft Corporation
- 16.2.9.1. Overview
- 16.2.9.2. Products
- 16.2.9.3. SWOT Analysis
- 16.2.9.4. Recent Developments
- 16.2.9.5. Financials (Based on Availability)
- 16.2.10 Flexagon LLC
- 16.2.10.1. Overview
- 16.2.10.2. Products
- 16.2.10.3. SWOT Analysis
- 16.2.10.4. Recent Developments
- 16.2.10.5. Financials (Based on Availability)
- 16.2.11 Broadcom Inc (CA Technologie)
- 16.2.11.1. Overview
- 16.2.11.2. Products
- 16.2.11.3. SWOT Analysis
- 16.2.11.4. Recent Developments
- 16.2.11.5. Financials (Based on Availability)
- 16.2.1 Wipro Limited
List of Figures
- Figure 1: Global Continuous Delivery Industry Revenue Breakdown (Million, %) by Region 2024 & 2032
- Figure 2: North America Continuous Delivery Industry Revenue (Million), by Country 2024 & 2032
- Figure 3: North America Continuous Delivery Industry Revenue Share (%), by Country 2024 & 2032
- Figure 4: Europe Continuous Delivery Industry Revenue (Million), by Country 2024 & 2032
- Figure 5: Europe Continuous Delivery Industry Revenue Share (%), by Country 2024 & 2032
- Figure 6: Asia Pacific Continuous Delivery Industry Revenue (Million), by Country 2024 & 2032
- Figure 7: Asia Pacific Continuous Delivery Industry Revenue Share (%), by Country 2024 & 2032
- Figure 8: Latin America Continuous Delivery Industry Revenue (Million), by Country 2024 & 2032
- Figure 9: Latin America Continuous Delivery Industry Revenue Share (%), by Country 2024 & 2032
- Figure 10: Middle East and Africa Continuous Delivery Industry Revenue (Million), by Country 2024 & 2032
- Figure 11: Middle East and Africa Continuous Delivery Industry Revenue Share (%), by Country 2024 & 2032
- Figure 12: North America Continuous Delivery Industry Revenue (Million), by Deployment Type 2024 & 2032
- Figure 13: North America Continuous Delivery Industry Revenue Share (%), by Deployment Type 2024 & 2032
- Figure 14: North America Continuous Delivery Industry Revenue (Million), by Organization Size 2024 & 2032
- Figure 15: North America Continuous Delivery Industry Revenue Share (%), by Organization Size 2024 & 2032
- Figure 16: North America Continuous Delivery Industry Revenue (Million), by End User Industry 2024 & 2032
- Figure 17: North America Continuous Delivery Industry Revenue Share (%), by End User Industry 2024 & 2032
- Figure 18: North America Continuous Delivery Industry Revenue (Million), by Country 2024 & 2032
- Figure 19: North America Continuous Delivery Industry Revenue Share (%), by Country 2024 & 2032
- Figure 20: Europe Continuous Delivery Industry Revenue (Million), by Deployment Type 2024 & 2032
- Figure 21: Europe Continuous Delivery Industry Revenue Share (%), by Deployment Type 2024 & 2032
- Figure 22: Europe Continuous Delivery Industry Revenue (Million), by Organization Size 2024 & 2032
- Figure 23: Europe Continuous Delivery Industry Revenue Share (%), by Organization Size 2024 & 2032
- Figure 24: Europe Continuous Delivery Industry Revenue (Million), by End User Industry 2024 & 2032
- Figure 25: Europe Continuous Delivery Industry Revenue Share (%), by End User Industry 2024 & 2032
- Figure 26: Europe Continuous Delivery Industry Revenue (Million), by Country 2024 & 2032
- Figure 27: Europe Continuous Delivery Industry Revenue Share (%), by Country 2024 & 2032
- Figure 28: Asia Continuous Delivery Industry Revenue (Million), by Deployment Type 2024 & 2032
- Figure 29: Asia Continuous Delivery Industry Revenue Share (%), by Deployment Type 2024 & 2032
- Figure 30: Asia Continuous Delivery Industry Revenue (Million), by Organization Size 2024 & 2032
- Figure 31: Asia Continuous Delivery Industry Revenue Share (%), by Organization Size 2024 & 2032
- Figure 32: Asia Continuous Delivery Industry Revenue (Million), by End User Industry 2024 & 2032
- Figure 33: Asia Continuous Delivery Industry Revenue Share (%), by End User Industry 2024 & 2032
- Figure 34: Asia Continuous Delivery Industry Revenue (Million), by Country 2024 & 2032
- Figure 35: Asia Continuous Delivery Industry Revenue Share (%), by Country 2024 & 2032
- Figure 36: Latin America Continuous Delivery Industry Revenue (Million), by Deployment Type 2024 & 2032
- Figure 37: Latin America Continuous Delivery Industry Revenue Share (%), by Deployment Type 2024 & 2032
- Figure 38: Latin America Continuous Delivery Industry Revenue (Million), by Organization Size 2024 & 2032
- Figure 39: Latin America Continuous Delivery Industry Revenue Share (%), by Organization Size 2024 & 2032
- Figure 40: Latin America Continuous Delivery Industry Revenue (Million), by End User Industry 2024 & 2032
- Figure 41: Latin America Continuous Delivery Industry Revenue Share (%), by End User Industry 2024 & 2032
- Figure 42: Latin America Continuous Delivery Industry Revenue (Million), by Country 2024 & 2032
- Figure 43: Latin America Continuous Delivery Industry Revenue Share (%), by Country 2024 & 2032
- Figure 44: Middle East and Africa Continuous Delivery Industry Revenue (Million), by Deployment Type 2024 & 2032
- Figure 45: Middle East and Africa Continuous Delivery Industry Revenue Share (%), by Deployment Type 2024 & 2032
- Figure 46: Middle East and Africa Continuous Delivery Industry Revenue (Million), by Organization Size 2024 & 2032
- Figure 47: Middle East and Africa Continuous Delivery Industry Revenue Share (%), by Organization Size 2024 & 2032
- Figure 48: Middle East and Africa Continuous Delivery Industry Revenue (Million), by End User Industry 2024 & 2032
- Figure 49: Middle East and Africa Continuous Delivery Industry Revenue Share (%), by End User Industry 2024 & 2032
- Figure 50: Middle East and Africa Continuous Delivery Industry Revenue (Million), by Country 2024 & 2032
- Figure 51: Middle East and Africa Continuous Delivery Industry Revenue Share (%), by Country 2024 & 2032
List of Tables
- Table 1: Global Continuous Delivery Industry Revenue Million Forecast, by Region 2019 & 2032
- Table 2: Global Continuous Delivery Industry Revenue Million Forecast, by Deployment Type 2019 & 2032
- Table 3: Global Continuous Delivery Industry Revenue Million Forecast, by Organization Size 2019 & 2032
- Table 4: Global Continuous Delivery Industry Revenue Million Forecast, by End User Industry 2019 & 2032
- Table 5: Global Continuous Delivery Industry Revenue Million Forecast, by Region 2019 & 2032
- Table 6: Global Continuous Delivery Industry Revenue Million Forecast, by Country 2019 & 2032
- Table 7: Continuous Delivery Industry Revenue (Million) Forecast, by Application 2019 & 2032
- Table 8: Global Continuous Delivery Industry Revenue Million Forecast, by Country 2019 & 2032
- Table 9: Continuous Delivery Industry Revenue (Million) Forecast, by Application 2019 & 2032
- Table 10: Global Continuous Delivery Industry Revenue Million Forecast, by Country 2019 & 2032
- Table 11: Continuous Delivery Industry Revenue (Million) Forecast, by Application 2019 & 2032
- Table 12: Global Continuous Delivery Industry Revenue Million Forecast, by Country 2019 & 2032
- Table 13: Continuous Delivery Industry Revenue (Million) Forecast, by Application 2019 & 2032
- Table 14: Global Continuous Delivery Industry Revenue Million Forecast, by Country 2019 & 2032
- Table 15: Continuous Delivery Industry Revenue (Million) Forecast, by Application 2019 & 2032
- Table 16: Global Continuous Delivery Industry Revenue Million Forecast, by Deployment Type 2019 & 2032
- Table 17: Global Continuous Delivery Industry Revenue Million Forecast, by Organization Size 2019 & 2032
- Table 18: Global Continuous Delivery Industry Revenue Million Forecast, by End User Industry 2019 & 2032
- Table 19: Global Continuous Delivery Industry Revenue Million Forecast, by Country 2019 & 2032
- Table 20: Global Continuous Delivery Industry Revenue Million Forecast, by Deployment Type 2019 & 2032
- Table 21: Global Continuous Delivery Industry Revenue Million Forecast, by Organization Size 2019 & 2032
- Table 22: Global Continuous Delivery Industry Revenue Million Forecast, by End User Industry 2019 & 2032
- Table 23: Global Continuous Delivery Industry Revenue Million Forecast, by Country 2019 & 2032
- Table 24: Global Continuous Delivery Industry Revenue Million Forecast, by Deployment Type 2019 & 2032
- Table 25: Global Continuous Delivery Industry Revenue Million Forecast, by Organization Size 2019 & 2032
- Table 26: Global Continuous Delivery Industry Revenue Million Forecast, by End User Industry 2019 & 2032
- Table 27: Global Continuous Delivery Industry Revenue Million Forecast, by Country 2019 & 2032
- Table 28: Global Continuous Delivery Industry Revenue Million Forecast, by Deployment Type 2019 & 2032
- Table 29: Global Continuous Delivery Industry Revenue Million Forecast, by Organization Size 2019 & 2032
- Table 30: Global Continuous Delivery Industry Revenue Million Forecast, by End User Industry 2019 & 2032
- Table 31: Global Continuous Delivery Industry Revenue Million Forecast, by Country 2019 & 2032
- Table 32: Global Continuous Delivery Industry Revenue Million Forecast, by Deployment Type 2019 & 2032
- Table 33: Global Continuous Delivery Industry Revenue Million Forecast, by Organization Size 2019 & 2032
- Table 34: Global Continuous Delivery Industry Revenue Million Forecast, by End User Industry 2019 & 2032
- Table 35: Global Continuous Delivery Industry Revenue Million Forecast, by Country 2019 & 2032
Frequently Asked Questions
1. What is the projected Compound Annual Growth Rate (CAGR) of the Continuous Delivery Industry?
The projected CAGR is approximately 15.81%.
2. Which companies are prominent players in the Continuous Delivery Industry?
Key companies in the market include Wipro Limited, Accenture PLC, Electric Cloud Inc (CloudBees Inc ), Atlassian Corporation PLC, Salesforce Inc, IBM Corporation (Red Hata Inc ), XebiaLabs (DIGITAL AI), Clarive Software Inc, Microsoft Corporation, Flexagon LLC, Broadcom Inc (CA Technologie).
3. What are the main segments of the Continuous Delivery Industry?
The market segments include Deployment Type, Organization Size, End User Industry.
4. Can you provide details about the market size?
The market size is estimated to be USD XX Million as of 2022.
5. What are some drivers contributing to market growth?
Increasing Demand For Automation Across Business Processes; Increasing Adoption Of Cloud Technology.
6. What are the notable trends driving market growth?
Increasing Adoption of Cloud Technology in the Continuous Delivery Market.
7. Are there any restraints impacting market growth?
Maintaining Data Security And Privacy.
8. Can you provide examples of recent developments in the market?
February 2022: Google announced the GA release of Google Cloud Deploys, their managed continuous delivery service for the Google Kubernetes engine. The service offers declarative builds that stay with a given release, the ability to connect external workflows, and detailed security and auditing controls.
9. What pricing options are available for accessing the report?
Pricing options include single-user, multi-user, and enterprise licenses priced at USD 4750, USD 5250, and USD 8750 respectively.
10. Is the market size provided in terms of value or volume?
The market size is provided in terms of value, measured in Million.
11. Are there any specific market keywords associated with the report?
Yes, the market keyword associated with the report is "Continuous Delivery Industry," which aids in identifying and referencing the specific market segment covered.
12. How do I determine which pricing option suits my needs best?
The pricing options vary based on user requirements and access needs. Individual users may opt for single-user licenses, while businesses requiring broader access may choose multi-user or enterprise licenses for cost-effective access to the report.
13. Are there any additional resources or data provided in the Continuous Delivery Industry report?
While the report offers comprehensive insights, it's advisable to review the specific contents or supplementary materials provided to ascertain if additional resources or data are available.
14. How can I stay updated on further developments or reports in the Continuous Delivery Industry?
To stay informed about further developments, trends, and reports in the Continuous Delivery Industry, consider subscribing to industry newsletters, following relevant companies and organizations, or regularly checking reputable industry news sources and publications.
Methodology
Step 1 - Identification of Relevant Samples Size from Population Database


Step 2 - Approaches for Defining Global Market Size (Value, Volume* & Price*)

Note*: In applicable scenarios
Step 3 - Data Sources
Primary Research
- Web Analytics
- Survey Reports
- Research Institute
- Latest Research Reports
- Opinion Leaders
Secondary Research
- Annual Reports
- White Paper
- Latest Press Release
- Industry Association
- Paid Database
- Investor Presentations

Step 4 - Data Triangulation
Involves using different sources of information in order to increase the validity of a study
These sources are likely to be stakeholders in a program - participants, other researchers, program staff, other community members, and so on.
Then we put all data in single framework & apply various statistical tools to find out the dynamic on the market.
During the analysis stage, feedback from the stakeholder groups would be compared to determine areas of agreement as well as areas of divergence
