

Key Insights
The Enterprise Mobility in Retail market is experiencing robust growth, fueled by the increasing adoption of mobile technologies to enhance operational efficiency and customer experience. With a Compound Annual Growth Rate (CAGR) of 26.25% between 2019 and 2024, and a projected continuation of this strong growth trajectory through 2033, the market presents significant opportunities for businesses and investors. Key drivers include the need for improved supply chain management, enhanced inventory tracking, streamlined point-of-sale (POS) systems, and the growing demand for personalized customer interactions through mobile channels. Retailers are leveraging mobile devices like smartphones, tablets, and laptops to empower employees with real-time access to critical data, facilitating faster decision-making and improved responsiveness to customer needs. The market is segmented by device type, with smartphones holding a significant share due to their ubiquity and convenience. Leading players such as Microsoft, IBM, and Cisco are actively contributing to this growth through innovative solutions. While challenges such as data security concerns and the need for robust infrastructure investment exist, the overall trend points towards sustained expansion of the enterprise mobility market within the retail sector. The geographical distribution shows strong growth across North America, Europe, and Asia-Pacific, with emerging markets in South America and the Middle East and Africa also contributing to the overall market expansion.
The continued digital transformation within the retail sector will significantly influence the market's future growth. Emerging trends such as the Internet of Things (IoT) integration, advancements in cloud computing, and the increasing adoption of artificial intelligence (AI) for tasks like predictive analytics and fraud detection are further fueling this expansion. The market is likely to see increased consolidation as larger players acquire smaller companies to expand their market share and capabilities. Furthermore, the focus on enhancing customer experience through personalized mobile interactions and loyalty programs will continue to drive the demand for robust and secure enterprise mobility solutions. The rising adoption of Bring Your Own Device (BYOD) policies also presents both opportunities and challenges, necessitating innovative security measures and robust management tools.
Enterprise Mobility in Retail Industry: A Comprehensive Market Report (2019-2033)
This in-depth report provides a comprehensive analysis of the Enterprise Mobility in Retail Industry market, encompassing market dynamics, growth trends, regional dominance, product landscape, key players, and future outlook. The report covers the period 2019-2033, with a focus on 2025 as the base and estimated year. The market is segmented by device type (Smart Phones, Laptops, Tablets, Other Devices) and analyzed across various geographical regions. The total market size is projected to reach xx Million units by 2033.
Enterprise Mobility in Retail Industry Market Dynamics & Structure
The Enterprise Mobility in Retail Industry market is characterized by moderate concentration, with key players like Microsoft Corporation, VMware Inc, and SAP SE holding significant market share (combined xx%). Technological innovation, particularly in areas like 5G and cloud computing, is a major growth driver. Regulatory frameworks regarding data privacy and security significantly impact market dynamics. Competitive substitutes include legacy on-premise systems, but the shift towards cloud-based solutions is accelerating. The end-user demographic comprises retailers of all sizes, from large multinational corporations to small independent businesses. M&A activity in this space has been moderate (xx deals in the past 5 years), mainly focused on enhancing technology portfolios and expanding geographical reach.
- Market Concentration: Moderately concentrated, with top 5 players holding xx% market share in 2025.
- Innovation Drivers: 5G, Cloud Computing, AI-powered solutions.
- Regulatory Frameworks: GDPR, CCPA, and other data privacy regulations.
- Competitive Substitutes: Legacy on-premise systems.
- M&A Trends: xx deals in the past 5 years, focused on technology and geographical expansion.
- Innovation Barriers: High initial investment costs, integration complexities.
Enterprise Mobility in Retail Industry Growth Trends & Insights
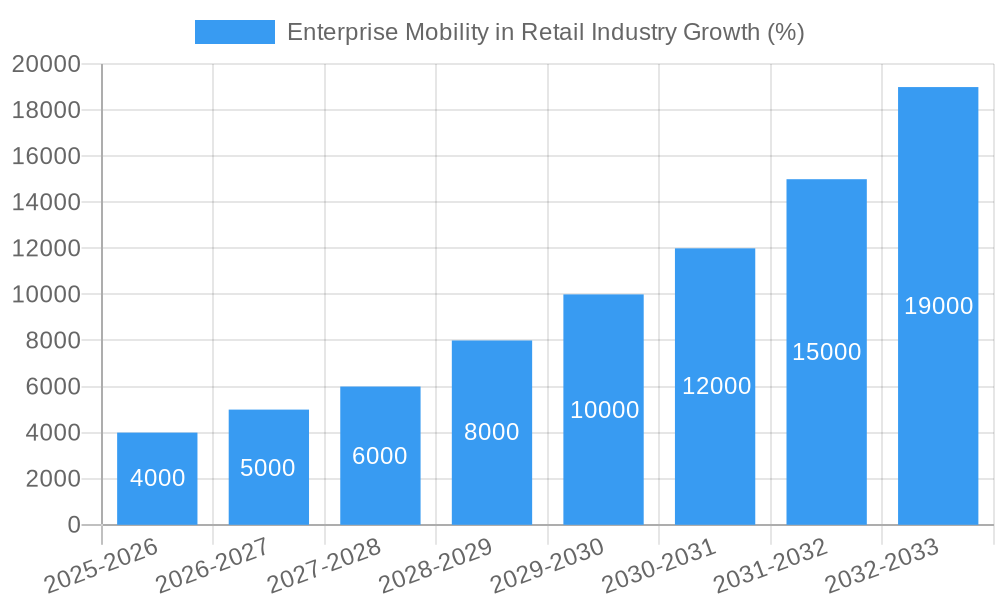
The Enterprise Mobility in Retail Industry market experienced robust growth during the historical period (2019-2024), with a CAGR of xx%. This growth is fueled by the increasing adoption of mobile devices within retail operations, the need for enhanced customer engagement through mobile apps, and the rising demand for improved supply chain efficiency through mobile workforce management. The market is expected to continue its growth trajectory during the forecast period (2025-2033), with a projected CAGR of xx%, driven by factors such as the increasing penetration of smartphones and tablets, the growing adoption of cloud-based mobility solutions, and the expanding use of mobile technologies for inventory management and point-of-sale transactions. Market penetration is expected to reach xx% by 2033. Technological disruptions, such as the integration of IoT devices and the rise of 5G, will further propel market expansion. Shifts in consumer behavior towards omnichannel shopping experiences and the demand for personalized services are key factors driving the adoption of enterprise mobility solutions in the retail sector.
Dominant Regions, Countries, or Segments in Enterprise Mobility in Retail Industry
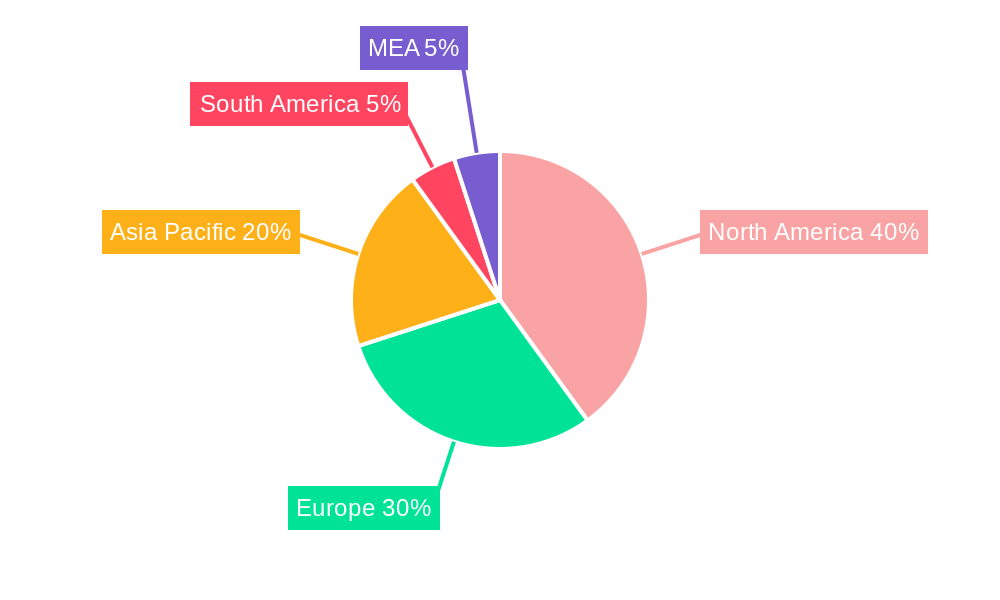
North America currently holds the largest market share (xx%) in the Enterprise Mobility in Retail Industry, driven by high technology adoption rates and a strong presence of major players. However, the Asia-Pacific region is expected to exhibit the highest growth rate (xx% CAGR) during the forecast period due to the burgeoning e-commerce sector and the expanding smartphone user base. Within device segments, Smartphones dominate the market (xx%), followed by Tablets (xx%) and Laptops (xx%).
- North America: High technology adoption, strong presence of major players.
- Asia-Pacific: High growth potential due to expanding e-commerce and smartphone penetration.
- Smartphones: Dominate the market due to widespread accessibility and portability.
- Tablets: Growing adoption for inventory management and point-of-sale activities.
- Laptops: Used for back-office operations and data analysis.
Enterprise Mobility in Retail Industry Product Landscape
The product landscape is characterized by a range of solutions, including Mobile Device Management (MDM), Enterprise Mobility Management (EMM), and Unified Endpoint Management (UEM) platforms. These solutions offer features such as device security, application management, and data protection. Recent innovations focus on integrating AI and machine learning for improved analytics and automation. Unique selling propositions include enhanced security features, seamless integration with existing retail systems, and user-friendly interfaces. Key performance indicators (KPIs) include application uptime, data security breaches, and user satisfaction.
Key Drivers, Barriers & Challenges in Enterprise Mobility in Retail Industry
Key Drivers: Increased demand for enhanced customer experience through mobile apps, the need for efficient supply chain management, and the rising adoption of omnichannel strategies. Government initiatives promoting digitalization in the retail sector also play a role.
Key Challenges: High implementation costs, concerns about data security and privacy, integration complexities with existing legacy systems, and lack of skilled workforce to manage and maintain mobile solutions. Supply chain disruptions can impact the availability of devices and solutions. Strict regulatory compliance requirements add to the challenges. Intense competition among vendors also presents a hurdle.
Emerging Opportunities in Enterprise Mobility in Retail Industry
The untapped potential lies in emerging markets, the integration of advanced technologies like AR/VR for enhanced customer experiences, and the growing adoption of mobile payments. The development of specialized mobile applications for specific retail operations like warehouse management, inventory tracking, and delivery optimization represent significant opportunities. The increasing importance of data analytics for business intelligence also opens up opportunities for providers of sophisticated data management and analytics tools.
Growth Accelerators in the Enterprise Mobility in Retail Industry Industry
Technological advancements, particularly in areas like 5G and AI, are key growth catalysts. Strategic partnerships between technology providers and retail companies are accelerating market expansion. Expansion into untapped markets, particularly in developing economies, presents significant growth opportunities. The adoption of cloud-based solutions is also a significant accelerator.
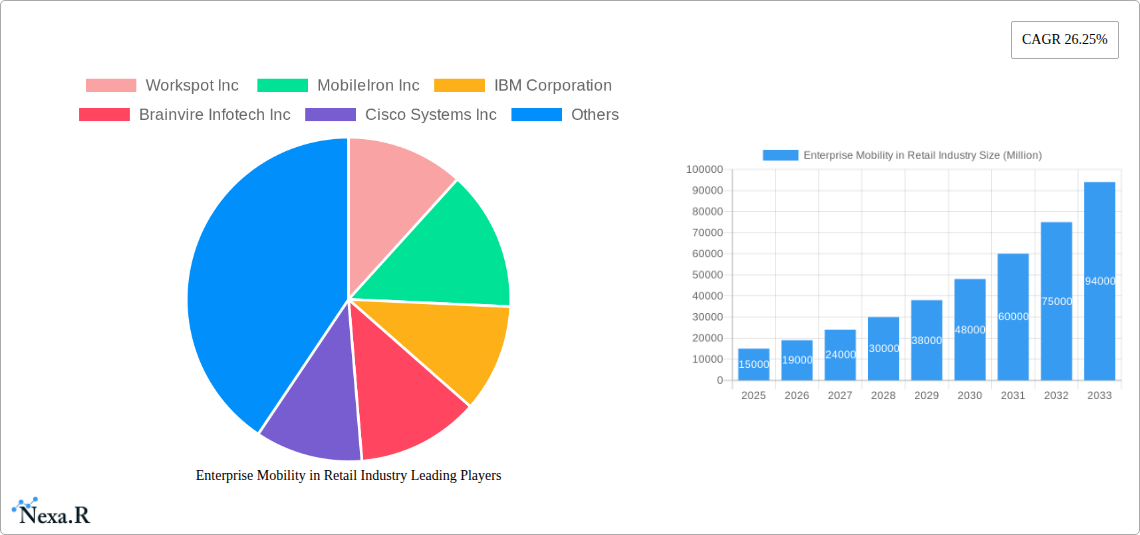
Key Players Shaping the Enterprise Mobility in Retail Industry Market
- Workspot Inc
- MobileIron Inc
- IBM Corporation
- Brainvire Infotech Inc
- Cisco Systems Inc
- Microsoft Corporation
- Credencys Solutions Inc
- InnoMind Technologies
- Gizmeon Inc
- VMware Inc
- Citrix Systems Inc
- SAP SE
- Sonata Software
Notable Milestones in Enterprise Mobility in Retail Industry Sector
- 2020, Q4: Microsoft launched its enhanced Dynamics 365 for retail, incorporating advanced mobility features.
- 2022, Q1: VMware acquired a smaller mobility solutions provider, expanding its product portfolio.
- 2023, Q2: Several major retailers announced partnerships with leading EMM providers to enhance their mobile workforce management strategies.
In-Depth Enterprise Mobility in Retail Industry Market Outlook
The future of the Enterprise Mobility in Retail Industry is bright, with strong growth potential fueled by technological advancements, evolving consumer preferences, and the increasing adoption of omnichannel strategies. Strategic partnerships and investments in innovative solutions will continue to drive market expansion. The market is poised to benefit from increased demand for enhanced security, improved supply chain management, and personalized customer experiences. Focusing on innovative solutions such as AR/VR integration and AI-powered analytics will be crucial for companies seeking to capitalize on this promising market.
Enterprise Mobility in Retail Industry Segmentation
-
1. Device
- 1.1. Smart Phones
- 1.2. Laptops
- 1.3. Tablets
- 1.4. Other Devices
Enterprise Mobility in Retail Industry Segmentation By Geography
- 1. North America
- 2. Europe
- 3. Asia pacific
- 4. Latin America
- 5. Middle East
Enterprise Mobility in Retail Industry REPORT HIGHLIGHTS
| Aspects | Details |
|---|---|
| Study Period | 2019-2033 |
| Base Year | 2024 |
| Estimated Year | 2025 |
| Forecast Period | 2025-2033 |
| Historical Period | 2019-2024 |
| Growth Rate | CAGR of 26.25% from 2019-2033 |
| Segmentation |
|
Table of Contents
- 1. Introduction
- 1.1. Research Scope
- 1.2. Market Segmentation
- 1.3. Research Methodology
- 1.4. Definitions and Assumptions
- 2. Executive Summary
- 2.1. Introduction
- 3. Market Dynamics
- 3.1. Introduction
- 3.2. Market Drivers
- 3.2.1. ; Substantial Growth in E-commerce; Increasing Adoption of Bring-your-own-device (BYOD)
- 3.3. Market Restrains
- 3.3.1. ; Security Concerns
- 3.4. Market Trends
- 3.4.1. Substantial Growth in E-commerce to Spearhead the Growth
- 4. Market Factor Analysis
- 4.1. Porters Five Forces
- 4.2. Supply/Value Chain
- 4.3. PESTEL analysis
- 4.4. Market Entropy
- 4.5. Patent/Trademark Analysis
- 5. Global Enterprise Mobility in Retail Industry Analysis, Insights and Forecast, 2019-2031
- 5.1. Market Analysis, Insights and Forecast - by Device
- 5.1.1. Smart Phones
- 5.1.2. Laptops
- 5.1.3. Tablets
- 5.1.4. Other Devices
- 5.2. Market Analysis, Insights and Forecast - by Region
- 5.2.1. North America
- 5.2.2. Europe
- 5.2.3. Asia pacific
- 5.2.4. Latin America
- 5.2.5. Middle East
- 5.1. Market Analysis, Insights and Forecast - by Device
- 6. North America Enterprise Mobility in Retail Industry Analysis, Insights and Forecast, 2019-2031
- 6.1. Market Analysis, Insights and Forecast - by Device
- 6.1.1. Smart Phones
- 6.1.2. Laptops
- 6.1.3. Tablets
- 6.1.4. Other Devices
- 6.1. Market Analysis, Insights and Forecast - by Device
- 7. Europe Enterprise Mobility in Retail Industry Analysis, Insights and Forecast, 2019-2031
- 7.1. Market Analysis, Insights and Forecast - by Device
- 7.1.1. Smart Phones
- 7.1.2. Laptops
- 7.1.3. Tablets
- 7.1.4. Other Devices
- 7.1. Market Analysis, Insights and Forecast - by Device
- 8. Asia pacific Enterprise Mobility in Retail Industry Analysis, Insights and Forecast, 2019-2031
- 8.1. Market Analysis, Insights and Forecast - by Device
- 8.1.1. Smart Phones
- 8.1.2. Laptops
- 8.1.3. Tablets
- 8.1.4. Other Devices
- 8.1. Market Analysis, Insights and Forecast - by Device
- 9. Latin America Enterprise Mobility in Retail Industry Analysis, Insights and Forecast, 2019-2031
- 9.1. Market Analysis, Insights and Forecast - by Device
- 9.1.1. Smart Phones
- 9.1.2. Laptops
- 9.1.3. Tablets
- 9.1.4. Other Devices
- 9.1. Market Analysis, Insights and Forecast - by Device
- 10. Middle East Enterprise Mobility in Retail Industry Analysis, Insights and Forecast, 2019-2031
- 10.1. Market Analysis, Insights and Forecast - by Device
- 10.1.1. Smart Phones
- 10.1.2. Laptops
- 10.1.3. Tablets
- 10.1.4. Other Devices
- 10.1. Market Analysis, Insights and Forecast - by Device
- 11. North America Enterprise Mobility in Retail Industry Analysis, Insights and Forecast, 2019-2031
- 11.1. Market Analysis, Insights and Forecast - By Country/Sub-region
- 11.1.1 United States
- 11.1.2 Canada
- 11.1.3 Mexico
- 12. Europe Enterprise Mobility in Retail Industry Analysis, Insights and Forecast, 2019-2031
- 12.1. Market Analysis, Insights and Forecast - By Country/Sub-region
- 12.1.1 Germany
- 12.1.2 United Kingdom
- 12.1.3 France
- 12.1.4 Spain
- 12.1.5 Italy
- 12.1.6 Spain
- 12.1.7 Belgium
- 12.1.8 Netherland
- 12.1.9 Nordics
- 12.1.10 Rest of Europe
- 13. Asia Pacific Enterprise Mobility in Retail Industry Analysis, Insights and Forecast, 2019-2031
- 13.1. Market Analysis, Insights and Forecast - By Country/Sub-region
- 13.1.1 China
- 13.1.2 Japan
- 13.1.3 India
- 13.1.4 South Korea
- 13.1.5 Southeast Asia
- 13.1.6 Australia
- 13.1.7 Indonesia
- 13.1.8 Phillipes
- 13.1.9 Singapore
- 13.1.10 Thailandc
- 13.1.11 Rest of Asia Pacific
- 14. South America Enterprise Mobility in Retail Industry Analysis, Insights and Forecast, 2019-2031
- 14.1. Market Analysis, Insights and Forecast - By Country/Sub-region
- 14.1.1 Brazil
- 14.1.2 Argentina
- 14.1.3 Peru
- 14.1.4 Chile
- 14.1.5 Colombia
- 14.1.6 Ecuador
- 14.1.7 Venezuela
- 14.1.8 Rest of South America
- 15. North America Enterprise Mobility in Retail Industry Analysis, Insights and Forecast, 2019-2031
- 15.1. Market Analysis, Insights and Forecast - By Country/Sub-region
- 15.1.1 United States
- 15.1.2 Canada
- 15.1.3 Mexico
- 16. MEA Enterprise Mobility in Retail Industry Analysis, Insights and Forecast, 2019-2031
- 16.1. Market Analysis, Insights and Forecast - By Country/Sub-region
- 16.1.1 United Arab Emirates
- 16.1.2 Saudi Arabia
- 16.1.3 South Africa
- 16.1.4 Rest of Middle East and Africa
- 17. Competitive Analysis
- 17.1. Global Market Share Analysis 2024
- 17.2. Company Profiles
- 17.2.1 Workspot Inc
- 17.2.1.1. Overview
- 17.2.1.2. Products
- 17.2.1.3. SWOT Analysis
- 17.2.1.4. Recent Developments
- 17.2.1.5. Financials (Based on Availability)
- 17.2.2 MobileIron Inc
- 17.2.2.1. Overview
- 17.2.2.2. Products
- 17.2.2.3. SWOT Analysis
- 17.2.2.4. Recent Developments
- 17.2.2.5. Financials (Based on Availability)
- 17.2.3 IBM Corporation
- 17.2.3.1. Overview
- 17.2.3.2. Products
- 17.2.3.3. SWOT Analysis
- 17.2.3.4. Recent Developments
- 17.2.3.5. Financials (Based on Availability)
- 17.2.4 Brainvire Infotech Inc
- 17.2.4.1. Overview
- 17.2.4.2. Products
- 17.2.4.3. SWOT Analysis
- 17.2.4.4. Recent Developments
- 17.2.4.5. Financials (Based on Availability)
- 17.2.5 Cisco Systems Inc
- 17.2.5.1. Overview
- 17.2.5.2. Products
- 17.2.5.3. SWOT Analysis
- 17.2.5.4. Recent Developments
- 17.2.5.5. Financials (Based on Availability)
- 17.2.6 Microsoft Corporation
- 17.2.6.1. Overview
- 17.2.6.2. Products
- 17.2.6.3. SWOT Analysis
- 17.2.6.4. Recent Developments
- 17.2.6.5. Financials (Based on Availability)
- 17.2.7 Credencys Solutions Inc
- 17.2.7.1. Overview
- 17.2.7.2. Products
- 17.2.7.3. SWOT Analysis
- 17.2.7.4. Recent Developments
- 17.2.7.5. Financials (Based on Availability)
- 17.2.8 InnoMind Technologies
- 17.2.8.1. Overview
- 17.2.8.2. Products
- 17.2.8.3. SWOT Analysis
- 17.2.8.4. Recent Developments
- 17.2.8.5. Financials (Based on Availability)
- 17.2.9 Gizmeon Inc
- 17.2.9.1. Overview
- 17.2.9.2. Products
- 17.2.9.3. SWOT Analysis
- 17.2.9.4. Recent Developments
- 17.2.9.5. Financials (Based on Availability)
- 17.2.10 VMware Inc
- 17.2.10.1. Overview
- 17.2.10.2. Products
- 17.2.10.3. SWOT Analysis
- 17.2.10.4. Recent Developments
- 17.2.10.5. Financials (Based on Availability)
- 17.2.11 Citrix Systems Inc
- 17.2.11.1. Overview
- 17.2.11.2. Products
- 17.2.11.3. SWOT Analysis
- 17.2.11.4. Recent Developments
- 17.2.11.5. Financials (Based on Availability)
- 17.2.12 SAP SE
- 17.2.12.1. Overview
- 17.2.12.2. Products
- 17.2.12.3. SWOT Analysis
- 17.2.12.4. Recent Developments
- 17.2.12.5. Financials (Based on Availability)
- 17.2.13 Sonata Software
- 17.2.13.1. Overview
- 17.2.13.2. Products
- 17.2.13.3. SWOT Analysis
- 17.2.13.4. Recent Developments
- 17.2.13.5. Financials (Based on Availability)
- 17.2.1 Workspot Inc
List of Figures
- Figure 1: Global Enterprise Mobility in Retail Industry Revenue Breakdown (Million, %) by Region 2024 & 2032
- Figure 2: North America Enterprise Mobility in Retail Industry Revenue (Million), by Country 2024 & 2032
- Figure 3: North America Enterprise Mobility in Retail Industry Revenue Share (%), by Country 2024 & 2032
- Figure 4: Europe Enterprise Mobility in Retail Industry Revenue (Million), by Country 2024 & 2032
- Figure 5: Europe Enterprise Mobility in Retail Industry Revenue Share (%), by Country 2024 & 2032
- Figure 6: Asia Pacific Enterprise Mobility in Retail Industry Revenue (Million), by Country 2024 & 2032
- Figure 7: Asia Pacific Enterprise Mobility in Retail Industry Revenue Share (%), by Country 2024 & 2032
- Figure 8: South America Enterprise Mobility in Retail Industry Revenue (Million), by Country 2024 & 2032
- Figure 9: South America Enterprise Mobility in Retail Industry Revenue Share (%), by Country 2024 & 2032
- Figure 10: North America Enterprise Mobility in Retail Industry Revenue (Million), by Country 2024 & 2032
- Figure 11: North America Enterprise Mobility in Retail Industry Revenue Share (%), by Country 2024 & 2032
- Figure 12: MEA Enterprise Mobility in Retail Industry Revenue (Million), by Country 2024 & 2032
- Figure 13: MEA Enterprise Mobility in Retail Industry Revenue Share (%), by Country 2024 & 2032
- Figure 14: North America Enterprise Mobility in Retail Industry Revenue (Million), by Device 2024 & 2032
- Figure 15: North America Enterprise Mobility in Retail Industry Revenue Share (%), by Device 2024 & 2032
- Figure 16: North America Enterprise Mobility in Retail Industry Revenue (Million), by Country 2024 & 2032
- Figure 17: North America Enterprise Mobility in Retail Industry Revenue Share (%), by Country 2024 & 2032
- Figure 18: Europe Enterprise Mobility in Retail Industry Revenue (Million), by Device 2024 & 2032
- Figure 19: Europe Enterprise Mobility in Retail Industry Revenue Share (%), by Device 2024 & 2032
- Figure 20: Europe Enterprise Mobility in Retail Industry Revenue (Million), by Country 2024 & 2032
- Figure 21: Europe Enterprise Mobility in Retail Industry Revenue Share (%), by Country 2024 & 2032
- Figure 22: Asia pacific Enterprise Mobility in Retail Industry Revenue (Million), by Device 2024 & 2032
- Figure 23: Asia pacific Enterprise Mobility in Retail Industry Revenue Share (%), by Device 2024 & 2032
- Figure 24: Asia pacific Enterprise Mobility in Retail Industry Revenue (Million), by Country 2024 & 2032
- Figure 25: Asia pacific Enterprise Mobility in Retail Industry Revenue Share (%), by Country 2024 & 2032
- Figure 26: Latin America Enterprise Mobility in Retail Industry Revenue (Million), by Device 2024 & 2032
- Figure 27: Latin America Enterprise Mobility in Retail Industry Revenue Share (%), by Device 2024 & 2032
- Figure 28: Latin America Enterprise Mobility in Retail Industry Revenue (Million), by Country 2024 & 2032
- Figure 29: Latin America Enterprise Mobility in Retail Industry Revenue Share (%), by Country 2024 & 2032
- Figure 30: Middle East Enterprise Mobility in Retail Industry Revenue (Million), by Device 2024 & 2032
- Figure 31: Middle East Enterprise Mobility in Retail Industry Revenue Share (%), by Device 2024 & 2032
- Figure 32: Middle East Enterprise Mobility in Retail Industry Revenue (Million), by Country 2024 & 2032
- Figure 33: Middle East Enterprise Mobility in Retail Industry Revenue Share (%), by Country 2024 & 2032
List of Tables
- Table 1: Global Enterprise Mobility in Retail Industry Revenue Million Forecast, by Region 2019 & 2032
- Table 2: Global Enterprise Mobility in Retail Industry Revenue Million Forecast, by Device 2019 & 2032
- Table 3: Global Enterprise Mobility in Retail Industry Revenue Million Forecast, by Region 2019 & 2032
- Table 4: Global Enterprise Mobility in Retail Industry Revenue Million Forecast, by Country 2019 & 2032
- Table 5: United States Enterprise Mobility in Retail Industry Revenue (Million) Forecast, by Application 2019 & 2032
- Table 6: Canada Enterprise Mobility in Retail Industry Revenue (Million) Forecast, by Application 2019 & 2032
- Table 7: Mexico Enterprise Mobility in Retail Industry Revenue (Million) Forecast, by Application 2019 & 2032
- Table 8: Global Enterprise Mobility in Retail Industry Revenue Million Forecast, by Country 2019 & 2032
- Table 9: Germany Enterprise Mobility in Retail Industry Revenue (Million) Forecast, by Application 2019 & 2032
- Table 10: United Kingdom Enterprise Mobility in Retail Industry Revenue (Million) Forecast, by Application 2019 & 2032
- Table 11: France Enterprise Mobility in Retail Industry Revenue (Million) Forecast, by Application 2019 & 2032
- Table 12: Spain Enterprise Mobility in Retail Industry Revenue (Million) Forecast, by Application 2019 & 2032
- Table 13: Italy Enterprise Mobility in Retail Industry Revenue (Million) Forecast, by Application 2019 & 2032
- Table 14: Spain Enterprise Mobility in Retail Industry Revenue (Million) Forecast, by Application 2019 & 2032
- Table 15: Belgium Enterprise Mobility in Retail Industry Revenue (Million) Forecast, by Application 2019 & 2032
- Table 16: Netherland Enterprise Mobility in Retail Industry Revenue (Million) Forecast, by Application 2019 & 2032
- Table 17: Nordics Enterprise Mobility in Retail Industry Revenue (Million) Forecast, by Application 2019 & 2032
- Table 18: Rest of Europe Enterprise Mobility in Retail Industry Revenue (Million) Forecast, by Application 2019 & 2032
- Table 19: Global Enterprise Mobility in Retail Industry Revenue Million Forecast, by Country 2019 & 2032
- Table 20: China Enterprise Mobility in Retail Industry Revenue (Million) Forecast, by Application 2019 & 2032
- Table 21: Japan Enterprise Mobility in Retail Industry Revenue (Million) Forecast, by Application 2019 & 2032
- Table 22: India Enterprise Mobility in Retail Industry Revenue (Million) Forecast, by Application 2019 & 2032
- Table 23: South Korea Enterprise Mobility in Retail Industry Revenue (Million) Forecast, by Application 2019 & 2032
- Table 24: Southeast Asia Enterprise Mobility in Retail Industry Revenue (Million) Forecast, by Application 2019 & 2032
- Table 25: Australia Enterprise Mobility in Retail Industry Revenue (Million) Forecast, by Application 2019 & 2032
- Table 26: Indonesia Enterprise Mobility in Retail Industry Revenue (Million) Forecast, by Application 2019 & 2032
- Table 27: Phillipes Enterprise Mobility in Retail Industry Revenue (Million) Forecast, by Application 2019 & 2032
- Table 28: Singapore Enterprise Mobility in Retail Industry Revenue (Million) Forecast, by Application 2019 & 2032
- Table 29: Thailandc Enterprise Mobility in Retail Industry Revenue (Million) Forecast, by Application 2019 & 2032
- Table 30: Rest of Asia Pacific Enterprise Mobility in Retail Industry Revenue (Million) Forecast, by Application 2019 & 2032
- Table 31: Global Enterprise Mobility in Retail Industry Revenue Million Forecast, by Country 2019 & 2032
- Table 32: Brazil Enterprise Mobility in Retail Industry Revenue (Million) Forecast, by Application 2019 & 2032
- Table 33: Argentina Enterprise Mobility in Retail Industry Revenue (Million) Forecast, by Application 2019 & 2032
- Table 34: Peru Enterprise Mobility in Retail Industry Revenue (Million) Forecast, by Application 2019 & 2032
- Table 35: Chile Enterprise Mobility in Retail Industry Revenue (Million) Forecast, by Application 2019 & 2032
- Table 36: Colombia Enterprise Mobility in Retail Industry Revenue (Million) Forecast, by Application 2019 & 2032
- Table 37: Ecuador Enterprise Mobility in Retail Industry Revenue (Million) Forecast, by Application 2019 & 2032
- Table 38: Venezuela Enterprise Mobility in Retail Industry Revenue (Million) Forecast, by Application 2019 & 2032
- Table 39: Rest of South America Enterprise Mobility in Retail Industry Revenue (Million) Forecast, by Application 2019 & 2032
- Table 40: Global Enterprise Mobility in Retail Industry Revenue Million Forecast, by Country 2019 & 2032
- Table 41: United States Enterprise Mobility in Retail Industry Revenue (Million) Forecast, by Application 2019 & 2032
- Table 42: Canada Enterprise Mobility in Retail Industry Revenue (Million) Forecast, by Application 2019 & 2032
- Table 43: Mexico Enterprise Mobility in Retail Industry Revenue (Million) Forecast, by Application 2019 & 2032
- Table 44: Global Enterprise Mobility in Retail Industry Revenue Million Forecast, by Country 2019 & 2032
- Table 45: United Arab Emirates Enterprise Mobility in Retail Industry Revenue (Million) Forecast, by Application 2019 & 2032
- Table 46: Saudi Arabia Enterprise Mobility in Retail Industry Revenue (Million) Forecast, by Application 2019 & 2032
- Table 47: South Africa Enterprise Mobility in Retail Industry Revenue (Million) Forecast, by Application 2019 & 2032
- Table 48: Rest of Middle East and Africa Enterprise Mobility in Retail Industry Revenue (Million) Forecast, by Application 2019 & 2032
- Table 49: Global Enterprise Mobility in Retail Industry Revenue Million Forecast, by Device 2019 & 2032
- Table 50: Global Enterprise Mobility in Retail Industry Revenue Million Forecast, by Country 2019 & 2032
- Table 51: Global Enterprise Mobility in Retail Industry Revenue Million Forecast, by Device 2019 & 2032
- Table 52: Global Enterprise Mobility in Retail Industry Revenue Million Forecast, by Country 2019 & 2032
- Table 53: Global Enterprise Mobility in Retail Industry Revenue Million Forecast, by Device 2019 & 2032
- Table 54: Global Enterprise Mobility in Retail Industry Revenue Million Forecast, by Country 2019 & 2032
- Table 55: Global Enterprise Mobility in Retail Industry Revenue Million Forecast, by Device 2019 & 2032
- Table 56: Global Enterprise Mobility in Retail Industry Revenue Million Forecast, by Country 2019 & 2032
- Table 57: Global Enterprise Mobility in Retail Industry Revenue Million Forecast, by Device 2019 & 2032
- Table 58: Global Enterprise Mobility in Retail Industry Revenue Million Forecast, by Country 2019 & 2032
Frequently Asked Questions
1. What is the projected Compound Annual Growth Rate (CAGR) of the Enterprise Mobility in Retail Industry?
The projected CAGR is approximately 26.25%.
2. Which companies are prominent players in the Enterprise Mobility in Retail Industry?
Key companies in the market include Workspot Inc , MobileIron Inc, IBM Corporation, Brainvire Infotech Inc, Cisco Systems Inc, Microsoft Corporation, Credencys Solutions Inc, InnoMind Technologies, Gizmeon Inc, VMware Inc, Citrix Systems Inc, SAP SE, Sonata Software.
3. What are the main segments of the Enterprise Mobility in Retail Industry?
The market segments include Device.
4. Can you provide details about the market size?
The market size is estimated to be USD XX Million as of 2022.
5. What are some drivers contributing to market growth?
; Substantial Growth in E-commerce; Increasing Adoption of Bring-your-own-device (BYOD).
6. What are the notable trends driving market growth?
Substantial Growth in E-commerce to Spearhead the Growth.
7. Are there any restraints impacting market growth?
; Security Concerns.
8. Can you provide examples of recent developments in the market?
N/A
9. What pricing options are available for accessing the report?
Pricing options include single-user, multi-user, and enterprise licenses priced at USD 4750, USD 5250, and USD 8750 respectively.
10. Is the market size provided in terms of value or volume?
The market size is provided in terms of value, measured in Million.
11. Are there any specific market keywords associated with the report?
Yes, the market keyword associated with the report is "Enterprise Mobility in Retail Industry," which aids in identifying and referencing the specific market segment covered.
12. How do I determine which pricing option suits my needs best?
The pricing options vary based on user requirements and access needs. Individual users may opt for single-user licenses, while businesses requiring broader access may choose multi-user or enterprise licenses for cost-effective access to the report.
13. Are there any additional resources or data provided in the Enterprise Mobility in Retail Industry report?
While the report offers comprehensive insights, it's advisable to review the specific contents or supplementary materials provided to ascertain if additional resources or data are available.
14. How can I stay updated on further developments or reports in the Enterprise Mobility in Retail Industry?
To stay informed about further developments, trends, and reports in the Enterprise Mobility in Retail Industry, consider subscribing to industry newsletters, following relevant companies and organizations, or regularly checking reputable industry news sources and publications.
Methodology
Step 1 - Identification of Relevant Samples Size from Population Database


Step 2 - Approaches for Defining Global Market Size (Value, Volume* & Price*)

Note*: In applicable scenarios
Step 3 - Data Sources
Primary Research
- Web Analytics
- Survey Reports
- Research Institute
- Latest Research Reports
- Opinion Leaders
Secondary Research
- Annual Reports
- White Paper
- Latest Press Release
- Industry Association
- Paid Database
- Investor Presentations

Step 4 - Data Triangulation
Involves using different sources of information in order to increase the validity of a study
These sources are likely to be stakeholders in a program - participants, other researchers, program staff, other community members, and so on.
Then we put all data in single framework & apply various statistical tools to find out the dynamic on the market.
During the analysis stage, feedback from the stakeholder groups would be compared to determine areas of agreement as well as areas of divergence
