

Key Insights
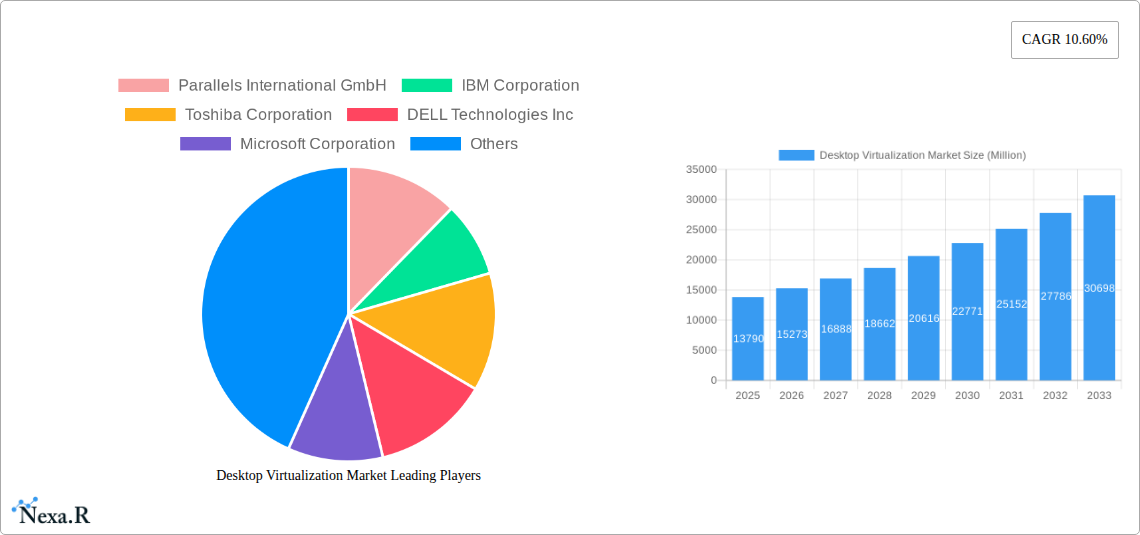
The global Desktop Virtualization market is experiencing robust growth, projected to reach a value of $13.79 billion in 2025 and maintain a Compound Annual Growth Rate (CAGR) of 10.60% from 2025 to 2033. This expansion is driven by several key factors. The increasing adoption of cloud computing and the rise of remote work models significantly fuel demand for secure and accessible virtual desktop solutions. Businesses are increasingly prioritizing enhanced security measures to protect sensitive data, leading to wider acceptance of virtualization technologies that centralize data management and control. Furthermore, the ongoing digital transformation across various sectors, including finance, healthcare, and manufacturing, is creating a significant need for efficient and scalable IT infrastructure, which Desktop Virtualization effectively provides. The market is segmented by delivery platform (Hosted Virtual Desktop, Hosted Shared Desktop, and others), deployment mode (on-premise and cloud), and end-user vertical (Financial Services, Healthcare, Manufacturing, IT & Telecommunications, and others). The cloud deployment segment is expected to witness the highest growth due to its inherent scalability, cost-effectiveness, and accessibility benefits.
The competitive landscape is dynamic, with major players like Citrix Systems Inc., Microsoft Corporation, and VMware (implied by the presence of related companies like Parallels and Red Hat) vying for market share. Geographic growth varies, with North America and Europe currently dominating the market due to high technological adoption rates and established IT infrastructure. However, rapid digitalization in Asia-Pacific and other emerging regions is projected to drive significant market growth in the coming years. While challenges such as the initial investment costs and the complexity of implementation can act as restraints, the long-term benefits of improved security, scalability, and cost optimization are expected to outweigh these hurdles, resulting in continued market expansion. The market is anticipated to witness innovation in areas such as AI-powered optimization and enhanced security protocols, further fueling market growth beyond 2033.
Desktop Virtualization Market Report: 2019-2033
This comprehensive report provides a detailed analysis of the Desktop Virtualization Market, encompassing its dynamics, growth trends, dominant segments, and key players. The study period spans from 2019 to 2033, with 2025 serving as the base and estimated year. The report offers invaluable insights for industry professionals, investors, and strategic decision-makers seeking to understand and capitalize on the opportunities within this rapidly evolving market. The market is segmented by Desktop Delivery Platform (Hosted Virtual Desktop (HVD), Hosted Shared Desktop (HSD), Other Desktop Delivery Forms), Deployment Mode (On-premise, Cloud), and End-User Vertical (Financial Services, Healthcare, Manufacturing, IT & Telecommunications, Other End-User Verticals). The total market size is projected to reach xx Million units by 2033.
Desktop Virtualization Market Dynamics & Structure
The Desktop Virtualization Market is characterized by moderate concentration, with key players such as Citrix Systems Inc, Microsoft Corporation, and VMware (not explicitly listed but a major player) holding significant market share. The market is driven by technological innovations, particularly in cloud computing and security enhancements, alongside increasing demand for remote work solutions. Regulatory frameworks, particularly those concerning data privacy and security, significantly influence market dynamics. The emergence of cloud-based solutions acts as a competitive substitute for traditional on-premise deployments. End-user demographics are shifting towards a more dispersed and mobile workforce, fueling the demand for flexible and accessible virtual desktops. M&A activity within the sector is relatively frequent, reflecting consolidation efforts and the pursuit of technological synergies. The market is expected to see xx Million units sold in 2025, with a CAGR of xx% from 2025 to 2033.
- Market Concentration: Moderately concentrated, with top players holding approximately xx% market share in 2025.
- Technological Innovation: Cloud computing, enhanced security features, and AI-powered management tools are key drivers.
- Regulatory Frameworks: Data privacy regulations (GDPR, CCPA) influence security and compliance aspects.
- Competitive Substitutes: Cloud-based solutions pose a significant competitive threat to on-premise deployments.
- End-User Demographics: A growing remote and mobile workforce fuels demand for accessible virtual desktops.
- M&A Trends: Approximately xx M&A deals were recorded between 2019 and 2024, with an expected increase in the forecast period.
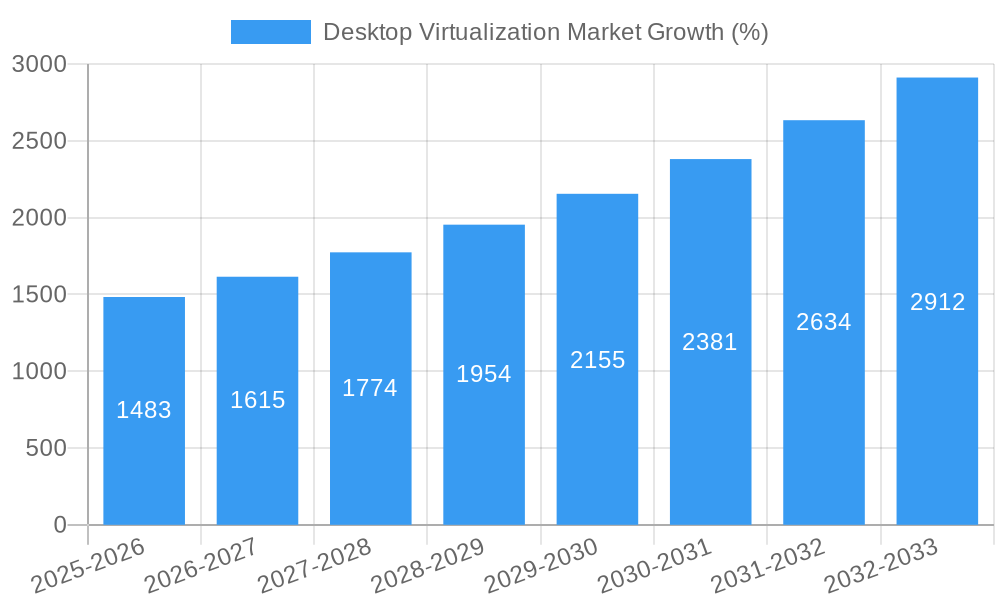
Desktop Virtualization Market Growth Trends & Insights
The Desktop Virtualization Market exhibits substantial growth, driven by factors like the increasing adoption of remote work models, the rise of cloud-based solutions, and the need for enhanced security and scalability. The market size has witnessed significant expansion from xx Million units in 2019 to an estimated xx Million units in 2025, reflecting a notable CAGR of xx% during the historical period (2019-2024). Technological disruptions, particularly the maturation of cloud computing and the adoption of 5G, are accelerating market growth. Shifting consumer behavior, with an increasing preference for flexible and accessible work environments, further supports market expansion. The forecast period (2025-2033) anticipates continued growth, reaching an estimated xx Million units by 2033, reflecting a projected CAGR of xx%. Market penetration is expected to increase significantly, driven by the widespread adoption of virtual desktop solutions across various industry verticals.
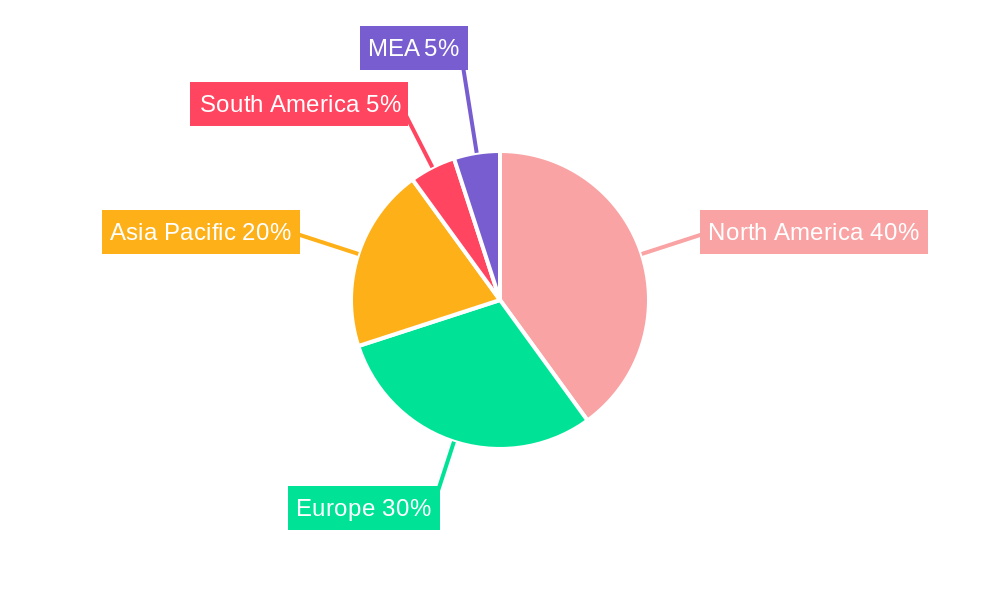
Dominant Regions, Countries, or Segments in Desktop Virtualization Market
North America currently holds the largest market share, driven by factors such as early adoption of virtualization technologies, strong IT infrastructure, and the presence of major technology companies. Within North America, the United States dominates due to its mature IT sector and high spending on IT infrastructure. Europe is another significant market, showing consistent growth, driven by the increasing adoption of cloud-based solutions and government initiatives to enhance digitalization. Asia-Pacific presents a high growth potential, driven by rapid economic growth, increasing internet penetration, and government-led initiatives to promote digital transformation. The Cloud deployment mode is predicted to exhibit faster growth, driven by its scalability and cost-effectiveness. Hosted Virtual Desktops (HVD) are also experiencing strong growth due to their enhanced security and manageability compared to other desktop delivery forms. The Financial Services and Healthcare sectors are key end-user verticals, fueled by strict security requirements and the need for remote access to sensitive data.
- North America (Dominant Region): Strong IT infrastructure, early adoption of technologies, and presence of major technology firms.
- Cloud Deployment Mode (Fastest Growing Segment): Scalability, cost-effectiveness, and accessibility advantages.
- Hosted Virtual Desktops (HVD) (High Growth Segment): Enhanced security and manageability features.
- Financial Services and Healthcare (Key End-User Verticals): Strict security requirements and need for remote access.
Desktop Virtualization Market Product Landscape
The Desktop Virtualization Market offers a diverse range of products, including hosted virtual desktops (HVDs), hosted shared desktops (HSDs), and various cloud-based and on-premise solutions. These solutions differ in terms of their deployment models, security features, and scalability options. Key product innovations include AI-powered management tools, improved security protocols, and enhanced user experience features. The key selling propositions of various solutions focus on seamless access, increased security, cost optimization, and ease of management. Technological advancements center around improved performance, integration with cloud services, and support for diverse devices and operating systems.
Key Drivers, Barriers & Challenges in Desktop Virtualization Market
Key Drivers:
- Growing demand for remote work solutions.
- Increasing adoption of cloud computing.
- Enhanced security needs.
- Need for improved operational efficiency.
Key Challenges & Restraints:
- High initial investment costs.
- Complexity of implementation.
- Security concerns regarding data breaches.
- Dependence on robust network infrastructure. A significant 20% of deployments fail due to insufficient bandwidth, impacting xx Million units.
Emerging Opportunities in Desktop Virtualization Market
- Expansion into emerging markets with growing internet penetration.
- Integration with emerging technologies like AI and IoT.
- Development of specialized solutions for specific industry verticals (e.g., healthcare, education).
- Focus on improving user experience and simplifying management.
Growth Accelerators in the Desktop Virtualization Market Industry
Technological breakthroughs such as the advent of 5G and advancements in cloud computing are driving market growth. Strategic partnerships between technology providers and cloud service providers are facilitating wider market penetration. Expansion into emerging economies with a growing need for digital infrastructure represents a significant opportunity for growth.
Key Players Shaping the Desktop Virtualization Market Market
- Parallels International GmbH
- IBM Corporation
- Toshiba Corporation
- DELL Technologies Inc
- Microsoft Corporation
- Red Hat Inc
- NComputing Co Ltd
- Huawei Technologies Co Ltd
- Ericom Software Inc
- Citrix Systems Inc
Notable Milestones in Desktop Virtualization Market Sector
- November 2023: IGEL and Imprivata announced an integrated solution for multi-factor authentication (MFA) and single sign-on (SSO) for virtual desktops. This enhances security and improves user experience for healthcare applications.
- April 2023: Virtual Cable and Huawei Cloud partnered to boost public cloud adoption in digital workplaces, improving security and productivity. This collaboration strengthens the cloud-based desktop virtualization market.
In-Depth Desktop Virtualization Market Market Outlook
The Desktop Virtualization Market is poised for sustained growth, driven by the continued adoption of remote work models, increased demand for secure access to corporate resources, and advancements in cloud technologies. Strategic partnerships and innovative product developments will play a crucial role in shaping the future of the market. Expanding into underserved markets and developing solutions tailored to specific industries will open up new avenues for growth and market expansion. The long-term outlook is positive, with significant opportunities for market expansion and technological innovation.
Desktop Virtualization Market Segmentation
-
1. Desktop Delivery Platform
- 1.1. Hosted Virtual Desktop (HVD)
- 1.2. Hosted Shared Desktop (HSD)
- 1.3. Other Desktop Delivery Forms
-
2. Deployment Mode
- 2.1. On-premise
- 2.2. Cloud
-
3. End-User Vertical
- 3.1. Financial Services
- 3.2. Healthcare
- 3.3. Manufacturing
- 3.4. IT & Telecommunications
- 3.5. Other End-User Verticals
Desktop Virtualization Market Segmentation By Geography
- 1. North America
- 2. Europe
- 3. Asia Pacific
- 4. Latin America
- 5. Middle East and Africa
Desktop Virtualization Market REPORT HIGHLIGHTS
| Aspects | Details |
|---|---|
| Study Period | 2019-2033 |
| Base Year | 2024 |
| Estimated Year | 2025 |
| Forecast Period | 2025-2033 |
| Historical Period | 2019-2024 |
| Growth Rate | CAGR of 10.60% from 2019-2033 |
| Segmentation |
|
Table of Contents
- 1. Introduction
- 1.1. Research Scope
- 1.2. Market Segmentation
- 1.3. Research Methodology
- 1.4. Definitions and Assumptions
- 2. Executive Summary
- 2.1. Introduction
- 3. Market Dynamics
- 3.1. Introduction
- 3.2. Market Drivers
- 3.2.1. Increasing Demand for Bring Your Own Device; Growing Adoption of Cloud Computing
- 3.3. Market Restrains
- 3.3.1. Infrastructural Constraints
- 3.4. Market Trends
- 3.4.1. Cloud Deployment Mode is Expected to Witness Significant Growth
- 4. Market Factor Analysis
- 4.1. Porters Five Forces
- 4.2. Supply/Value Chain
- 4.3. PESTEL analysis
- 4.4. Market Entropy
- 4.5. Patent/Trademark Analysis
- 5. Global Desktop Virtualization Market Analysis, Insights and Forecast, 2019-2031
- 5.1. Market Analysis, Insights and Forecast - by Desktop Delivery Platform
- 5.1.1. Hosted Virtual Desktop (HVD)
- 5.1.2. Hosted Shared Desktop (HSD)
- 5.1.3. Other Desktop Delivery Forms
- 5.2. Market Analysis, Insights and Forecast - by Deployment Mode
- 5.2.1. On-premise
- 5.2.2. Cloud
- 5.3. Market Analysis, Insights and Forecast - by End-User Vertical
- 5.3.1. Financial Services
- 5.3.2. Healthcare
- 5.3.3. Manufacturing
- 5.3.4. IT & Telecommunications
- 5.3.5. Other End-User Verticals
- 5.4. Market Analysis, Insights and Forecast - by Region
- 5.4.1. North America
- 5.4.2. Europe
- 5.4.3. Asia Pacific
- 5.4.4. Latin America
- 5.4.5. Middle East and Africa
- 5.1. Market Analysis, Insights and Forecast - by Desktop Delivery Platform
- 6. North America Desktop Virtualization Market Analysis, Insights and Forecast, 2019-2031
- 6.1. Market Analysis, Insights and Forecast - by Desktop Delivery Platform
- 6.1.1. Hosted Virtual Desktop (HVD)
- 6.1.2. Hosted Shared Desktop (HSD)
- 6.1.3. Other Desktop Delivery Forms
- 6.2. Market Analysis, Insights and Forecast - by Deployment Mode
- 6.2.1. On-premise
- 6.2.2. Cloud
- 6.3. Market Analysis, Insights and Forecast - by End-User Vertical
- 6.3.1. Financial Services
- 6.3.2. Healthcare
- 6.3.3. Manufacturing
- 6.3.4. IT & Telecommunications
- 6.3.5. Other End-User Verticals
- 6.1. Market Analysis, Insights and Forecast - by Desktop Delivery Platform
- 7. Europe Desktop Virtualization Market Analysis, Insights and Forecast, 2019-2031
- 7.1. Market Analysis, Insights and Forecast - by Desktop Delivery Platform
- 7.1.1. Hosted Virtual Desktop (HVD)
- 7.1.2. Hosted Shared Desktop (HSD)
- 7.1.3. Other Desktop Delivery Forms
- 7.2. Market Analysis, Insights and Forecast - by Deployment Mode
- 7.2.1. On-premise
- 7.2.2. Cloud
- 7.3. Market Analysis, Insights and Forecast - by End-User Vertical
- 7.3.1. Financial Services
- 7.3.2. Healthcare
- 7.3.3. Manufacturing
- 7.3.4. IT & Telecommunications
- 7.3.5. Other End-User Verticals
- 7.1. Market Analysis, Insights and Forecast - by Desktop Delivery Platform
- 8. Asia Pacific Desktop Virtualization Market Analysis, Insights and Forecast, 2019-2031
- 8.1. Market Analysis, Insights and Forecast - by Desktop Delivery Platform
- 8.1.1. Hosted Virtual Desktop (HVD)
- 8.1.2. Hosted Shared Desktop (HSD)
- 8.1.3. Other Desktop Delivery Forms
- 8.2. Market Analysis, Insights and Forecast - by Deployment Mode
- 8.2.1. On-premise
- 8.2.2. Cloud
- 8.3. Market Analysis, Insights and Forecast - by End-User Vertical
- 8.3.1. Financial Services
- 8.3.2. Healthcare
- 8.3.3. Manufacturing
- 8.3.4. IT & Telecommunications
- 8.3.5. Other End-User Verticals
- 8.1. Market Analysis, Insights and Forecast - by Desktop Delivery Platform
- 9. Latin America Desktop Virtualization Market Analysis, Insights and Forecast, 2019-2031
- 9.1. Market Analysis, Insights and Forecast - by Desktop Delivery Platform
- 9.1.1. Hosted Virtual Desktop (HVD)
- 9.1.2. Hosted Shared Desktop (HSD)
- 9.1.3. Other Desktop Delivery Forms
- 9.2. Market Analysis, Insights and Forecast - by Deployment Mode
- 9.2.1. On-premise
- 9.2.2. Cloud
- 9.3. Market Analysis, Insights and Forecast - by End-User Vertical
- 9.3.1. Financial Services
- 9.3.2. Healthcare
- 9.3.3. Manufacturing
- 9.3.4. IT & Telecommunications
- 9.3.5. Other End-User Verticals
- 9.1. Market Analysis, Insights and Forecast - by Desktop Delivery Platform
- 10. Middle East and Africa Desktop Virtualization Market Analysis, Insights and Forecast, 2019-2031
- 10.1. Market Analysis, Insights and Forecast - by Desktop Delivery Platform
- 10.1.1. Hosted Virtual Desktop (HVD)
- 10.1.2. Hosted Shared Desktop (HSD)
- 10.1.3. Other Desktop Delivery Forms
- 10.2. Market Analysis, Insights and Forecast - by Deployment Mode
- 10.2.1. On-premise
- 10.2.2. Cloud
- 10.3. Market Analysis, Insights and Forecast - by End-User Vertical
- 10.3.1. Financial Services
- 10.3.2. Healthcare
- 10.3.3. Manufacturing
- 10.3.4. IT & Telecommunications
- 10.3.5. Other End-User Verticals
- 10.1. Market Analysis, Insights and Forecast - by Desktop Delivery Platform
- 11. North America Desktop Virtualization Market Analysis, Insights and Forecast, 2019-2031
- 11.1. Market Analysis, Insights and Forecast - By Country/Sub-region
- 11.1.1 United States
- 11.1.2 Canada
- 11.1.3 Mexico
- 12. Europe Desktop Virtualization Market Analysis, Insights and Forecast, 2019-2031
- 12.1. Market Analysis, Insights and Forecast - By Country/Sub-region
- 12.1.1 Germany
- 12.1.2 United Kingdom
- 12.1.3 France
- 12.1.4 Spain
- 12.1.5 Italy
- 12.1.6 Spain
- 12.1.7 Belgium
- 12.1.8 Netherland
- 12.1.9 Nordics
- 12.1.10 Rest of Europe
- 13. Asia Pacific Desktop Virtualization Market Analysis, Insights and Forecast, 2019-2031
- 13.1. Market Analysis, Insights and Forecast - By Country/Sub-region
- 13.1.1 China
- 13.1.2 Japan
- 13.1.3 India
- 13.1.4 South Korea
- 13.1.5 Southeast Asia
- 13.1.6 Australia
- 13.1.7 Indonesia
- 13.1.8 Phillipes
- 13.1.9 Singapore
- 13.1.10 Thailandc
- 13.1.11 Rest of Asia Pacific
- 14. South America Desktop Virtualization Market Analysis, Insights and Forecast, 2019-2031
- 14.1. Market Analysis, Insights and Forecast - By Country/Sub-region
- 14.1.1 Brazil
- 14.1.2 Argentina
- 14.1.3 Peru
- 14.1.4 Chile
- 14.1.5 Colombia
- 14.1.6 Ecuador
- 14.1.7 Venezuela
- 14.1.8 Rest of South America
- 15. North America Desktop Virtualization Market Analysis, Insights and Forecast, 2019-2031
- 15.1. Market Analysis, Insights and Forecast - By Country/Sub-region
- 15.1.1 United States
- 15.1.2 Canada
- 15.1.3 Mexico
- 16. MEA Desktop Virtualization Market Analysis, Insights and Forecast, 2019-2031
- 16.1. Market Analysis, Insights and Forecast - By Country/Sub-region
- 16.1.1 United Arab Emirates
- 16.1.2 Saudi Arabia
- 16.1.3 South Africa
- 16.1.4 Rest of Middle East and Africa
- 17. Competitive Analysis
- 17.1. Global Market Share Analysis 2024
- 17.2. Company Profiles
- 17.2.1 Parallels International GmbH
- 17.2.1.1. Overview
- 17.2.1.2. Products
- 17.2.1.3. SWOT Analysis
- 17.2.1.4. Recent Developments
- 17.2.1.5. Financials (Based on Availability)
- 17.2.2 IBM Corporation
- 17.2.2.1. Overview
- 17.2.2.2. Products
- 17.2.2.3. SWOT Analysis
- 17.2.2.4. Recent Developments
- 17.2.2.5. Financials (Based on Availability)
- 17.2.3 Toshiba Corporation
- 17.2.3.1. Overview
- 17.2.3.2. Products
- 17.2.3.3. SWOT Analysis
- 17.2.3.4. Recent Developments
- 17.2.3.5. Financials (Based on Availability)
- 17.2.4 DELL Technologies Inc
- 17.2.4.1. Overview
- 17.2.4.2. Products
- 17.2.4.3. SWOT Analysis
- 17.2.4.4. Recent Developments
- 17.2.4.5. Financials (Based on Availability)
- 17.2.5 Microsoft Corporation
- 17.2.5.1. Overview
- 17.2.5.2. Products
- 17.2.5.3. SWOT Analysis
- 17.2.5.4. Recent Developments
- 17.2.5.5. Financials (Based on Availability)
- 17.2.6 Red Hat Inc
- 17.2.6.1. Overview
- 17.2.6.2. Products
- 17.2.6.3. SWOT Analysis
- 17.2.6.4. Recent Developments
- 17.2.6.5. Financials (Based on Availability)
- 17.2.7 NComputing Co Ltd
- 17.2.7.1. Overview
- 17.2.7.2. Products
- 17.2.7.3. SWOT Analysis
- 17.2.7.4. Recent Developments
- 17.2.7.5. Financials (Based on Availability)
- 17.2.8 Huawei Technologies Co Ltd
- 17.2.8.1. Overview
- 17.2.8.2. Products
- 17.2.8.3. SWOT Analysis
- 17.2.8.4. Recent Developments
- 17.2.8.5. Financials (Based on Availability)
- 17.2.9 Ericom Software Inc
- 17.2.9.1. Overview
- 17.2.9.2. Products
- 17.2.9.3. SWOT Analysis
- 17.2.9.4. Recent Developments
- 17.2.9.5. Financials (Based on Availability)
- 17.2.10 Citrix Systems Inc
- 17.2.10.1. Overview
- 17.2.10.2. Products
- 17.2.10.3. SWOT Analysis
- 17.2.10.4. Recent Developments
- 17.2.10.5. Financials (Based on Availability)
- 17.2.1 Parallels International GmbH
List of Figures
- Figure 1: Global Desktop Virtualization Market Revenue Breakdown (Million, %) by Region 2024 & 2032
- Figure 2: North America Desktop Virtualization Market Revenue (Million), by Country 2024 & 2032
- Figure 3: North America Desktop Virtualization Market Revenue Share (%), by Country 2024 & 2032
- Figure 4: Europe Desktop Virtualization Market Revenue (Million), by Country 2024 & 2032
- Figure 5: Europe Desktop Virtualization Market Revenue Share (%), by Country 2024 & 2032
- Figure 6: Asia Pacific Desktop Virtualization Market Revenue (Million), by Country 2024 & 2032
- Figure 7: Asia Pacific Desktop Virtualization Market Revenue Share (%), by Country 2024 & 2032
- Figure 8: South America Desktop Virtualization Market Revenue (Million), by Country 2024 & 2032
- Figure 9: South America Desktop Virtualization Market Revenue Share (%), by Country 2024 & 2032
- Figure 10: North America Desktop Virtualization Market Revenue (Million), by Country 2024 & 2032
- Figure 11: North America Desktop Virtualization Market Revenue Share (%), by Country 2024 & 2032
- Figure 12: MEA Desktop Virtualization Market Revenue (Million), by Country 2024 & 2032
- Figure 13: MEA Desktop Virtualization Market Revenue Share (%), by Country 2024 & 2032
- Figure 14: North America Desktop Virtualization Market Revenue (Million), by Desktop Delivery Platform 2024 & 2032
- Figure 15: North America Desktop Virtualization Market Revenue Share (%), by Desktop Delivery Platform 2024 & 2032
- Figure 16: North America Desktop Virtualization Market Revenue (Million), by Deployment Mode 2024 & 2032
- Figure 17: North America Desktop Virtualization Market Revenue Share (%), by Deployment Mode 2024 & 2032
- Figure 18: North America Desktop Virtualization Market Revenue (Million), by End-User Vertical 2024 & 2032
- Figure 19: North America Desktop Virtualization Market Revenue Share (%), by End-User Vertical 2024 & 2032
- Figure 20: North America Desktop Virtualization Market Revenue (Million), by Country 2024 & 2032
- Figure 21: North America Desktop Virtualization Market Revenue Share (%), by Country 2024 & 2032
- Figure 22: Europe Desktop Virtualization Market Revenue (Million), by Desktop Delivery Platform 2024 & 2032
- Figure 23: Europe Desktop Virtualization Market Revenue Share (%), by Desktop Delivery Platform 2024 & 2032
- Figure 24: Europe Desktop Virtualization Market Revenue (Million), by Deployment Mode 2024 & 2032
- Figure 25: Europe Desktop Virtualization Market Revenue Share (%), by Deployment Mode 2024 & 2032
- Figure 26: Europe Desktop Virtualization Market Revenue (Million), by End-User Vertical 2024 & 2032
- Figure 27: Europe Desktop Virtualization Market Revenue Share (%), by End-User Vertical 2024 & 2032
- Figure 28: Europe Desktop Virtualization Market Revenue (Million), by Country 2024 & 2032
- Figure 29: Europe Desktop Virtualization Market Revenue Share (%), by Country 2024 & 2032
- Figure 30: Asia Pacific Desktop Virtualization Market Revenue (Million), by Desktop Delivery Platform 2024 & 2032
- Figure 31: Asia Pacific Desktop Virtualization Market Revenue Share (%), by Desktop Delivery Platform 2024 & 2032
- Figure 32: Asia Pacific Desktop Virtualization Market Revenue (Million), by Deployment Mode 2024 & 2032
- Figure 33: Asia Pacific Desktop Virtualization Market Revenue Share (%), by Deployment Mode 2024 & 2032
- Figure 34: Asia Pacific Desktop Virtualization Market Revenue (Million), by End-User Vertical 2024 & 2032
- Figure 35: Asia Pacific Desktop Virtualization Market Revenue Share (%), by End-User Vertical 2024 & 2032
- Figure 36: Asia Pacific Desktop Virtualization Market Revenue (Million), by Country 2024 & 2032
- Figure 37: Asia Pacific Desktop Virtualization Market Revenue Share (%), by Country 2024 & 2032
- Figure 38: Latin America Desktop Virtualization Market Revenue (Million), by Desktop Delivery Platform 2024 & 2032
- Figure 39: Latin America Desktop Virtualization Market Revenue Share (%), by Desktop Delivery Platform 2024 & 2032
- Figure 40: Latin America Desktop Virtualization Market Revenue (Million), by Deployment Mode 2024 & 2032
- Figure 41: Latin America Desktop Virtualization Market Revenue Share (%), by Deployment Mode 2024 & 2032
- Figure 42: Latin America Desktop Virtualization Market Revenue (Million), by End-User Vertical 2024 & 2032
- Figure 43: Latin America Desktop Virtualization Market Revenue Share (%), by End-User Vertical 2024 & 2032
- Figure 44: Latin America Desktop Virtualization Market Revenue (Million), by Country 2024 & 2032
- Figure 45: Latin America Desktop Virtualization Market Revenue Share (%), by Country 2024 & 2032
- Figure 46: Middle East and Africa Desktop Virtualization Market Revenue (Million), by Desktop Delivery Platform 2024 & 2032
- Figure 47: Middle East and Africa Desktop Virtualization Market Revenue Share (%), by Desktop Delivery Platform 2024 & 2032
- Figure 48: Middle East and Africa Desktop Virtualization Market Revenue (Million), by Deployment Mode 2024 & 2032
- Figure 49: Middle East and Africa Desktop Virtualization Market Revenue Share (%), by Deployment Mode 2024 & 2032
- Figure 50: Middle East and Africa Desktop Virtualization Market Revenue (Million), by End-User Vertical 2024 & 2032
- Figure 51: Middle East and Africa Desktop Virtualization Market Revenue Share (%), by End-User Vertical 2024 & 2032
- Figure 52: Middle East and Africa Desktop Virtualization Market Revenue (Million), by Country 2024 & 2032
- Figure 53: Middle East and Africa Desktop Virtualization Market Revenue Share (%), by Country 2024 & 2032
List of Tables
- Table 1: Global Desktop Virtualization Market Revenue Million Forecast, by Region 2019 & 2032
- Table 2: Global Desktop Virtualization Market Revenue Million Forecast, by Desktop Delivery Platform 2019 & 2032
- Table 3: Global Desktop Virtualization Market Revenue Million Forecast, by Deployment Mode 2019 & 2032
- Table 4: Global Desktop Virtualization Market Revenue Million Forecast, by End-User Vertical 2019 & 2032
- Table 5: Global Desktop Virtualization Market Revenue Million Forecast, by Region 2019 & 2032
- Table 6: Global Desktop Virtualization Market Revenue Million Forecast, by Country 2019 & 2032
- Table 7: United States Desktop Virtualization Market Revenue (Million) Forecast, by Application 2019 & 2032
- Table 8: Canada Desktop Virtualization Market Revenue (Million) Forecast, by Application 2019 & 2032
- Table 9: Mexico Desktop Virtualization Market Revenue (Million) Forecast, by Application 2019 & 2032
- Table 10: Global Desktop Virtualization Market Revenue Million Forecast, by Country 2019 & 2032
- Table 11: Germany Desktop Virtualization Market Revenue (Million) Forecast, by Application 2019 & 2032
- Table 12: United Kingdom Desktop Virtualization Market Revenue (Million) Forecast, by Application 2019 & 2032
- Table 13: France Desktop Virtualization Market Revenue (Million) Forecast, by Application 2019 & 2032
- Table 14: Spain Desktop Virtualization Market Revenue (Million) Forecast, by Application 2019 & 2032
- Table 15: Italy Desktop Virtualization Market Revenue (Million) Forecast, by Application 2019 & 2032
- Table 16: Spain Desktop Virtualization Market Revenue (Million) Forecast, by Application 2019 & 2032
- Table 17: Belgium Desktop Virtualization Market Revenue (Million) Forecast, by Application 2019 & 2032
- Table 18: Netherland Desktop Virtualization Market Revenue (Million) Forecast, by Application 2019 & 2032
- Table 19: Nordics Desktop Virtualization Market Revenue (Million) Forecast, by Application 2019 & 2032
- Table 20: Rest of Europe Desktop Virtualization Market Revenue (Million) Forecast, by Application 2019 & 2032
- Table 21: Global Desktop Virtualization Market Revenue Million Forecast, by Country 2019 & 2032
- Table 22: China Desktop Virtualization Market Revenue (Million) Forecast, by Application 2019 & 2032
- Table 23: Japan Desktop Virtualization Market Revenue (Million) Forecast, by Application 2019 & 2032
- Table 24: India Desktop Virtualization Market Revenue (Million) Forecast, by Application 2019 & 2032
- Table 25: South Korea Desktop Virtualization Market Revenue (Million) Forecast, by Application 2019 & 2032
- Table 26: Southeast Asia Desktop Virtualization Market Revenue (Million) Forecast, by Application 2019 & 2032
- Table 27: Australia Desktop Virtualization Market Revenue (Million) Forecast, by Application 2019 & 2032
- Table 28: Indonesia Desktop Virtualization Market Revenue (Million) Forecast, by Application 2019 & 2032
- Table 29: Phillipes Desktop Virtualization Market Revenue (Million) Forecast, by Application 2019 & 2032
- Table 30: Singapore Desktop Virtualization Market Revenue (Million) Forecast, by Application 2019 & 2032
- Table 31: Thailandc Desktop Virtualization Market Revenue (Million) Forecast, by Application 2019 & 2032
- Table 32: Rest of Asia Pacific Desktop Virtualization Market Revenue (Million) Forecast, by Application 2019 & 2032
- Table 33: Global Desktop Virtualization Market Revenue Million Forecast, by Country 2019 & 2032
- Table 34: Brazil Desktop Virtualization Market Revenue (Million) Forecast, by Application 2019 & 2032
- Table 35: Argentina Desktop Virtualization Market Revenue (Million) Forecast, by Application 2019 & 2032
- Table 36: Peru Desktop Virtualization Market Revenue (Million) Forecast, by Application 2019 & 2032
- Table 37: Chile Desktop Virtualization Market Revenue (Million) Forecast, by Application 2019 & 2032
- Table 38: Colombia Desktop Virtualization Market Revenue (Million) Forecast, by Application 2019 & 2032
- Table 39: Ecuador Desktop Virtualization Market Revenue (Million) Forecast, by Application 2019 & 2032
- Table 40: Venezuela Desktop Virtualization Market Revenue (Million) Forecast, by Application 2019 & 2032
- Table 41: Rest of South America Desktop Virtualization Market Revenue (Million) Forecast, by Application 2019 & 2032
- Table 42: Global Desktop Virtualization Market Revenue Million Forecast, by Country 2019 & 2032
- Table 43: United States Desktop Virtualization Market Revenue (Million) Forecast, by Application 2019 & 2032
- Table 44: Canada Desktop Virtualization Market Revenue (Million) Forecast, by Application 2019 & 2032
- Table 45: Mexico Desktop Virtualization Market Revenue (Million) Forecast, by Application 2019 & 2032
- Table 46: Global Desktop Virtualization Market Revenue Million Forecast, by Country 2019 & 2032
- Table 47: United Arab Emirates Desktop Virtualization Market Revenue (Million) Forecast, by Application 2019 & 2032
- Table 48: Saudi Arabia Desktop Virtualization Market Revenue (Million) Forecast, by Application 2019 & 2032
- Table 49: South Africa Desktop Virtualization Market Revenue (Million) Forecast, by Application 2019 & 2032
- Table 50: Rest of Middle East and Africa Desktop Virtualization Market Revenue (Million) Forecast, by Application 2019 & 2032
- Table 51: Global Desktop Virtualization Market Revenue Million Forecast, by Desktop Delivery Platform 2019 & 2032
- Table 52: Global Desktop Virtualization Market Revenue Million Forecast, by Deployment Mode 2019 & 2032
- Table 53: Global Desktop Virtualization Market Revenue Million Forecast, by End-User Vertical 2019 & 2032
- Table 54: Global Desktop Virtualization Market Revenue Million Forecast, by Country 2019 & 2032
- Table 55: Global Desktop Virtualization Market Revenue Million Forecast, by Desktop Delivery Platform 2019 & 2032
- Table 56: Global Desktop Virtualization Market Revenue Million Forecast, by Deployment Mode 2019 & 2032
- Table 57: Global Desktop Virtualization Market Revenue Million Forecast, by End-User Vertical 2019 & 2032
- Table 58: Global Desktop Virtualization Market Revenue Million Forecast, by Country 2019 & 2032
- Table 59: Global Desktop Virtualization Market Revenue Million Forecast, by Desktop Delivery Platform 2019 & 2032
- Table 60: Global Desktop Virtualization Market Revenue Million Forecast, by Deployment Mode 2019 & 2032
- Table 61: Global Desktop Virtualization Market Revenue Million Forecast, by End-User Vertical 2019 & 2032
- Table 62: Global Desktop Virtualization Market Revenue Million Forecast, by Country 2019 & 2032
- Table 63: Global Desktop Virtualization Market Revenue Million Forecast, by Desktop Delivery Platform 2019 & 2032
- Table 64: Global Desktop Virtualization Market Revenue Million Forecast, by Deployment Mode 2019 & 2032
- Table 65: Global Desktop Virtualization Market Revenue Million Forecast, by End-User Vertical 2019 & 2032
- Table 66: Global Desktop Virtualization Market Revenue Million Forecast, by Country 2019 & 2032
- Table 67: Global Desktop Virtualization Market Revenue Million Forecast, by Desktop Delivery Platform 2019 & 2032
- Table 68: Global Desktop Virtualization Market Revenue Million Forecast, by Deployment Mode 2019 & 2032
- Table 69: Global Desktop Virtualization Market Revenue Million Forecast, by End-User Vertical 2019 & 2032
- Table 70: Global Desktop Virtualization Market Revenue Million Forecast, by Country 2019 & 2032
Frequently Asked Questions
1. What is the projected Compound Annual Growth Rate (CAGR) of the Desktop Virtualization Market?
The projected CAGR is approximately 10.60%.
2. Which companies are prominent players in the Desktop Virtualization Market?
Key companies in the market include Parallels International GmbH, IBM Corporation, Toshiba Corporation, DELL Technologies Inc, Microsoft Corporation, Red Hat Inc, NComputing Co Ltd, Huawei Technologies Co Ltd, Ericom Software Inc , Citrix Systems Inc.
3. What are the main segments of the Desktop Virtualization Market?
The market segments include Desktop Delivery Platform, Deployment Mode, End-User Vertical.
4. Can you provide details about the market size?
The market size is estimated to be USD 13.79 Million as of 2022.
5. What are some drivers contributing to market growth?
Increasing Demand for Bring Your Own Device; Growing Adoption of Cloud Computing.
6. What are the notable trends driving market growth?
Cloud Deployment Mode is Expected to Witness Significant Growth.
7. Are there any restraints impacting market growth?
Infrastructural Constraints.
8. Can you provide examples of recent developments in the market?
November 2023 - IGEL, a provider of the managed endpoint operating system for secured access to any digital workspace, and Imprivata announced the availability of an integrated solution for IGEL and Imprivata consumers that enables multi-factor authentication (MFA) and single sign-on (SSO) for clinicians accessing their virtual apps and desktops. The new IGEL Agent for Imprivata OneSign Enterprise Access Management enables and controls digital identities with secure, no-click access to Microsoft Azure Virtual Desktop (AVD) and Windows 365 Cloud PC cloud resources.
9. What pricing options are available for accessing the report?
Pricing options include single-user, multi-user, and enterprise licenses priced at USD 4750, USD 5250, and USD 8750 respectively.
10. Is the market size provided in terms of value or volume?
The market size is provided in terms of value, measured in Million.
11. Are there any specific market keywords associated with the report?
Yes, the market keyword associated with the report is "Desktop Virtualization Market," which aids in identifying and referencing the specific market segment covered.
12. How do I determine which pricing option suits my needs best?
The pricing options vary based on user requirements and access needs. Individual users may opt for single-user licenses, while businesses requiring broader access may choose multi-user or enterprise licenses for cost-effective access to the report.
13. Are there any additional resources or data provided in the Desktop Virtualization Market report?
While the report offers comprehensive insights, it's advisable to review the specific contents or supplementary materials provided to ascertain if additional resources or data are available.
14. How can I stay updated on further developments or reports in the Desktop Virtualization Market?
To stay informed about further developments, trends, and reports in the Desktop Virtualization Market, consider subscribing to industry newsletters, following relevant companies and organizations, or regularly checking reputable industry news sources and publications.
Methodology
Step 1 - Identification of Relevant Samples Size from Population Database


Step 2 - Approaches for Defining Global Market Size (Value, Volume* & Price*)

Note*: In applicable scenarios
Step 3 - Data Sources
Primary Research
- Web Analytics
- Survey Reports
- Research Institute
- Latest Research Reports
- Opinion Leaders
Secondary Research
- Annual Reports
- White Paper
- Latest Press Release
- Industry Association
- Paid Database
- Investor Presentations

Step 4 - Data Triangulation
Involves using different sources of information in order to increase the validity of a study
These sources are likely to be stakeholders in a program - participants, other researchers, program staff, other community members, and so on.
Then we put all data in single framework & apply various statistical tools to find out the dynamic on the market.
During the analysis stage, feedback from the stakeholder groups would be compared to determine areas of agreement as well as areas of divergence
