

Key Insights
The global dried figs market is projected to reach $1.45 billion by 2025, with an anticipated Compound Annual Growth Rate (CAGR) of 5.1% from 2025 to 2033. This expansion is primarily driven by rising consumer preference for natural, healthy snacks, leveraging dried figs' rich fiber, mineral, and antioxidant content. The growing adoption of vegan and vegetarian lifestyles further enhances demand, positioning figs as a versatile culinary ingredient. Additionally, the confectionery and baking sectors' reliance on dried figs as a key component significantly contributes to market growth across product forms like whole, halved, and fig paste. The Asia Pacific region, led by India and China, is anticipated to experience substantial growth due to escalating disposable incomes and evolving dietary patterns.
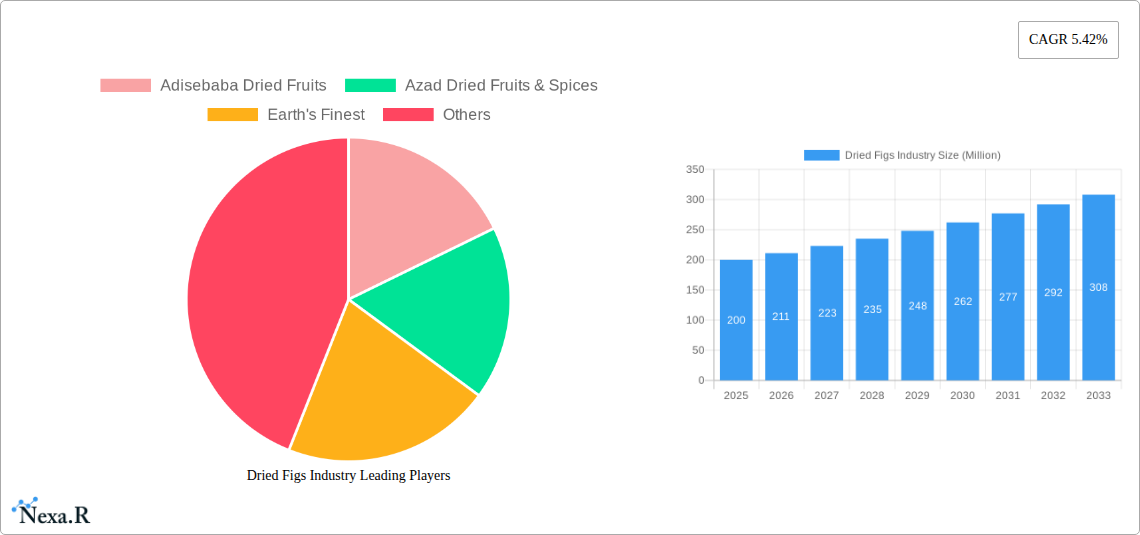
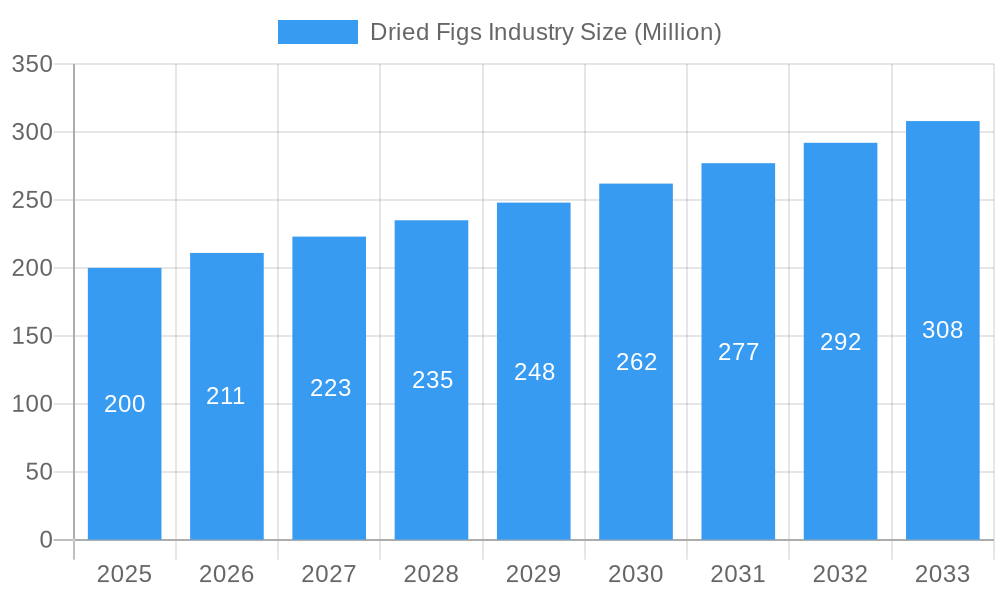
Dried Figs Industry Market Size (In Billion)
Despite these positive trends, the market confronts challenges such as raw material price volatility and supply chain disruptions stemming from weather-dependent harvests. Competition from alternative dried fruits and snack options also poses a restraint. However, increased awareness of dried figs' health advantages and continuous product innovation, including flavored varieties and functional fig-based foods, are expected to offset these obstacles and maintain market momentum. Leading market participants, including Adisebaba Dried Fruits, Azad Dried Fruits & Spices, and Earth's Finest, are actively pursuing product diversification, strategic alliances, and market expansion. While North America and Europe currently dominate market share, the Asia-Pacific region is poised for significant growth throughout the forecast period.
Dried Figs Industry Company Market Share
Dried Figs Industry: A Comprehensive Market Report (2019-2033)
This comprehensive report provides a detailed analysis of the Dried Figs industry, encompassing market dynamics, growth trends, regional analysis, product landscape, key players, and future outlook. The study period covers 2019-2033, with 2025 as the base and estimated year. This report is an invaluable resource for industry professionals, investors, and anyone seeking a deep understanding of this dynamic market. Parent markets include the broader dried fruit industry and the snack food industry; while child markets include baking ingredients, confectionery ingredients, and standalone snack products.
Dried Figs Industry Market Dynamics & Structure
This section analyzes the competitive landscape of the dried figs market, focusing on market concentration, technological advancements, regulatory impacts, and industry consolidation. The report delves into the interplay of these factors to provide a comprehensive understanding of the industry’s structure.
- Market Concentration: The dried figs market exhibits a [xx]% level of concentration in 2025, with the top 5 players holding a combined market share of [xx]%. This concentration is expected to [increase/decrease] slightly by 2033 due to [reason for change].
- Technological Innovation: Advancements in drying techniques (e.g., freeze-drying) and packaging technologies are driving product quality and shelf-life improvements. Innovation barriers include high initial investment costs and limited access to advanced technology in certain regions.
- Regulatory Frameworks: Government regulations related to food safety and labeling significantly impact the industry. [Specific examples of regulations and their impact].
- Competitive Product Substitutes: Dried apricots, raisins, and other dried fruits pose the most significant competitive threat. The report analyzes the competitive positioning of dried figs against these substitutes.
- End-User Demographics: [Analysis of consumer demographics and preferences, including age, income, and location.] Demand is strongest among health-conscious consumers and those seeking natural, nutritious snacks.
- M&A Trends: The number of mergers and acquisitions in the dried figs industry averaged [xx] deals annually during the historical period (2019-2024). The forecast period (2025-2033) anticipates [xx] annual deals, driven by [reasons for M&A activity].
Dried Figs Industry Growth Trends & Insights
This section offers a detailed analysis of the dried figs market's growth trajectory, utilizing a combination of qualitative and quantitative data. It examines market size evolution, adoption rates across various segments, and the impact of technological disruptions and changing consumer preferences. The analysis leverages [mention specific data sources or methodologies used - e.g., market research reports, industry databases] to provide robust insights. Key trends include:
- Market Size Evolution: The global dried figs market size was valued at [xx] Million in 2019 and is projected to reach [xx] Million by 2033, exhibiting a CAGR of [xx]% during the forecast period.
- Adoption Rates: The adoption rate of dried figs as a snack is increasing steadily, driven by growing health awareness and convenience. [Include specific data on adoption rates in various segments].
- Technological Disruptions: [Discuss specific technological advancements and their impact, e.g., improved drying techniques, innovative packaging].
- Consumer Behavior Shifts: [Analyze evolving consumer preferences, such as demand for organic and sustainably sourced products, and influence on market growth].
Dominant Regions, Countries, or Segments in Dried Figs Industry
This section identifies the leading regions, countries, and segments within the dried figs industry, highlighting the factors driving their market dominance.
Leading Region/Country: [Specify the leading region/country, e.g., Turkey, USA, etc.] currently holds the largest market share due to [reasons – e.g., favorable climate, established production infrastructure, strong export capabilities].
Dominant Segment (Product Type): The [Whole/Halved/Paste – specify the segment] segment dominates due to [reasons – e.g., higher consumer preference, versatility in applications]. This segment is expected to grow at a CAGR of [xx]% during the forecast period.
Dominant Segment (Application): The [Baking/Confectionery/Snacking – specify the segment] application currently dominates, accounting for [xx]% of the market share, driven by [reasons – e.g., established market presence, strong demand from food manufacturers].
Key Drivers (Regional/Segmental):
- [List key factors, e.g., favorable government policies supporting agricultural development, robust infrastructure, growing food processing industry].
Dried Figs Industry Product Landscape
The dried figs market offers a range of products, including whole dried figs, halved dried figs, and fig paste, each catering to different applications and consumer preferences. Recent product innovations focus on enhanced flavor profiles, convenient packaging formats, and functional benefits. For example, the incorporation of probiotics and prebiotics into dried figs, as demonstrated by Sunny Fruit’s recent product launch, highlights the growing trend towards functional foods. These advancements are enhancing the appeal of dried figs to a wider consumer base and driving market growth.
Key Drivers, Barriers & Challenges in Dried Figs Industry
Key Drivers: The dried figs market is propelled by growing health consciousness, increasing demand for natural and nutritious snacks, and innovation in product offerings. The rising popularity of vegan and plant-based diets also fuels demand. Government support for agricultural sectors in major producing countries further contributes to market expansion.
Key Challenges: Fluctuations in raw material prices, climate change impacting crop yields, and intense competition from other dried fruits pose significant challenges. Supply chain disruptions and stringent food safety regulations also add to the complexity of the market. For example, [quantifiable example, e.g., a 10% increase in raw material costs led to a 5% price increase in the final product].
Emerging Opportunities in Dried Figs Industry
Emerging opportunities include expanding into untapped markets (e.g., emerging economies), developing innovative applications (e.g., incorporation into ready-to-eat meals, functional beverages), and catering to specific dietary needs (e.g., organic, gluten-free). Further opportunities exist in value-added products like fig-based energy bars or gourmet fig spreads.
Growth Accelerators in the Dried Figs Industry Industry
Long-term growth in the dried figs industry will be driven by technological advancements, strategic partnerships and market expansion strategies focusing on niche segments and new markets. Increased investment in sustainable farming practices and improved supply chain efficiency will also contribute to sustained growth.
Key Players Shaping the Dried Figs Industry Market
- Adisebaba Dried Fruits
- Azad Dried Fruits & Spices
- Earth's Finest
Notable Milestones in Dried Figs Industry Sector
June 2023: Sunny Fruit's launch of its "functional fruit" range, including Prebiotic Organic Dried Figs, showcases the increasing demand for health-enhancing food products. This launch signals a shift towards value-added, functional foods within the dried fruit sector.
February 2023: The Karnataka state government's district import action plan for agricultural products, including figs, indicates a proactive approach to boosting domestic production and exports within India. This initiative could significantly impact the market's future growth trajectory.
In-Depth Dried Figs Industry Market Outlook
The dried figs market holds significant potential for future growth, driven by sustained demand for healthy snacks, product innovation, and expansion into new markets. Strategic partnerships between producers and food manufacturers will be crucial for creating innovative products and enhancing market penetration. The rising trend of incorporating figs into functional foods and beverages is expected to further enhance market growth prospects.
Dried Figs Industry Segmentation
- 1. Production Analysis
- 2. Consumption Analysis
- 3. Import Market Analysis (Value & Volume)
- 4. Export Market Analysis (Value & Volume)
- 5. Price Trend Analysis
Dried Figs Industry Segmentation By Geography
-
1. North America
- 1.1. United States
- 1.2. Canada
- 1.3. Mexico
-
2. Europe
- 2.1. France
- 2.2. Germany
- 2.3. Russian Federation
- 2.4. United Kingdom
- 2.5. Italy
- 2.6. Switzerland
- 2.7. Greece
-
3. Asia Pacific
- 3.1. India
- 3.2. China
- 3.3. Australia
-
4. Middle East
- 4.1. Iran
- 4.2. United Arab Emirates
- 4.3. Saudi Arabia
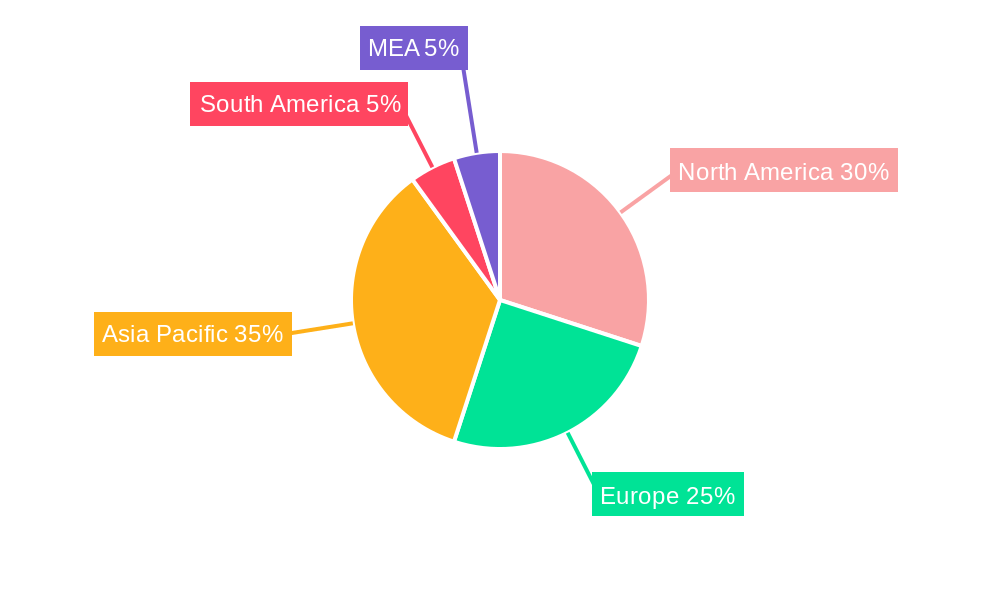
Dried Figs Industry Regional Market Share
Geographic Coverage of Dried Figs Industry
Dried Figs Industry REPORT HIGHLIGHTS
| Aspects | Details |
|---|---|
| Study Period | 2020-2034 |
| Base Year | 2025 |
| Estimated Year | 2026 |
| Forecast Period | 2026-2034 |
| Historical Period | 2020-2025 |
| Growth Rate | CAGR of 5.1% from 2020-2034 |
| Segmentation |
|
Table of Contents
- 1. Introduction
- 1.1. Research Scope
- 1.2. Market Segmentation
- 1.3. Research Objective
- 1.4. Definitions and Assumptions
- 2. Executive Summary
- 2.1. Market Snapshot
- 3. Market Dynamics
- 3.1. Market Drivers
- 3.2. Market Restrains
- 3.3. Market Trends
- 3.4. Market Opportunities
- 4. Market Factor Analysis
- 4.1. Porters Five Forces
- 4.1.1. Bargaining Power of Suppliers
- 4.1.2. Bargaining Power of Buyers
- 4.1.3. Threat of New Entrants
- 4.1.4. Threat of Substitutes
- 4.1.5. Competitive Rivalry
- 4.2. PESTEL analysis
- 4.3. BCG Analysis
- 4.3.1. Stars (High Growth, High Market Share)
- 4.3.2. Cash Cows (Low Growth, High Market Share)
- 4.3.3. Question Mark (High Growth, Low Market Share)
- 4.3.4. Dogs (Low Growth, Low Market Share)
- 4.4. Ansoff Matrix Analysis
- 4.5. Supply Chain Analysis
- 4.6. Regulatory Landscape
- 4.7. Current Market Potential and Opportunity Assessment (TAM–SAM–SOM Framework)
- 4.8. NRP Analyst Note
- 4.1. Porters Five Forces
- 5. Market Analysis, Insights and Forecast 2021-2033
- 5.1. Market Analysis, Insights and Forecast - by Production Analysis
- 5.2. Market Analysis, Insights and Forecast - by Consumption Analysis
- 5.3. Market Analysis, Insights and Forecast - by Import Market Analysis (Value & Volume)
- 5.4. Market Analysis, Insights and Forecast - by Export Market Analysis (Value & Volume)
- 5.5. Market Analysis, Insights and Forecast - by Price Trend Analysis
- 5.6. Market Analysis, Insights and Forecast - by Region
- 5.6.1. North America
- 5.6.2. Europe
- 5.6.3. Asia Pacific
- 5.6.4. Middle East
- 6. Global Dried Figs Industry Analysis, Insights and Forecast, 2021-2033
- 6.1. Market Analysis, Insights and Forecast - by Production Analysis
- 6.2. Market Analysis, Insights and Forecast - by Consumption Analysis
- 6.3. Market Analysis, Insights and Forecast - by Import Market Analysis (Value & Volume)
- 6.4. Market Analysis, Insights and Forecast - by Export Market Analysis (Value & Volume)
- 6.5. Market Analysis, Insights and Forecast - by Price Trend Analysis
- 7. North America Dried Figs Industry Analysis, Insights and Forecast, 2020-2032
- 7.1. Market Analysis, Insights and Forecast - by Production Analysis
- 7.2. Market Analysis, Insights and Forecast - by Consumption Analysis
- 7.3. Market Analysis, Insights and Forecast - by Import Market Analysis (Value & Volume)
- 7.4. Market Analysis, Insights and Forecast - by Export Market Analysis (Value & Volume)
- 7.5. Market Analysis, Insights and Forecast - by Price Trend Analysis
- 8. Europe Dried Figs Industry Analysis, Insights and Forecast, 2020-2032
- 8.1. Market Analysis, Insights and Forecast - by Production Analysis
- 8.2. Market Analysis, Insights and Forecast - by Consumption Analysis
- 8.3. Market Analysis, Insights and Forecast - by Import Market Analysis (Value & Volume)
- 8.4. Market Analysis, Insights and Forecast - by Export Market Analysis (Value & Volume)
- 8.5. Market Analysis, Insights and Forecast - by Price Trend Analysis
- 9. Asia Pacific Dried Figs Industry Analysis, Insights and Forecast, 2020-2032
- 9.1. Market Analysis, Insights and Forecast - by Production Analysis
- 9.2. Market Analysis, Insights and Forecast - by Consumption Analysis
- 9.3. Market Analysis, Insights and Forecast - by Import Market Analysis (Value & Volume)
- 9.4. Market Analysis, Insights and Forecast - by Export Market Analysis (Value & Volume)
- 9.5. Market Analysis, Insights and Forecast - by Price Trend Analysis
- 10. Middle East Dried Figs Industry Analysis, Insights and Forecast, 2020-2032
- 10.1. Market Analysis, Insights and Forecast - by Production Analysis
- 10.2. Market Analysis, Insights and Forecast - by Consumption Analysis
- 10.3. Market Analysis, Insights and Forecast - by Import Market Analysis (Value & Volume)
- 10.4. Market Analysis, Insights and Forecast - by Export Market Analysis (Value & Volume)
- 10.5. Market Analysis, Insights and Forecast - by Price Trend Analysis
- 11. Competitive Analysis
- 11.1. Company Profiles
- 11.1.1 Adisebaba Dried Fruits
- 11.1.1.1. Company Overview
- 11.1.1.2. Products
- 11.1.1.3. Company Financials
- 11.1.1.4. SWOT Analysis
- 11.1.2 Azad Dried Fruits & Spices
- 11.1.2.1. Company Overview
- 11.1.2.2. Products
- 11.1.2.3. Company Financials
- 11.1.2.4. SWOT Analysis
- 11.1.3 Earth's Finest
- 11.1.3.1. Company Overview
- 11.1.3.2. Products
- 11.1.3.3. Company Financials
- 11.1.3.4. SWOT Analysis
- 11.1.1 Adisebaba Dried Fruits
- 11.2. Market Entropy
- 11.2.1 Company's Key Areas Served
- 11.2.2 Recent Developments
- 11.3. Company Market Share Analysis 2025
- 11.3.1 Top 5 Companies Market Share Analysis
- 11.3.2 Top 3 Companies Market Share Analysis
- 11.4. List of Potential Customers
- 12. Research Methodology
List of Figures
- Figure 1: Global Dried Figs Industry Revenue Breakdown (billion, %) by Region 2025 & 2033
- Figure 2: North America Dried Figs Industry Revenue (billion), by Production Analysis 2025 & 2033
- Figure 3: North America Dried Figs Industry Revenue Share (%), by Production Analysis 2025 & 2033
- Figure 4: North America Dried Figs Industry Revenue (billion), by Consumption Analysis 2025 & 2033
- Figure 5: North America Dried Figs Industry Revenue Share (%), by Consumption Analysis 2025 & 2033
- Figure 6: North America Dried Figs Industry Revenue (billion), by Import Market Analysis (Value & Volume) 2025 & 2033
- Figure 7: North America Dried Figs Industry Revenue Share (%), by Import Market Analysis (Value & Volume) 2025 & 2033
- Figure 8: North America Dried Figs Industry Revenue (billion), by Export Market Analysis (Value & Volume) 2025 & 2033
- Figure 9: North America Dried Figs Industry Revenue Share (%), by Export Market Analysis (Value & Volume) 2025 & 2033
- Figure 10: North America Dried Figs Industry Revenue (billion), by Price Trend Analysis 2025 & 2033
- Figure 11: North America Dried Figs Industry Revenue Share (%), by Price Trend Analysis 2025 & 2033
- Figure 12: North America Dried Figs Industry Revenue (billion), by Country 2025 & 2033
- Figure 13: North America Dried Figs Industry Revenue Share (%), by Country 2025 & 2033
- Figure 14: Europe Dried Figs Industry Revenue (billion), by Production Analysis 2025 & 2033
- Figure 15: Europe Dried Figs Industry Revenue Share (%), by Production Analysis 2025 & 2033
- Figure 16: Europe Dried Figs Industry Revenue (billion), by Consumption Analysis 2025 & 2033
- Figure 17: Europe Dried Figs Industry Revenue Share (%), by Consumption Analysis 2025 & 2033
- Figure 18: Europe Dried Figs Industry Revenue (billion), by Import Market Analysis (Value & Volume) 2025 & 2033
- Figure 19: Europe Dried Figs Industry Revenue Share (%), by Import Market Analysis (Value & Volume) 2025 & 2033
- Figure 20: Europe Dried Figs Industry Revenue (billion), by Export Market Analysis (Value & Volume) 2025 & 2033
- Figure 21: Europe Dried Figs Industry Revenue Share (%), by Export Market Analysis (Value & Volume) 2025 & 2033
- Figure 22: Europe Dried Figs Industry Revenue (billion), by Price Trend Analysis 2025 & 2033
- Figure 23: Europe Dried Figs Industry Revenue Share (%), by Price Trend Analysis 2025 & 2033
- Figure 24: Europe Dried Figs Industry Revenue (billion), by Country 2025 & 2033
- Figure 25: Europe Dried Figs Industry Revenue Share (%), by Country 2025 & 2033
- Figure 26: Asia Pacific Dried Figs Industry Revenue (billion), by Production Analysis 2025 & 2033
- Figure 27: Asia Pacific Dried Figs Industry Revenue Share (%), by Production Analysis 2025 & 2033
- Figure 28: Asia Pacific Dried Figs Industry Revenue (billion), by Consumption Analysis 2025 & 2033
- Figure 29: Asia Pacific Dried Figs Industry Revenue Share (%), by Consumption Analysis 2025 & 2033
- Figure 30: Asia Pacific Dried Figs Industry Revenue (billion), by Import Market Analysis (Value & Volume) 2025 & 2033
- Figure 31: Asia Pacific Dried Figs Industry Revenue Share (%), by Import Market Analysis (Value & Volume) 2025 & 2033
- Figure 32: Asia Pacific Dried Figs Industry Revenue (billion), by Export Market Analysis (Value & Volume) 2025 & 2033
- Figure 33: Asia Pacific Dried Figs Industry Revenue Share (%), by Export Market Analysis (Value & Volume) 2025 & 2033
- Figure 34: Asia Pacific Dried Figs Industry Revenue (billion), by Price Trend Analysis 2025 & 2033
- Figure 35: Asia Pacific Dried Figs Industry Revenue Share (%), by Price Trend Analysis 2025 & 2033
- Figure 36: Asia Pacific Dried Figs Industry Revenue (billion), by Country 2025 & 2033
- Figure 37: Asia Pacific Dried Figs Industry Revenue Share (%), by Country 2025 & 2033
- Figure 38: Middle East Dried Figs Industry Revenue (billion), by Production Analysis 2025 & 2033
- Figure 39: Middle East Dried Figs Industry Revenue Share (%), by Production Analysis 2025 & 2033
- Figure 40: Middle East Dried Figs Industry Revenue (billion), by Consumption Analysis 2025 & 2033
- Figure 41: Middle East Dried Figs Industry Revenue Share (%), by Consumption Analysis 2025 & 2033
- Figure 42: Middle East Dried Figs Industry Revenue (billion), by Import Market Analysis (Value & Volume) 2025 & 2033
- Figure 43: Middle East Dried Figs Industry Revenue Share (%), by Import Market Analysis (Value & Volume) 2025 & 2033
- Figure 44: Middle East Dried Figs Industry Revenue (billion), by Export Market Analysis (Value & Volume) 2025 & 2033
- Figure 45: Middle East Dried Figs Industry Revenue Share (%), by Export Market Analysis (Value & Volume) 2025 & 2033
- Figure 46: Middle East Dried Figs Industry Revenue (billion), by Price Trend Analysis 2025 & 2033
- Figure 47: Middle East Dried Figs Industry Revenue Share (%), by Price Trend Analysis 2025 & 2033
- Figure 48: Middle East Dried Figs Industry Revenue (billion), by Country 2025 & 2033
- Figure 49: Middle East Dried Figs Industry Revenue Share (%), by Country 2025 & 2033
List of Tables
- Table 1: Global Dried Figs Industry Revenue billion Forecast, by Production Analysis 2020 & 2033
- Table 2: Global Dried Figs Industry Revenue billion Forecast, by Consumption Analysis 2020 & 2033
- Table 3: Global Dried Figs Industry Revenue billion Forecast, by Import Market Analysis (Value & Volume) 2020 & 2033
- Table 4: Global Dried Figs Industry Revenue billion Forecast, by Export Market Analysis (Value & Volume) 2020 & 2033
- Table 5: Global Dried Figs Industry Revenue billion Forecast, by Price Trend Analysis 2020 & 2033
- Table 6: Global Dried Figs Industry Revenue billion Forecast, by Region 2020 & 2033
- Table 7: Global Dried Figs Industry Revenue billion Forecast, by Production Analysis 2020 & 2033
- Table 8: Global Dried Figs Industry Revenue billion Forecast, by Consumption Analysis 2020 & 2033
- Table 9: Global Dried Figs Industry Revenue billion Forecast, by Import Market Analysis (Value & Volume) 2020 & 2033
- Table 10: Global Dried Figs Industry Revenue billion Forecast, by Export Market Analysis (Value & Volume) 2020 & 2033
- Table 11: Global Dried Figs Industry Revenue billion Forecast, by Price Trend Analysis 2020 & 2033
- Table 12: Global Dried Figs Industry Revenue billion Forecast, by Country 2020 & 2033
- Table 13: United States Dried Figs Industry Revenue (billion) Forecast, by Application 2020 & 2033
- Table 14: Canada Dried Figs Industry Revenue (billion) Forecast, by Application 2020 & 2033
- Table 15: Mexico Dried Figs Industry Revenue (billion) Forecast, by Application 2020 & 2033
- Table 16: Global Dried Figs Industry Revenue billion Forecast, by Production Analysis 2020 & 2033
- Table 17: Global Dried Figs Industry Revenue billion Forecast, by Consumption Analysis 2020 & 2033
- Table 18: Global Dried Figs Industry Revenue billion Forecast, by Import Market Analysis (Value & Volume) 2020 & 2033
- Table 19: Global Dried Figs Industry Revenue billion Forecast, by Export Market Analysis (Value & Volume) 2020 & 2033
- Table 20: Global Dried Figs Industry Revenue billion Forecast, by Price Trend Analysis 2020 & 2033
- Table 21: Global Dried Figs Industry Revenue billion Forecast, by Country 2020 & 2033
- Table 22: France Dried Figs Industry Revenue (billion) Forecast, by Application 2020 & 2033
- Table 23: Germany Dried Figs Industry Revenue (billion) Forecast, by Application 2020 & 2033
- Table 24: Russian Federation Dried Figs Industry Revenue (billion) Forecast, by Application 2020 & 2033
- Table 25: United Kingdom Dried Figs Industry Revenue (billion) Forecast, by Application 2020 & 2033
- Table 26: Italy Dried Figs Industry Revenue (billion) Forecast, by Application 2020 & 2033
- Table 27: Switzerland Dried Figs Industry Revenue (billion) Forecast, by Application 2020 & 2033
- Table 28: Greece Dried Figs Industry Revenue (billion) Forecast, by Application 2020 & 2033
- Table 29: Global Dried Figs Industry Revenue billion Forecast, by Production Analysis 2020 & 2033
- Table 30: Global Dried Figs Industry Revenue billion Forecast, by Consumption Analysis 2020 & 2033
- Table 31: Global Dried Figs Industry Revenue billion Forecast, by Import Market Analysis (Value & Volume) 2020 & 2033
- Table 32: Global Dried Figs Industry Revenue billion Forecast, by Export Market Analysis (Value & Volume) 2020 & 2033
- Table 33: Global Dried Figs Industry Revenue billion Forecast, by Price Trend Analysis 2020 & 2033
- Table 34: Global Dried Figs Industry Revenue billion Forecast, by Country 2020 & 2033
- Table 35: India Dried Figs Industry Revenue (billion) Forecast, by Application 2020 & 2033
- Table 36: China Dried Figs Industry Revenue (billion) Forecast, by Application 2020 & 2033
- Table 37: Australia Dried Figs Industry Revenue (billion) Forecast, by Application 2020 & 2033
- Table 38: Global Dried Figs Industry Revenue billion Forecast, by Production Analysis 2020 & 2033
- Table 39: Global Dried Figs Industry Revenue billion Forecast, by Consumption Analysis 2020 & 2033
- Table 40: Global Dried Figs Industry Revenue billion Forecast, by Import Market Analysis (Value & Volume) 2020 & 2033
- Table 41: Global Dried Figs Industry Revenue billion Forecast, by Export Market Analysis (Value & Volume) 2020 & 2033
- Table 42: Global Dried Figs Industry Revenue billion Forecast, by Price Trend Analysis 2020 & 2033
- Table 43: Global Dried Figs Industry Revenue billion Forecast, by Country 2020 & 2033
- Table 44: Iran Dried Figs Industry Revenue (billion) Forecast, by Application 2020 & 2033
- Table 45: United Arab Emirates Dried Figs Industry Revenue (billion) Forecast, by Application 2020 & 2033
- Table 46: Saudi Arabia Dried Figs Industry Revenue (billion) Forecast, by Application 2020 & 2033
Frequently Asked Questions
1. What is the projected Compound Annual Growth Rate (CAGR) of the Dried Figs Industry?
The projected CAGR is approximately 5.1%.
2. Which companies are prominent players in the Dried Figs Industry?
Key companies in the market include Adisebaba Dried Fruits , Azad Dried Fruits & Spices, Earth's Finest .
3. What are the main segments of the Dried Figs Industry?
The market segments include Production Analysis, Consumption Analysis, Import Market Analysis (Value & Volume), Export Market Analysis (Value & Volume), Price Trend Analysis.
4. Can you provide details about the market size?
The market size is estimated to be USD 1.45 billion as of 2022.
5. What are some drivers contributing to market growth?
Rise in Percentage of Area Harvested Under Almond Cultivation; Demand for Healthy Snacking Options.
6. What are the notable trends driving market growth?
Rising Per Capita Consumption from High-income Economies.
7. Are there any restraints impacting market growth?
Water Scarcity in Almond Producing Regions; Drop in the Prices of Almonds.
8. Can you provide examples of recent developments in the market?
June 2023: At the recent THAIFEX - Anuga Asia 2023, Turkey-based organic snacks brand Sunny Fruit introduced its latest "functional fruit" range, including Prebiotic Organic Dried Apricots, Prebiotic Organic Dried Figs, and Organic Fig & Walnut Balls with Added Probiotics and Prebiotics.
9. What pricing options are available for accessing the report?
Pricing options include single-user, multi-user, and enterprise licenses priced at USD 4750, USD 5250, and USD 8750 respectively.
10. Is the market size provided in terms of value or volume?
The market size is provided in terms of value, measured in billion.
11. Are there any specific market keywords associated with the report?
Yes, the market keyword associated with the report is "Dried Figs Industry," which aids in identifying and referencing the specific market segment covered.
12. How do I determine which pricing option suits my needs best?
The pricing options vary based on user requirements and access needs. Individual users may opt for single-user licenses, while businesses requiring broader access may choose multi-user or enterprise licenses for cost-effective access to the report.
13. Are there any additional resources or data provided in the Dried Figs Industry report?
While the report offers comprehensive insights, it's advisable to review the specific contents or supplementary materials provided to ascertain if additional resources or data are available.
14. How can I stay updated on further developments or reports in the Dried Figs Industry?
To stay informed about further developments, trends, and reports in the Dried Figs Industry, consider subscribing to industry newsletters, following relevant companies and organizations, or regularly checking reputable industry news sources and publications.
Methodology
Step 1 - Identification of Relevant Samples Size from Population Database


Step 2 - Approaches for Defining Global Market Size (Value, Volume* & Price*)

Note*: In applicable scenarios
Step 3 - Data Sources
Primary Research
- Web Analytics
- Survey Reports
- Research Institute
- Latest Research Reports
- Opinion Leaders
Secondary Research
- Annual Reports
- White Paper
- Latest Press Release
- Industry Association
- Paid Database
- Investor Presentations

Step 4 - Data Triangulation
Involves using different sources of information in order to increase the validity of a study
These sources are likely to be stakeholders in a program - participants, other researchers, program staff, other community members, and so on.
Then we put all data in single framework & apply various statistical tools to find out the dynamic on the market.
During the analysis stage, feedback from the stakeholder groups would be compared to determine areas of agreement as well as areas of divergence