

Key Insights
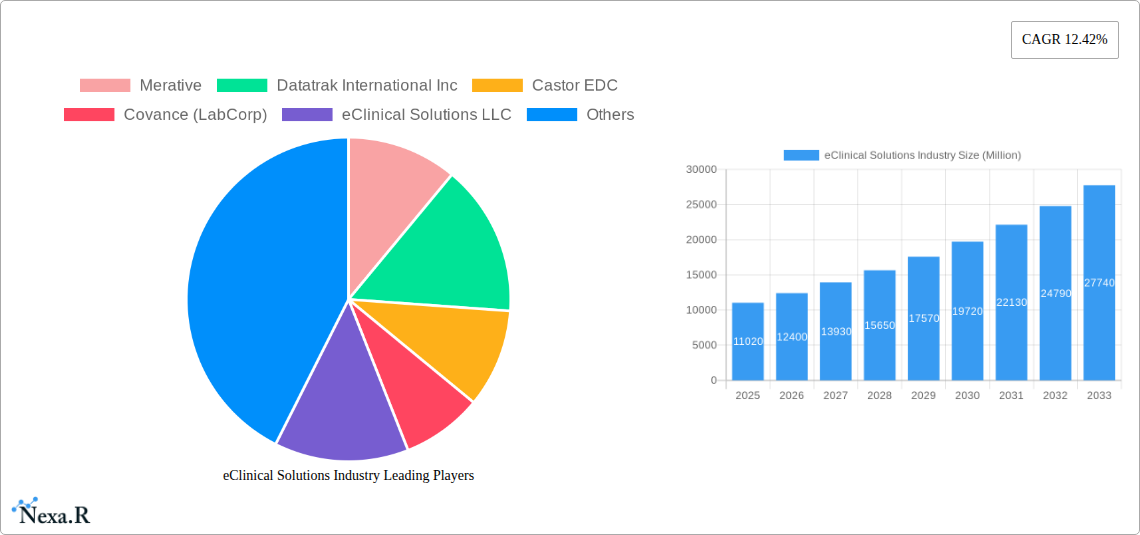
The eClinical Solutions market, valued at $11.02 billion in 2025, is projected to experience robust growth, driven by a Compound Annual Growth Rate (CAGR) of 12.42% from 2025 to 2033. This expansion is fueled by several key factors. The increasing prevalence of clinical trials, coupled with the rising adoption of digital technologies within the healthcare sector, is significantly boosting demand for efficient and streamlined eClinical solutions. Furthermore, regulatory pressures encouraging data standardization and the need for enhanced data security are compelling pharmaceutical companies, Contract Research Organizations (CROs), and other end-users to adopt cloud-based and advanced eClinical platforms. The shift towards decentralized clinical trials, accelerated by the recent pandemic, further emphasizes the importance of remote data capture and management capabilities offered by these solutions. Specific product segments like Electronic Data Capture (EDC), Electronic Clinical Outcome Assessments (eCOA), and Electronic Patient-reported Outcomes (ePRO) are experiencing particularly strong growth due to their ability to improve data quality, reduce costs, and accelerate trial timelines. The competitive landscape, populated by major players like Veeva Systems, IQVIA, and Medidata Solutions, is characterized by ongoing innovation and strategic partnerships aimed at expanding market share and enhancing product offerings.
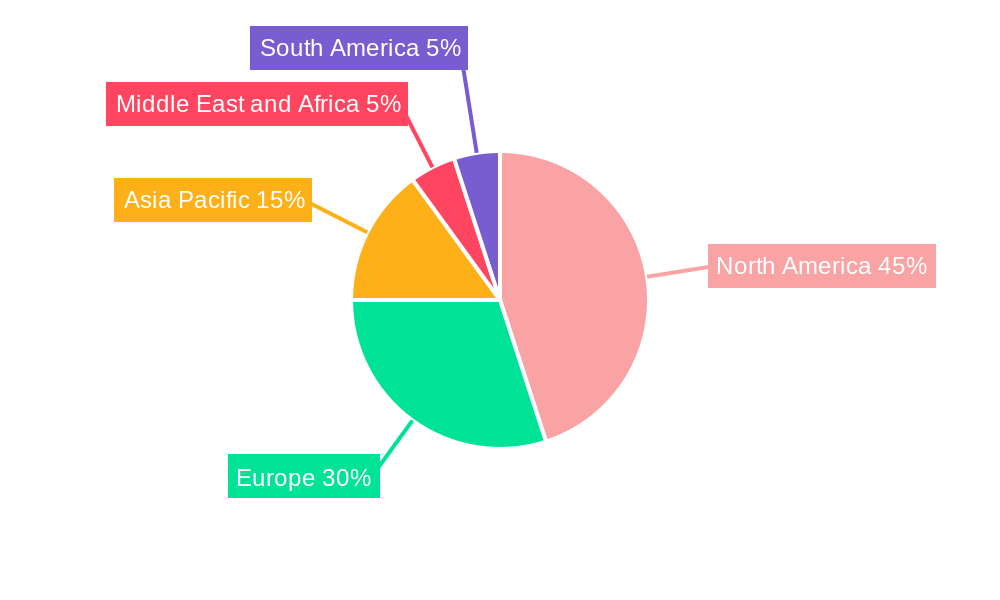
The market segmentation reveals significant opportunities across various product types and deployment modes. Cloud-based solutions are gaining traction due to their scalability and cost-effectiveness. Geographically, North America currently dominates the market, but the Asia-Pacific region is expected to witness the fastest growth due to increasing clinical trial activity and rising healthcare expenditure. While factors such as high implementation costs and the need for robust IT infrastructure pose certain restraints, the overall market outlook for eClinical solutions remains exceptionally positive, promising substantial expansion throughout the forecast period. The industry is expected to see consolidation and strategic alliances as companies strive to enhance their technological capabilities and global reach. Continued innovation in areas such as artificial intelligence (AI) and machine learning (ML) for data analysis and predictive modeling will further drive market growth.
eClinical Solutions Industry Market Report: 2019-2033
This comprehensive report provides an in-depth analysis of the eClinical Solutions industry, encompassing market dynamics, growth trends, competitive landscape, and future outlook. With a focus on key segments – Clinical Data Management Systems (CDMS), Clinical Trial Management Systems (CTMS), Electronic Data Capture (EDC), and more – this report offers invaluable insights for industry professionals, investors, and stakeholders. The study period covers 2019-2033, with a base year of 2025 and a forecast period of 2025-2033. The report analyzes the market across various deployment modes (cloud-based, on-premise) and end-users (Pharmaceutical & Biotechnology Companies, CROs). Estimated market size in 2025 is projected at xx Million.
eClinical Solutions Industry Market Dynamics & Structure
The eClinical Solutions market is characterized by a moderately concentrated landscape with several major players vying for market share. Technological innovation, particularly in areas like AI and machine learning for data analysis, is a key driver. Stringent regulatory frameworks (e.g., FDA guidelines) significantly impact product development and adoption. The market witnesses continuous innovation with new product features and integrations. Furthermore, the industry experiences frequent mergers and acquisitions (M&A) activity, aiming to expand market reach and product portfolios.
- Market Concentration: The top 5 players hold approximately xx% of the market share in 2025.
- Technological Innovation: AI-driven analytics, cloud-based solutions, and enhanced data security are driving innovation.
- Regulatory Landscape: Compliance with FDA, EMA, and other global regulations shapes product development and market entry.
- M&A Activity: The average annual M&A deal volume in the historical period (2019-2024) was approximately xx deals.
- Competitive Landscape: Intense competition exists among established players and emerging niche providers.
eClinical Solutions Industry Growth Trends & Insights
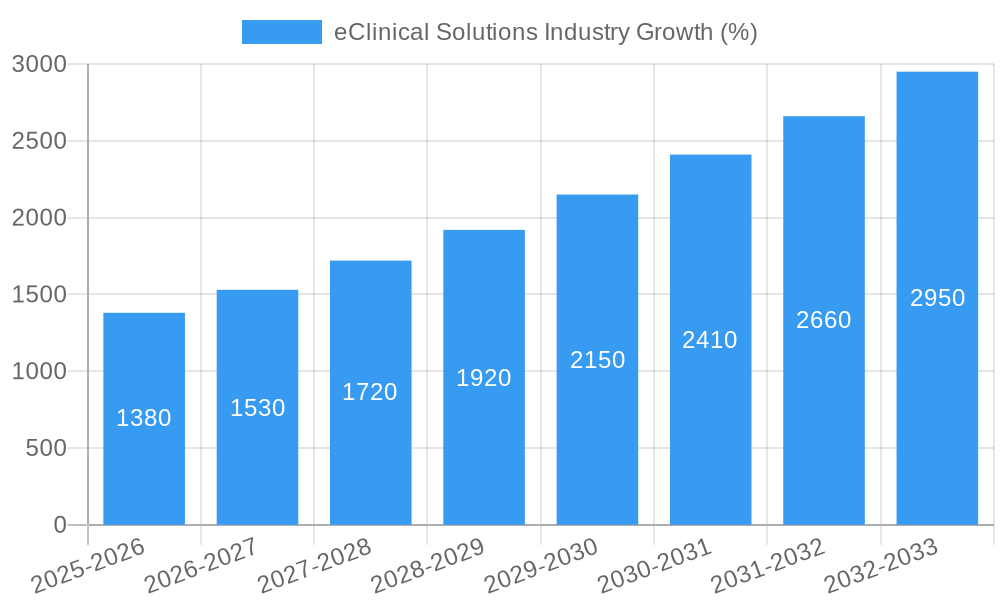
The eClinical Solutions market has experienced significant growth in the historical period (2019-2024), driven by factors such as increasing clinical trial volumes, rising adoption of cloud-based solutions, and growing demand for data-driven insights. The market is projected to maintain a healthy Compound Annual Growth Rate (CAGR) of xx% during the forecast period (2025-2033). This growth is fueled by the increasing adoption of electronic systems to improve efficiency and reduce costs in clinical trials. The shift towards cloud-based solutions continues to gain momentum, offering scalability and cost-effectiveness. Furthermore, the increasing complexity of clinical trials is boosting demand for sophisticated data analytics platforms. Market penetration for cloud-based solutions is projected to reach xx% by 2033.
Dominant Regions, Countries, or Segments in eClinical Solutions Industry
North America currently dominates the eClinical Solutions market, followed by Europe. Within product types, Electronic Data Capture (EDC) and Clinical Trial Management Systems (CTMS) hold the largest market share. The dominance of North America is attributed to the high concentration of pharmaceutical and biotechnology companies, coupled with robust R&D investment and advanced healthcare infrastructure. Europe follows closely, driven by similar factors albeit at a slightly slower pace.
- North America: High concentration of pharmaceutical companies, robust R&D spending, advanced infrastructure.
- Europe: Significant pharmaceutical industry presence, increasing adoption of eClinical solutions.
- Asia-Pacific: Rapidly growing market with increasing clinical trial activity and investment in healthcare infrastructure.
- Dominant Product Segment: EDC and CTMS dominate due to their critical role in streamlining clinical trials.
- Dominant Deployment Mode: Cloud-based solutions are experiencing rapid growth due to scalability and cost-effectiveness.
eClinical Solutions Industry Product Landscape
The eClinical Solutions market offers a wide array of products, ranging from basic EDC systems to sophisticated integrated platforms incorporating AI-driven analytics and ePRO capabilities. Recent innovations focus on improving interoperability, enhancing data security, and integrating advanced analytics for better decision-making in clinical trials. The unique selling propositions often include user-friendly interfaces, robust data management capabilities, and seamless integration with other clinical trial systems. Technological advancements are improving data quality, reducing manual effort, and facilitating faster trial completion.
Key Drivers, Barriers & Challenges in eClinical Solutions Industry
Key Drivers:
- Increased clinical trial complexity.
- Growing adoption of cloud-based solutions.
- Rising demand for data-driven decision-making.
- Stringent regulatory requirements promoting data integrity and security.
Challenges:
- High initial investment costs for implementing new systems.
- Data integration challenges across various systems.
- Maintaining data security and compliance with stringent regulations.
- Intense competition among numerous vendors. This competition has led to price pressures, impacting profitability for some players.
Emerging Opportunities in eClinical Solutions Industry
- AI & ML Integration: Enhanced data analysis and predictive modeling.
- Decentralized Clinical Trials: Expanding market access and improving patient experience.
- Real-world Evidence (RWE) Integration: Leveraging real-world data for improved clinical decision-making.
- Expansion into Emerging Markets: Growth potential in under-served regions.
Growth Accelerators in the eClinical Solutions Industry
Strategic partnerships between eClinical solution providers and pharmaceutical companies are accelerating growth. Technological breakthroughs in AI and machine learning are improving data analysis and prediction capabilities. Furthermore, the increasing focus on improving efficiency and reducing costs in clinical trials is driving adoption of these solutions. Expansion into emerging markets offers substantial growth potential.
Key Players Shaping the eClinical Solutions Industry Market
- Merative
- Datatrak International Inc
- Castor EDC
- Covance (LabCorp)
- eClinical Solutions LLC
- Saama Technologies Inc
- Dassault Systemes (Medidata Solutions Inc)
- Mednet Solutions
- Clario (BioClinicia Inc)
- Signant Health
- IQVIA Holdings Inc
- PAREXEL International Corporation (Calyx)
- Oracle Corporation
- Medrio Inc
- Veeva Systems
Notable Milestones in eClinical Solutions Industry Sector
- January 2023: Veeva Systems selected by Adare Pharma Solutions for its Veeva Vault Quality Suite.
- May 2022: Emmes launched its third-generation Advantage eClinical cloud platform.
In-Depth eClinical Solutions Industry Market Outlook
The eClinical Solutions market is poised for continued robust growth, driven by technological advancements, increasing clinical trial activity, and the growing adoption of cloud-based solutions. Strategic partnerships, expansion into emerging markets, and the integration of AI and machine learning will shape the future market landscape. The market presents significant opportunities for both established players and emerging innovators.
eClinical Solutions Industry Segmentation
-
1. Product Type
- 1.1. Clinical Data Management Systems (CDMS)
- 1.2. Clinical Trial Management Systems (CTMS)
- 1.3. Randomization and Trial Supply Management
- 1.4. Electronic Data Capture (EDC)
- 1.5. Electron
- 1.6. Clinical Analytics Platforms
- 1.7. Electronic Trial Master File (eTMF)
- 1.8. Other Product Types
-
2. Deployment Mode
- 2.1. Cloud-based eClinical Solutions
- 2.2. On-premise eClinical Solutions
-
3. End User
- 3.1. Pharmaceutical and Biotechnology Companies
- 3.2. Contract Research Organizations (CROs)
- 3.3. Other End Users
eClinical Solutions Industry Segmentation By Geography
-
1. North America
- 1.1. United States
- 1.2. Canada
- 1.3. Mexico
-
2. Europe
- 2.1. Germany
- 2.2. United kingdom
- 2.3. France
- 2.4. Italy
- 2.5. Spain
- 2.6. Rest of Europe
-
3. Asia Pacific
- 3.1. China
- 3.2. Japan
- 3.3. India
- 3.4. Australia
- 3.5. South Korea
- 3.6. Rest of Asia Pacific
-
4. Middle East and Africa
- 4.1. GCC
- 4.2. South Africa
- 4.3. Rest of Middle East and Africa
-
5. South America
- 5.1. Brazil
- 5.2. Argentina
- 5.3. Rest of South America
eClinical Solutions Industry REPORT HIGHLIGHTS
| Aspects | Details |
|---|---|
| Study Period | 2019-2033 |
| Base Year | 2024 |
| Estimated Year | 2025 |
| Forecast Period | 2025-2033 |
| Historical Period | 2019-2024 |
| Growth Rate | CAGR of 12.42% from 2019-2033 |
| Segmentation |
|
Table of Contents
- 1. Introduction
- 1.1. Research Scope
- 1.2. Market Segmentation
- 1.3. Research Methodology
- 1.4. Definitions and Assumptions
- 2. Executive Summary
- 2.1. Introduction
- 3. Market Dynamics
- 3.1. Introduction
- 3.2. Market Drivers
- 3.2.1. Enormous Data Mounting from the Healthcare Industry; Rising Number of Clinical Trials; Government Emphasis on Clinical Research
- 3.3. Market Restrains
- 3.3.1. Lack of Awareness and Infrastructure in Developing Countries; High Implementation Costs
- 3.4. Market Trends
- 3.4.1. Clinical Data Management Systems Segment is Expected to Hold a Significant Market Share Over the Forecast Period
- 4. Market Factor Analysis
- 4.1. Porters Five Forces
- 4.2. Supply/Value Chain
- 4.3. PESTEL analysis
- 4.4. Market Entropy
- 4.5. Patent/Trademark Analysis
- 5. Global eClinical Solutions Industry Analysis, Insights and Forecast, 2019-2031
- 5.1. Market Analysis, Insights and Forecast - by Product Type
- 5.1.1. Clinical Data Management Systems (CDMS)
- 5.1.2. Clinical Trial Management Systems (CTMS)
- 5.1.3. Randomization and Trial Supply Management
- 5.1.4. Electronic Data Capture (EDC)
- 5.1.5. Electron
- 5.1.6. Clinical Analytics Platforms
- 5.1.7. Electronic Trial Master File (eTMF)
- 5.1.8. Other Product Types
- 5.2. Market Analysis, Insights and Forecast - by Deployment Mode
- 5.2.1. Cloud-based eClinical Solutions
- 5.2.2. On-premise eClinical Solutions
- 5.3. Market Analysis, Insights and Forecast - by End User
- 5.3.1. Pharmaceutical and Biotechnology Companies
- 5.3.2. Contract Research Organizations (CROs)
- 5.3.3. Other End Users
- 5.4. Market Analysis, Insights and Forecast - by Region
- 5.4.1. North America
- 5.4.2. Europe
- 5.4.3. Asia Pacific
- 5.4.4. Middle East and Africa
- 5.4.5. South America
- 5.1. Market Analysis, Insights and Forecast - by Product Type
- 6. North America eClinical Solutions Industry Analysis, Insights and Forecast, 2019-2031
- 6.1. Market Analysis, Insights and Forecast - by Product Type
- 6.1.1. Clinical Data Management Systems (CDMS)
- 6.1.2. Clinical Trial Management Systems (CTMS)
- 6.1.3. Randomization and Trial Supply Management
- 6.1.4. Electronic Data Capture (EDC)
- 6.1.5. Electron
- 6.1.6. Clinical Analytics Platforms
- 6.1.7. Electronic Trial Master File (eTMF)
- 6.1.8. Other Product Types
- 6.2. Market Analysis, Insights and Forecast - by Deployment Mode
- 6.2.1. Cloud-based eClinical Solutions
- 6.2.2. On-premise eClinical Solutions
- 6.3. Market Analysis, Insights and Forecast - by End User
- 6.3.1. Pharmaceutical and Biotechnology Companies
- 6.3.2. Contract Research Organizations (CROs)
- 6.3.3. Other End Users
- 6.1. Market Analysis, Insights and Forecast - by Product Type
- 7. Europe eClinical Solutions Industry Analysis, Insights and Forecast, 2019-2031
- 7.1. Market Analysis, Insights and Forecast - by Product Type
- 7.1.1. Clinical Data Management Systems (CDMS)
- 7.1.2. Clinical Trial Management Systems (CTMS)
- 7.1.3. Randomization and Trial Supply Management
- 7.1.4. Electronic Data Capture (EDC)
- 7.1.5. Electron
- 7.1.6. Clinical Analytics Platforms
- 7.1.7. Electronic Trial Master File (eTMF)
- 7.1.8. Other Product Types
- 7.2. Market Analysis, Insights and Forecast - by Deployment Mode
- 7.2.1. Cloud-based eClinical Solutions
- 7.2.2. On-premise eClinical Solutions
- 7.3. Market Analysis, Insights and Forecast - by End User
- 7.3.1. Pharmaceutical and Biotechnology Companies
- 7.3.2. Contract Research Organizations (CROs)
- 7.3.3. Other End Users
- 7.1. Market Analysis, Insights and Forecast - by Product Type
- 8. Asia Pacific eClinical Solutions Industry Analysis, Insights and Forecast, 2019-2031
- 8.1. Market Analysis, Insights and Forecast - by Product Type
- 8.1.1. Clinical Data Management Systems (CDMS)
- 8.1.2. Clinical Trial Management Systems (CTMS)
- 8.1.3. Randomization and Trial Supply Management
- 8.1.4. Electronic Data Capture (EDC)
- 8.1.5. Electron
- 8.1.6. Clinical Analytics Platforms
- 8.1.7. Electronic Trial Master File (eTMF)
- 8.1.8. Other Product Types
- 8.2. Market Analysis, Insights and Forecast - by Deployment Mode
- 8.2.1. Cloud-based eClinical Solutions
- 8.2.2. On-premise eClinical Solutions
- 8.3. Market Analysis, Insights and Forecast - by End User
- 8.3.1. Pharmaceutical and Biotechnology Companies
- 8.3.2. Contract Research Organizations (CROs)
- 8.3.3. Other End Users
- 8.1. Market Analysis, Insights and Forecast - by Product Type
- 9. Middle East and Africa eClinical Solutions Industry Analysis, Insights and Forecast, 2019-2031
- 9.1. Market Analysis, Insights and Forecast - by Product Type
- 9.1.1. Clinical Data Management Systems (CDMS)
- 9.1.2. Clinical Trial Management Systems (CTMS)
- 9.1.3. Randomization and Trial Supply Management
- 9.1.4. Electronic Data Capture (EDC)
- 9.1.5. Electron
- 9.1.6. Clinical Analytics Platforms
- 9.1.7. Electronic Trial Master File (eTMF)
- 9.1.8. Other Product Types
- 9.2. Market Analysis, Insights and Forecast - by Deployment Mode
- 9.2.1. Cloud-based eClinical Solutions
- 9.2.2. On-premise eClinical Solutions
- 9.3. Market Analysis, Insights and Forecast - by End User
- 9.3.1. Pharmaceutical and Biotechnology Companies
- 9.3.2. Contract Research Organizations (CROs)
- 9.3.3. Other End Users
- 9.1. Market Analysis, Insights and Forecast - by Product Type
- 10. South America eClinical Solutions Industry Analysis, Insights and Forecast, 2019-2031
- 10.1. Market Analysis, Insights and Forecast - by Product Type
- 10.1.1. Clinical Data Management Systems (CDMS)
- 10.1.2. Clinical Trial Management Systems (CTMS)
- 10.1.3. Randomization and Trial Supply Management
- 10.1.4. Electronic Data Capture (EDC)
- 10.1.5. Electron
- 10.1.6. Clinical Analytics Platforms
- 10.1.7. Electronic Trial Master File (eTMF)
- 10.1.8. Other Product Types
- 10.2. Market Analysis, Insights and Forecast - by Deployment Mode
- 10.2.1. Cloud-based eClinical Solutions
- 10.2.2. On-premise eClinical Solutions
- 10.3. Market Analysis, Insights and Forecast - by End User
- 10.3.1. Pharmaceutical and Biotechnology Companies
- 10.3.2. Contract Research Organizations (CROs)
- 10.3.3. Other End Users
- 10.1. Market Analysis, Insights and Forecast - by Product Type
- 11. North America eClinical Solutions Industry Analysis, Insights and Forecast, 2019-2031
- 11.1. Market Analysis, Insights and Forecast - By Country/Sub-region
- 11.1.1 United States
- 11.1.2 Canada
- 11.1.3 Mexico
- 12. Europe eClinical Solutions Industry Analysis, Insights and Forecast, 2019-2031
- 12.1. Market Analysis, Insights and Forecast - By Country/Sub-region
- 12.1.1 Germany
- 12.1.2 United kingdom
- 12.1.3 France
- 12.1.4 Italy
- 12.1.5 Spain
- 12.1.6 Rest of Europe
- 13. Asia Pacific eClinical Solutions Industry Analysis, Insights and Forecast, 2019-2031
- 13.1. Market Analysis, Insights and Forecast - By Country/Sub-region
- 13.1.1 China
- 13.1.2 Japan
- 13.1.3 India
- 13.1.4 Australia
- 13.1.5 South Korea
- 13.1.6 Rest of Asia Pacific
- 14. Middle East and Africa eClinical Solutions Industry Analysis, Insights and Forecast, 2019-2031
- 14.1. Market Analysis, Insights and Forecast - By Country/Sub-region
- 14.1.1 GCC
- 14.1.2 South Africa
- 14.1.3 Rest of Middle East and Africa
- 15. South America eClinical Solutions Industry Analysis, Insights and Forecast, 2019-2031
- 15.1. Market Analysis, Insights and Forecast - By Country/Sub-region
- 15.1.1 Brazil
- 15.1.2 Argentina
- 15.1.3 Rest of South America
- 16. Competitive Analysis
- 16.1. Global Market Share Analysis 2024
- 16.2. Company Profiles
- 16.2.1 Merative
- 16.2.1.1. Overview
- 16.2.1.2. Products
- 16.2.1.3. SWOT Analysis
- 16.2.1.4. Recent Developments
- 16.2.1.5. Financials (Based on Availability)
- 16.2.2 Datatrak International Inc
- 16.2.2.1. Overview
- 16.2.2.2. Products
- 16.2.2.3. SWOT Analysis
- 16.2.2.4. Recent Developments
- 16.2.2.5. Financials (Based on Availability)
- 16.2.3 Castor EDC
- 16.2.3.1. Overview
- 16.2.3.2. Products
- 16.2.3.3. SWOT Analysis
- 16.2.3.4. Recent Developments
- 16.2.3.5. Financials (Based on Availability)
- 16.2.4 Covance (LabCorp)
- 16.2.4.1. Overview
- 16.2.4.2. Products
- 16.2.4.3. SWOT Analysis
- 16.2.4.4. Recent Developments
- 16.2.4.5. Financials (Based on Availability)
- 16.2.5 eClinical Solutions LLC
- 16.2.5.1. Overview
- 16.2.5.2. Products
- 16.2.5.3. SWOT Analysis
- 16.2.5.4. Recent Developments
- 16.2.5.5. Financials (Based on Availability)
- 16.2.6 Saama Technologies Inc
- 16.2.6.1. Overview
- 16.2.6.2. Products
- 16.2.6.3. SWOT Analysis
- 16.2.6.4. Recent Developments
- 16.2.6.5. Financials (Based on Availability)
- 16.2.7 Dassault Systemes (Medidata Solutions Inc )
- 16.2.7.1. Overview
- 16.2.7.2. Products
- 16.2.7.3. SWOT Analysis
- 16.2.7.4. Recent Developments
- 16.2.7.5. Financials (Based on Availability)
- 16.2.8 Mednet Solutions
- 16.2.8.1. Overview
- 16.2.8.2. Products
- 16.2.8.3. SWOT Analysis
- 16.2.8.4. Recent Developments
- 16.2.8.5. Financials (Based on Availability)
- 16.2.9 Clario (BioClinicia Inc )
- 16.2.9.1. Overview
- 16.2.9.2. Products
- 16.2.9.3. SWOT Analysis
- 16.2.9.4. Recent Developments
- 16.2.9.5. Financials (Based on Availability)
- 16.2.10 Signant Health
- 16.2.10.1. Overview
- 16.2.10.2. Products
- 16.2.10.3. SWOT Analysis
- 16.2.10.4. Recent Developments
- 16.2.10.5. Financials (Based on Availability)
- 16.2.11 IQVIA Holdings Inc
- 16.2.11.1. Overview
- 16.2.11.2. Products
- 16.2.11.3. SWOT Analysis
- 16.2.11.4. Recent Developments
- 16.2.11.5. Financials (Based on Availability)
- 16.2.12 PAREXEL International Corporation (Calyx)
- 16.2.12.1. Overview
- 16.2.12.2. Products
- 16.2.12.3. SWOT Analysis
- 16.2.12.4. Recent Developments
- 16.2.12.5. Financials (Based on Availability)
- 16.2.13 Oracle Corporation
- 16.2.13.1. Overview
- 16.2.13.2. Products
- 16.2.13.3. SWOT Analysis
- 16.2.13.4. Recent Developments
- 16.2.13.5. Financials (Based on Availability)
- 16.2.14 Medrio Inc
- 16.2.14.1. Overview
- 16.2.14.2. Products
- 16.2.14.3. SWOT Analysis
- 16.2.14.4. Recent Developments
- 16.2.14.5. Financials (Based on Availability)
- 16.2.15 Veeva Systems
- 16.2.15.1. Overview
- 16.2.15.2. Products
- 16.2.15.3. SWOT Analysis
- 16.2.15.4. Recent Developments
- 16.2.15.5. Financials (Based on Availability)
- 16.2.1 Merative
List of Figures
- Figure 1: Global eClinical Solutions Industry Revenue Breakdown (Million, %) by Region 2024 & 2032
- Figure 2: Global eClinical Solutions Industry Volume Breakdown (K Unit, %) by Region 2024 & 2032
- Figure 3: North America eClinical Solutions Industry Revenue (Million), by Country 2024 & 2032
- Figure 4: North America eClinical Solutions Industry Volume (K Unit), by Country 2024 & 2032
- Figure 5: North America eClinical Solutions Industry Revenue Share (%), by Country 2024 & 2032
- Figure 6: North America eClinical Solutions Industry Volume Share (%), by Country 2024 & 2032
- Figure 7: Europe eClinical Solutions Industry Revenue (Million), by Country 2024 & 2032
- Figure 8: Europe eClinical Solutions Industry Volume (K Unit), by Country 2024 & 2032
- Figure 9: Europe eClinical Solutions Industry Revenue Share (%), by Country 2024 & 2032
- Figure 10: Europe eClinical Solutions Industry Volume Share (%), by Country 2024 & 2032
- Figure 11: Asia Pacific eClinical Solutions Industry Revenue (Million), by Country 2024 & 2032
- Figure 12: Asia Pacific eClinical Solutions Industry Volume (K Unit), by Country 2024 & 2032
- Figure 13: Asia Pacific eClinical Solutions Industry Revenue Share (%), by Country 2024 & 2032
- Figure 14: Asia Pacific eClinical Solutions Industry Volume Share (%), by Country 2024 & 2032
- Figure 15: Middle East and Africa eClinical Solutions Industry Revenue (Million), by Country 2024 & 2032
- Figure 16: Middle East and Africa eClinical Solutions Industry Volume (K Unit), by Country 2024 & 2032
- Figure 17: Middle East and Africa eClinical Solutions Industry Revenue Share (%), by Country 2024 & 2032
- Figure 18: Middle East and Africa eClinical Solutions Industry Volume Share (%), by Country 2024 & 2032
- Figure 19: South America eClinical Solutions Industry Revenue (Million), by Country 2024 & 2032
- Figure 20: South America eClinical Solutions Industry Volume (K Unit), by Country 2024 & 2032
- Figure 21: South America eClinical Solutions Industry Revenue Share (%), by Country 2024 & 2032
- Figure 22: South America eClinical Solutions Industry Volume Share (%), by Country 2024 & 2032
- Figure 23: North America eClinical Solutions Industry Revenue (Million), by Product Type 2024 & 2032
- Figure 24: North America eClinical Solutions Industry Volume (K Unit), by Product Type 2024 & 2032
- Figure 25: North America eClinical Solutions Industry Revenue Share (%), by Product Type 2024 & 2032
- Figure 26: North America eClinical Solutions Industry Volume Share (%), by Product Type 2024 & 2032
- Figure 27: North America eClinical Solutions Industry Revenue (Million), by Deployment Mode 2024 & 2032
- Figure 28: North America eClinical Solutions Industry Volume (K Unit), by Deployment Mode 2024 & 2032
- Figure 29: North America eClinical Solutions Industry Revenue Share (%), by Deployment Mode 2024 & 2032
- Figure 30: North America eClinical Solutions Industry Volume Share (%), by Deployment Mode 2024 & 2032
- Figure 31: North America eClinical Solutions Industry Revenue (Million), by End User 2024 & 2032
- Figure 32: North America eClinical Solutions Industry Volume (K Unit), by End User 2024 & 2032
- Figure 33: North America eClinical Solutions Industry Revenue Share (%), by End User 2024 & 2032
- Figure 34: North America eClinical Solutions Industry Volume Share (%), by End User 2024 & 2032
- Figure 35: North America eClinical Solutions Industry Revenue (Million), by Country 2024 & 2032
- Figure 36: North America eClinical Solutions Industry Volume (K Unit), by Country 2024 & 2032
- Figure 37: North America eClinical Solutions Industry Revenue Share (%), by Country 2024 & 2032
- Figure 38: North America eClinical Solutions Industry Volume Share (%), by Country 2024 & 2032
- Figure 39: Europe eClinical Solutions Industry Revenue (Million), by Product Type 2024 & 2032
- Figure 40: Europe eClinical Solutions Industry Volume (K Unit), by Product Type 2024 & 2032
- Figure 41: Europe eClinical Solutions Industry Revenue Share (%), by Product Type 2024 & 2032
- Figure 42: Europe eClinical Solutions Industry Volume Share (%), by Product Type 2024 & 2032
- Figure 43: Europe eClinical Solutions Industry Revenue (Million), by Deployment Mode 2024 & 2032
- Figure 44: Europe eClinical Solutions Industry Volume (K Unit), by Deployment Mode 2024 & 2032
- Figure 45: Europe eClinical Solutions Industry Revenue Share (%), by Deployment Mode 2024 & 2032
- Figure 46: Europe eClinical Solutions Industry Volume Share (%), by Deployment Mode 2024 & 2032
- Figure 47: Europe eClinical Solutions Industry Revenue (Million), by End User 2024 & 2032
- Figure 48: Europe eClinical Solutions Industry Volume (K Unit), by End User 2024 & 2032
- Figure 49: Europe eClinical Solutions Industry Revenue Share (%), by End User 2024 & 2032
- Figure 50: Europe eClinical Solutions Industry Volume Share (%), by End User 2024 & 2032
- Figure 51: Europe eClinical Solutions Industry Revenue (Million), by Country 2024 & 2032
- Figure 52: Europe eClinical Solutions Industry Volume (K Unit), by Country 2024 & 2032
- Figure 53: Europe eClinical Solutions Industry Revenue Share (%), by Country 2024 & 2032
- Figure 54: Europe eClinical Solutions Industry Volume Share (%), by Country 2024 & 2032
- Figure 55: Asia Pacific eClinical Solutions Industry Revenue (Million), by Product Type 2024 & 2032
- Figure 56: Asia Pacific eClinical Solutions Industry Volume (K Unit), by Product Type 2024 & 2032
- Figure 57: Asia Pacific eClinical Solutions Industry Revenue Share (%), by Product Type 2024 & 2032
- Figure 58: Asia Pacific eClinical Solutions Industry Volume Share (%), by Product Type 2024 & 2032
- Figure 59: Asia Pacific eClinical Solutions Industry Revenue (Million), by Deployment Mode 2024 & 2032
- Figure 60: Asia Pacific eClinical Solutions Industry Volume (K Unit), by Deployment Mode 2024 & 2032
- Figure 61: Asia Pacific eClinical Solutions Industry Revenue Share (%), by Deployment Mode 2024 & 2032
- Figure 62: Asia Pacific eClinical Solutions Industry Volume Share (%), by Deployment Mode 2024 & 2032
- Figure 63: Asia Pacific eClinical Solutions Industry Revenue (Million), by End User 2024 & 2032
- Figure 64: Asia Pacific eClinical Solutions Industry Volume (K Unit), by End User 2024 & 2032
- Figure 65: Asia Pacific eClinical Solutions Industry Revenue Share (%), by End User 2024 & 2032
- Figure 66: Asia Pacific eClinical Solutions Industry Volume Share (%), by End User 2024 & 2032
- Figure 67: Asia Pacific eClinical Solutions Industry Revenue (Million), by Country 2024 & 2032
- Figure 68: Asia Pacific eClinical Solutions Industry Volume (K Unit), by Country 2024 & 2032
- Figure 69: Asia Pacific eClinical Solutions Industry Revenue Share (%), by Country 2024 & 2032
- Figure 70: Asia Pacific eClinical Solutions Industry Volume Share (%), by Country 2024 & 2032
- Figure 71: Middle East and Africa eClinical Solutions Industry Revenue (Million), by Product Type 2024 & 2032
- Figure 72: Middle East and Africa eClinical Solutions Industry Volume (K Unit), by Product Type 2024 & 2032
- Figure 73: Middle East and Africa eClinical Solutions Industry Revenue Share (%), by Product Type 2024 & 2032
- Figure 74: Middle East and Africa eClinical Solutions Industry Volume Share (%), by Product Type 2024 & 2032
- Figure 75: Middle East and Africa eClinical Solutions Industry Revenue (Million), by Deployment Mode 2024 & 2032
- Figure 76: Middle East and Africa eClinical Solutions Industry Volume (K Unit), by Deployment Mode 2024 & 2032
- Figure 77: Middle East and Africa eClinical Solutions Industry Revenue Share (%), by Deployment Mode 2024 & 2032
- Figure 78: Middle East and Africa eClinical Solutions Industry Volume Share (%), by Deployment Mode 2024 & 2032
- Figure 79: Middle East and Africa eClinical Solutions Industry Revenue (Million), by End User 2024 & 2032
- Figure 80: Middle East and Africa eClinical Solutions Industry Volume (K Unit), by End User 2024 & 2032
- Figure 81: Middle East and Africa eClinical Solutions Industry Revenue Share (%), by End User 2024 & 2032
- Figure 82: Middle East and Africa eClinical Solutions Industry Volume Share (%), by End User 2024 & 2032
- Figure 83: Middle East and Africa eClinical Solutions Industry Revenue (Million), by Country 2024 & 2032
- Figure 84: Middle East and Africa eClinical Solutions Industry Volume (K Unit), by Country 2024 & 2032
- Figure 85: Middle East and Africa eClinical Solutions Industry Revenue Share (%), by Country 2024 & 2032
- Figure 86: Middle East and Africa eClinical Solutions Industry Volume Share (%), by Country 2024 & 2032
- Figure 87: South America eClinical Solutions Industry Revenue (Million), by Product Type 2024 & 2032
- Figure 88: South America eClinical Solutions Industry Volume (K Unit), by Product Type 2024 & 2032
- Figure 89: South America eClinical Solutions Industry Revenue Share (%), by Product Type 2024 & 2032
- Figure 90: South America eClinical Solutions Industry Volume Share (%), by Product Type 2024 & 2032
- Figure 91: South America eClinical Solutions Industry Revenue (Million), by Deployment Mode 2024 & 2032
- Figure 92: South America eClinical Solutions Industry Volume (K Unit), by Deployment Mode 2024 & 2032
- Figure 93: South America eClinical Solutions Industry Revenue Share (%), by Deployment Mode 2024 & 2032
- Figure 94: South America eClinical Solutions Industry Volume Share (%), by Deployment Mode 2024 & 2032
- Figure 95: South America eClinical Solutions Industry Revenue (Million), by End User 2024 & 2032
- Figure 96: South America eClinical Solutions Industry Volume (K Unit), by End User 2024 & 2032
- Figure 97: South America eClinical Solutions Industry Revenue Share (%), by End User 2024 & 2032
- Figure 98: South America eClinical Solutions Industry Volume Share (%), by End User 2024 & 2032
- Figure 99: South America eClinical Solutions Industry Revenue (Million), by Country 2024 & 2032
- Figure 100: South America eClinical Solutions Industry Volume (K Unit), by Country 2024 & 2032
- Figure 101: South America eClinical Solutions Industry Revenue Share (%), by Country 2024 & 2032
- Figure 102: South America eClinical Solutions Industry Volume Share (%), by Country 2024 & 2032
List of Tables
- Table 1: Global eClinical Solutions Industry Revenue Million Forecast, by Region 2019 & 2032
- Table 2: Global eClinical Solutions Industry Volume K Unit Forecast, by Region 2019 & 2032
- Table 3: Global eClinical Solutions Industry Revenue Million Forecast, by Product Type 2019 & 2032
- Table 4: Global eClinical Solutions Industry Volume K Unit Forecast, by Product Type 2019 & 2032
- Table 5: Global eClinical Solutions Industry Revenue Million Forecast, by Deployment Mode 2019 & 2032
- Table 6: Global eClinical Solutions Industry Volume K Unit Forecast, by Deployment Mode 2019 & 2032
- Table 7: Global eClinical Solutions Industry Revenue Million Forecast, by End User 2019 & 2032
- Table 8: Global eClinical Solutions Industry Volume K Unit Forecast, by End User 2019 & 2032
- Table 9: Global eClinical Solutions Industry Revenue Million Forecast, by Region 2019 & 2032
- Table 10: Global eClinical Solutions Industry Volume K Unit Forecast, by Region 2019 & 2032
- Table 11: Global eClinical Solutions Industry Revenue Million Forecast, by Country 2019 & 2032
- Table 12: Global eClinical Solutions Industry Volume K Unit Forecast, by Country 2019 & 2032
- Table 13: United States eClinical Solutions Industry Revenue (Million) Forecast, by Application 2019 & 2032
- Table 14: United States eClinical Solutions Industry Volume (K Unit) Forecast, by Application 2019 & 2032
- Table 15: Canada eClinical Solutions Industry Revenue (Million) Forecast, by Application 2019 & 2032
- Table 16: Canada eClinical Solutions Industry Volume (K Unit) Forecast, by Application 2019 & 2032
- Table 17: Mexico eClinical Solutions Industry Revenue (Million) Forecast, by Application 2019 & 2032
- Table 18: Mexico eClinical Solutions Industry Volume (K Unit) Forecast, by Application 2019 & 2032
- Table 19: Global eClinical Solutions Industry Revenue Million Forecast, by Country 2019 & 2032
- Table 20: Global eClinical Solutions Industry Volume K Unit Forecast, by Country 2019 & 2032
- Table 21: Germany eClinical Solutions Industry Revenue (Million) Forecast, by Application 2019 & 2032
- Table 22: Germany eClinical Solutions Industry Volume (K Unit) Forecast, by Application 2019 & 2032
- Table 23: United kingdom eClinical Solutions Industry Revenue (Million) Forecast, by Application 2019 & 2032
- Table 24: United kingdom eClinical Solutions Industry Volume (K Unit) Forecast, by Application 2019 & 2032
- Table 25: France eClinical Solutions Industry Revenue (Million) Forecast, by Application 2019 & 2032
- Table 26: France eClinical Solutions Industry Volume (K Unit) Forecast, by Application 2019 & 2032
- Table 27: Italy eClinical Solutions Industry Revenue (Million) Forecast, by Application 2019 & 2032
- Table 28: Italy eClinical Solutions Industry Volume (K Unit) Forecast, by Application 2019 & 2032
- Table 29: Spain eClinical Solutions Industry Revenue (Million) Forecast, by Application 2019 & 2032
- Table 30: Spain eClinical Solutions Industry Volume (K Unit) Forecast, by Application 2019 & 2032
- Table 31: Rest of Europe eClinical Solutions Industry Revenue (Million) Forecast, by Application 2019 & 2032
- Table 32: Rest of Europe eClinical Solutions Industry Volume (K Unit) Forecast, by Application 2019 & 2032
- Table 33: Global eClinical Solutions Industry Revenue Million Forecast, by Country 2019 & 2032
- Table 34: Global eClinical Solutions Industry Volume K Unit Forecast, by Country 2019 & 2032
- Table 35: China eClinical Solutions Industry Revenue (Million) Forecast, by Application 2019 & 2032
- Table 36: China eClinical Solutions Industry Volume (K Unit) Forecast, by Application 2019 & 2032
- Table 37: Japan eClinical Solutions Industry Revenue (Million) Forecast, by Application 2019 & 2032
- Table 38: Japan eClinical Solutions Industry Volume (K Unit) Forecast, by Application 2019 & 2032
- Table 39: India eClinical Solutions Industry Revenue (Million) Forecast, by Application 2019 & 2032
- Table 40: India eClinical Solutions Industry Volume (K Unit) Forecast, by Application 2019 & 2032
- Table 41: Australia eClinical Solutions Industry Revenue (Million) Forecast, by Application 2019 & 2032
- Table 42: Australia eClinical Solutions Industry Volume (K Unit) Forecast, by Application 2019 & 2032
- Table 43: South Korea eClinical Solutions Industry Revenue (Million) Forecast, by Application 2019 & 2032
- Table 44: South Korea eClinical Solutions Industry Volume (K Unit) Forecast, by Application 2019 & 2032
- Table 45: Rest of Asia Pacific eClinical Solutions Industry Revenue (Million) Forecast, by Application 2019 & 2032
- Table 46: Rest of Asia Pacific eClinical Solutions Industry Volume (K Unit) Forecast, by Application 2019 & 2032
- Table 47: Global eClinical Solutions Industry Revenue Million Forecast, by Country 2019 & 2032
- Table 48: Global eClinical Solutions Industry Volume K Unit Forecast, by Country 2019 & 2032
- Table 49: GCC eClinical Solutions Industry Revenue (Million) Forecast, by Application 2019 & 2032
- Table 50: GCC eClinical Solutions Industry Volume (K Unit) Forecast, by Application 2019 & 2032
- Table 51: South Africa eClinical Solutions Industry Revenue (Million) Forecast, by Application 2019 & 2032
- Table 52: South Africa eClinical Solutions Industry Volume (K Unit) Forecast, by Application 2019 & 2032
- Table 53: Rest of Middle East and Africa eClinical Solutions Industry Revenue (Million) Forecast, by Application 2019 & 2032
- Table 54: Rest of Middle East and Africa eClinical Solutions Industry Volume (K Unit) Forecast, by Application 2019 & 2032
- Table 55: Global eClinical Solutions Industry Revenue Million Forecast, by Country 2019 & 2032
- Table 56: Global eClinical Solutions Industry Volume K Unit Forecast, by Country 2019 & 2032
- Table 57: Brazil eClinical Solutions Industry Revenue (Million) Forecast, by Application 2019 & 2032
- Table 58: Brazil eClinical Solutions Industry Volume (K Unit) Forecast, by Application 2019 & 2032
- Table 59: Argentina eClinical Solutions Industry Revenue (Million) Forecast, by Application 2019 & 2032
- Table 60: Argentina eClinical Solutions Industry Volume (K Unit) Forecast, by Application 2019 & 2032
- Table 61: Rest of South America eClinical Solutions Industry Revenue (Million) Forecast, by Application 2019 & 2032
- Table 62: Rest of South America eClinical Solutions Industry Volume (K Unit) Forecast, by Application 2019 & 2032
- Table 63: Global eClinical Solutions Industry Revenue Million Forecast, by Product Type 2019 & 2032
- Table 64: Global eClinical Solutions Industry Volume K Unit Forecast, by Product Type 2019 & 2032
- Table 65: Global eClinical Solutions Industry Revenue Million Forecast, by Deployment Mode 2019 & 2032
- Table 66: Global eClinical Solutions Industry Volume K Unit Forecast, by Deployment Mode 2019 & 2032
- Table 67: Global eClinical Solutions Industry Revenue Million Forecast, by End User 2019 & 2032
- Table 68: Global eClinical Solutions Industry Volume K Unit Forecast, by End User 2019 & 2032
- Table 69: Global eClinical Solutions Industry Revenue Million Forecast, by Country 2019 & 2032
- Table 70: Global eClinical Solutions Industry Volume K Unit Forecast, by Country 2019 & 2032
- Table 71: United States eClinical Solutions Industry Revenue (Million) Forecast, by Application 2019 & 2032
- Table 72: United States eClinical Solutions Industry Volume (K Unit) Forecast, by Application 2019 & 2032
- Table 73: Canada eClinical Solutions Industry Revenue (Million) Forecast, by Application 2019 & 2032
- Table 74: Canada eClinical Solutions Industry Volume (K Unit) Forecast, by Application 2019 & 2032
- Table 75: Mexico eClinical Solutions Industry Revenue (Million) Forecast, by Application 2019 & 2032
- Table 76: Mexico eClinical Solutions Industry Volume (K Unit) Forecast, by Application 2019 & 2032
- Table 77: Global eClinical Solutions Industry Revenue Million Forecast, by Product Type 2019 & 2032
- Table 78: Global eClinical Solutions Industry Volume K Unit Forecast, by Product Type 2019 & 2032
- Table 79: Global eClinical Solutions Industry Revenue Million Forecast, by Deployment Mode 2019 & 2032
- Table 80: Global eClinical Solutions Industry Volume K Unit Forecast, by Deployment Mode 2019 & 2032
- Table 81: Global eClinical Solutions Industry Revenue Million Forecast, by End User 2019 & 2032
- Table 82: Global eClinical Solutions Industry Volume K Unit Forecast, by End User 2019 & 2032
- Table 83: Global eClinical Solutions Industry Revenue Million Forecast, by Country 2019 & 2032
- Table 84: Global eClinical Solutions Industry Volume K Unit Forecast, by Country 2019 & 2032
- Table 85: Germany eClinical Solutions Industry Revenue (Million) Forecast, by Application 2019 & 2032
- Table 86: Germany eClinical Solutions Industry Volume (K Unit) Forecast, by Application 2019 & 2032
- Table 87: United kingdom eClinical Solutions Industry Revenue (Million) Forecast, by Application 2019 & 2032
- Table 88: United kingdom eClinical Solutions Industry Volume (K Unit) Forecast, by Application 2019 & 2032
- Table 89: France eClinical Solutions Industry Revenue (Million) Forecast, by Application 2019 & 2032
- Table 90: France eClinical Solutions Industry Volume (K Unit) Forecast, by Application 2019 & 2032
- Table 91: Italy eClinical Solutions Industry Revenue (Million) Forecast, by Application 2019 & 2032
- Table 92: Italy eClinical Solutions Industry Volume (K Unit) Forecast, by Application 2019 & 2032
- Table 93: Spain eClinical Solutions Industry Revenue (Million) Forecast, by Application 2019 & 2032
- Table 94: Spain eClinical Solutions Industry Volume (K Unit) Forecast, by Application 2019 & 2032
- Table 95: Rest of Europe eClinical Solutions Industry Revenue (Million) Forecast, by Application 2019 & 2032
- Table 96: Rest of Europe eClinical Solutions Industry Volume (K Unit) Forecast, by Application 2019 & 2032
- Table 97: Global eClinical Solutions Industry Revenue Million Forecast, by Product Type 2019 & 2032
- Table 98: Global eClinical Solutions Industry Volume K Unit Forecast, by Product Type 2019 & 2032
- Table 99: Global eClinical Solutions Industry Revenue Million Forecast, by Deployment Mode 2019 & 2032
- Table 100: Global eClinical Solutions Industry Volume K Unit Forecast, by Deployment Mode 2019 & 2032
- Table 101: Global eClinical Solutions Industry Revenue Million Forecast, by End User 2019 & 2032
- Table 102: Global eClinical Solutions Industry Volume K Unit Forecast, by End User 2019 & 2032
- Table 103: Global eClinical Solutions Industry Revenue Million Forecast, by Country 2019 & 2032
- Table 104: Global eClinical Solutions Industry Volume K Unit Forecast, by Country 2019 & 2032
- Table 105: China eClinical Solutions Industry Revenue (Million) Forecast, by Application 2019 & 2032
- Table 106: China eClinical Solutions Industry Volume (K Unit) Forecast, by Application 2019 & 2032
- Table 107: Japan eClinical Solutions Industry Revenue (Million) Forecast, by Application 2019 & 2032
- Table 108: Japan eClinical Solutions Industry Volume (K Unit) Forecast, by Application 2019 & 2032
- Table 109: India eClinical Solutions Industry Revenue (Million) Forecast, by Application 2019 & 2032
- Table 110: India eClinical Solutions Industry Volume (K Unit) Forecast, by Application 2019 & 2032
- Table 111: Australia eClinical Solutions Industry Revenue (Million) Forecast, by Application 2019 & 2032
- Table 112: Australia eClinical Solutions Industry Volume (K Unit) Forecast, by Application 2019 & 2032
- Table 113: South Korea eClinical Solutions Industry Revenue (Million) Forecast, by Application 2019 & 2032
- Table 114: South Korea eClinical Solutions Industry Volume (K Unit) Forecast, by Application 2019 & 2032
- Table 115: Rest of Asia Pacific eClinical Solutions Industry Revenue (Million) Forecast, by Application 2019 & 2032
- Table 116: Rest of Asia Pacific eClinical Solutions Industry Volume (K Unit) Forecast, by Application 2019 & 2032
- Table 117: Global eClinical Solutions Industry Revenue Million Forecast, by Product Type 2019 & 2032
- Table 118: Global eClinical Solutions Industry Volume K Unit Forecast, by Product Type 2019 & 2032
- Table 119: Global eClinical Solutions Industry Revenue Million Forecast, by Deployment Mode 2019 & 2032
- Table 120: Global eClinical Solutions Industry Volume K Unit Forecast, by Deployment Mode 2019 & 2032
- Table 121: Global eClinical Solutions Industry Revenue Million Forecast, by End User 2019 & 2032
- Table 122: Global eClinical Solutions Industry Volume K Unit Forecast, by End User 2019 & 2032
- Table 123: Global eClinical Solutions Industry Revenue Million Forecast, by Country 2019 & 2032
- Table 124: Global eClinical Solutions Industry Volume K Unit Forecast, by Country 2019 & 2032
- Table 125: GCC eClinical Solutions Industry Revenue (Million) Forecast, by Application 2019 & 2032
- Table 126: GCC eClinical Solutions Industry Volume (K Unit) Forecast, by Application 2019 & 2032
- Table 127: South Africa eClinical Solutions Industry Revenue (Million) Forecast, by Application 2019 & 2032
- Table 128: South Africa eClinical Solutions Industry Volume (K Unit) Forecast, by Application 2019 & 2032
- Table 129: Rest of Middle East and Africa eClinical Solutions Industry Revenue (Million) Forecast, by Application 2019 & 2032
- Table 130: Rest of Middle East and Africa eClinical Solutions Industry Volume (K Unit) Forecast, by Application 2019 & 2032
- Table 131: Global eClinical Solutions Industry Revenue Million Forecast, by Product Type 2019 & 2032
- Table 132: Global eClinical Solutions Industry Volume K Unit Forecast, by Product Type 2019 & 2032
- Table 133: Global eClinical Solutions Industry Revenue Million Forecast, by Deployment Mode 2019 & 2032
- Table 134: Global eClinical Solutions Industry Volume K Unit Forecast, by Deployment Mode 2019 & 2032
- Table 135: Global eClinical Solutions Industry Revenue Million Forecast, by End User 2019 & 2032
- Table 136: Global eClinical Solutions Industry Volume K Unit Forecast, by End User 2019 & 2032
- Table 137: Global eClinical Solutions Industry Revenue Million Forecast, by Country 2019 & 2032
- Table 138: Global eClinical Solutions Industry Volume K Unit Forecast, by Country 2019 & 2032
- Table 139: Brazil eClinical Solutions Industry Revenue (Million) Forecast, by Application 2019 & 2032
- Table 140: Brazil eClinical Solutions Industry Volume (K Unit) Forecast, by Application 2019 & 2032
- Table 141: Argentina eClinical Solutions Industry Revenue (Million) Forecast, by Application 2019 & 2032
- Table 142: Argentina eClinical Solutions Industry Volume (K Unit) Forecast, by Application 2019 & 2032
- Table 143: Rest of South America eClinical Solutions Industry Revenue (Million) Forecast, by Application 2019 & 2032
- Table 144: Rest of South America eClinical Solutions Industry Volume (K Unit) Forecast, by Application 2019 & 2032
Frequently Asked Questions
1. What is the projected Compound Annual Growth Rate (CAGR) of the eClinical Solutions Industry?
The projected CAGR is approximately 12.42%.
2. Which companies are prominent players in the eClinical Solutions Industry?
Key companies in the market include Merative, Datatrak International Inc, Castor EDC, Covance (LabCorp), eClinical Solutions LLC, Saama Technologies Inc, Dassault Systemes (Medidata Solutions Inc ), Mednet Solutions, Clario (BioClinicia Inc ), Signant Health, IQVIA Holdings Inc, PAREXEL International Corporation (Calyx), Oracle Corporation, Medrio Inc, Veeva Systems.
3. What are the main segments of the eClinical Solutions Industry?
The market segments include Product Type, Deployment Mode, End User.
4. Can you provide details about the market size?
The market size is estimated to be USD 11.02 Million as of 2022.
5. What are some drivers contributing to market growth?
Enormous Data Mounting from the Healthcare Industry; Rising Number of Clinical Trials; Government Emphasis on Clinical Research.
6. What are the notable trends driving market growth?
Clinical Data Management Systems Segment is Expected to Hold a Significant Market Share Over the Forecast Period.
7. Are there any restraints impacting market growth?
Lack of Awareness and Infrastructure in Developing Countries; High Implementation Costs.
8. Can you provide examples of recent developments in the market?
January 2023: Veeva Systems was selected by Adare Pharma Solutions, a contract development and manufacturing organization (CDMO) with expertise in oral dosage forms. The company selected Veeva Vault Quality Suite to harmonize quality systems across the organization.
9. What pricing options are available for accessing the report?
Pricing options include single-user, multi-user, and enterprise licenses priced at USD 4750, USD 5250, and USD 8750 respectively.
10. Is the market size provided in terms of value or volume?
The market size is provided in terms of value, measured in Million and volume, measured in K Unit.
11. Are there any specific market keywords associated with the report?
Yes, the market keyword associated with the report is "eClinical Solutions Industry," which aids in identifying and referencing the specific market segment covered.
12. How do I determine which pricing option suits my needs best?
The pricing options vary based on user requirements and access needs. Individual users may opt for single-user licenses, while businesses requiring broader access may choose multi-user or enterprise licenses for cost-effective access to the report.
13. Are there any additional resources or data provided in the eClinical Solutions Industry report?
While the report offers comprehensive insights, it's advisable to review the specific contents or supplementary materials provided to ascertain if additional resources or data are available.
14. How can I stay updated on further developments or reports in the eClinical Solutions Industry?
To stay informed about further developments, trends, and reports in the eClinical Solutions Industry, consider subscribing to industry newsletters, following relevant companies and organizations, or regularly checking reputable industry news sources and publications.
Methodology
Step 1 - Identification of Relevant Samples Size from Population Database


Step 2 - Approaches for Defining Global Market Size (Value, Volume* & Price*)

Note*: In applicable scenarios
Step 3 - Data Sources
Primary Research
- Web Analytics
- Survey Reports
- Research Institute
- Latest Research Reports
- Opinion Leaders
Secondary Research
- Annual Reports
- White Paper
- Latest Press Release
- Industry Association
- Paid Database
- Investor Presentations

Step 4 - Data Triangulation
Involves using different sources of information in order to increase the validity of a study
These sources are likely to be stakeholders in a program - participants, other researchers, program staff, other community members, and so on.
Then we put all data in single framework & apply various statistical tools to find out the dynamic on the market.
During the analysis stage, feedback from the stakeholder groups would be compared to determine areas of agreement as well as areas of divergence
