

Key Insights
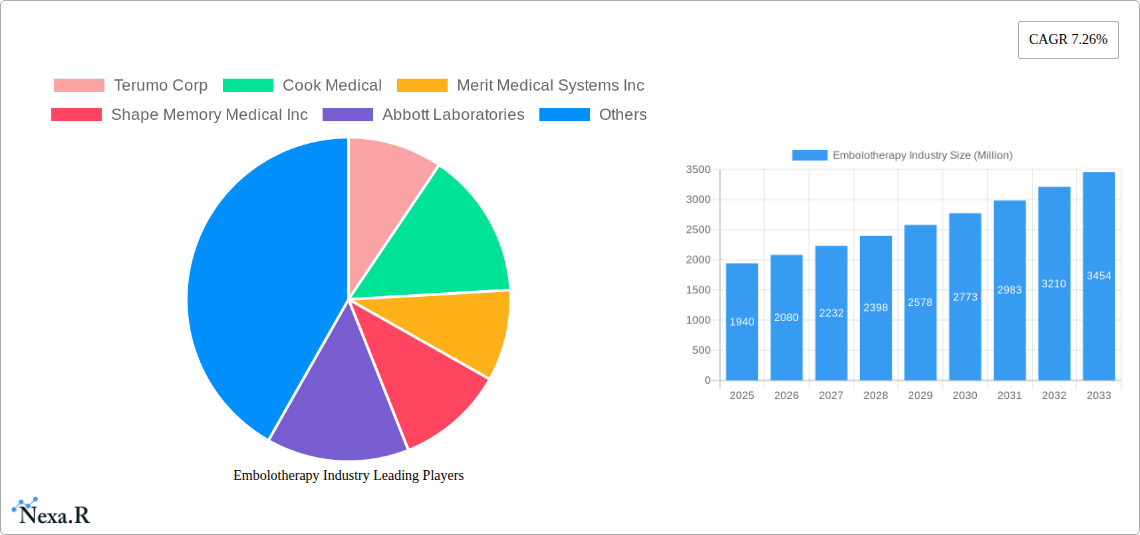
The global embolization therapy market, valued at $1.94 billion in 2025, is projected to experience robust growth, driven by a Compound Annual Growth Rate (CAGR) of 7.26% from 2025 to 2033. This expansion is fueled by several key factors. The rising prevalence of cardiovascular diseases, particularly peripheral vascular disease (PVD), necessitates increased embolization procedures. Advancements in minimally invasive techniques, such as improved coiling devices and non-coiling alternatives, contribute to enhanced treatment efficacy and patient outcomes. Furthermore, the expanding applications of embolization therapy across oncology, neurology, and urology, alongside the development of innovative materials and device designs, further stimulate market growth. Increased adoption of embolization therapy in emerging economies, fueled by rising healthcare expenditure and improved infrastructure, also contributes to this expansion.
However, the market faces certain restraints. High procedure costs and the need for specialized expertise can limit accessibility, particularly in resource-constrained settings. Moreover, potential complications associated with embolization procedures, including bleeding and infection, necessitate careful patient selection and meticulous procedural execution. Regulatory hurdles and the time-intensive process of obtaining regulatory approvals for new devices could also impede market expansion. Despite these challenges, the overall market trajectory remains positive, propelled by technological advancements, increasing disease prevalence, and the growing awareness of embolization therapy's benefits among both healthcare professionals and patients. The market segmentation, which includes various embolization techniques (coiling and non-coiling devices) and diverse applications across different medical specialities, offers further opportunities for targeted market development and growth across different segments.
Embolotherapy Industry Market Report: 2019-2033
This comprehensive report provides a detailed analysis of the Embolotherapy industry, encompassing market dynamics, growth trends, regional dominance, product landscape, key players, and future outlook. The study period covers 2019-2033, with a base year of 2025 and a forecast period of 2025-2033. The report is essential for industry professionals, investors, and strategists seeking in-depth insights into this rapidly evolving medical device sector. The total market size in 2025 is estimated at $XX Billion.
Embolotherapy Industry Market Dynamics & Structure
The global embolotherapy market is characterized by a moderately concentrated landscape, with a few major players holding significant market share. Technological innovation, particularly in minimally invasive procedures and advanced embolic agents, is a key driver. Stringent regulatory frameworks, including FDA approvals in the US and CE marking in Europe, influence market access and product development. Competitive substitutes, such as surgical interventions, exert pressure on market growth. The end-user demographic is primarily driven by the increasing prevalence of vascular diseases and oncology cases across the globe. Mergers and acquisitions (M&A) activity has been moderate, with strategic partnerships focusing on expanding product portfolios and geographical reach.
- Market Concentration: Moderately concentrated, with top 5 players holding approximately xx% market share in 2025.
- Technological Innovation: Focus on minimally invasive techniques, biocompatible materials, and targeted drug delivery.
- Regulatory Framework: Stringent approvals (FDA, CE mark) impact market entry and product lifecycle.
- Competitive Substitutes: Surgical interventions pose a competitive challenge.
- M&A Activity: xx deals recorded in the historical period (2019-2024), with a projected xx deals for the forecast period (2025-2033).
- End-User Demographics: Aging population and rising incidence of vascular diseases and cancer are key drivers.
Embolotherapy Industry Growth Trends & Insights
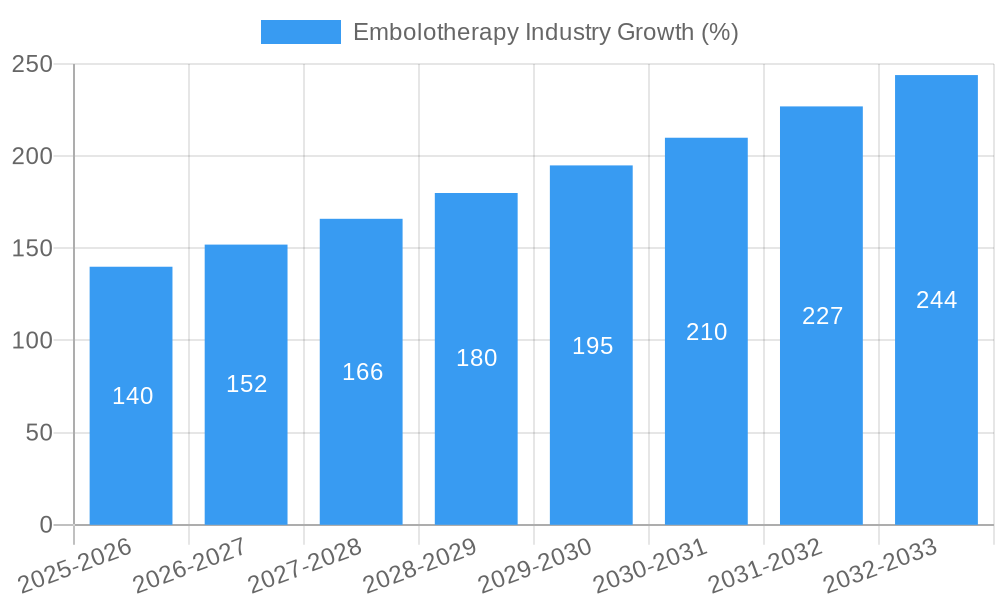
The embolotherapy market exhibits a robust growth trajectory, driven by several factors. The rising prevalence of target conditions like peripheral artery disease (PAD), aneurysms, and various cancers fuels demand. Technological advancements leading to improved device efficacy and safety profiles further enhance market adoption. The shift towards minimally invasive procedures, patient preference for less invasive options, and favorable reimbursement policies in several regions contribute significantly to growth. The market experienced a CAGR of xx% during the historical period (2019-2024) and is projected to grow at a CAGR of xx% during the forecast period (2025-2033). Market penetration for embolotherapy procedures is estimated at xx% in 2025, expected to reach xx% by 2033. Consumer behavior is shifting towards more precise and effective treatments with shorter recovery times.
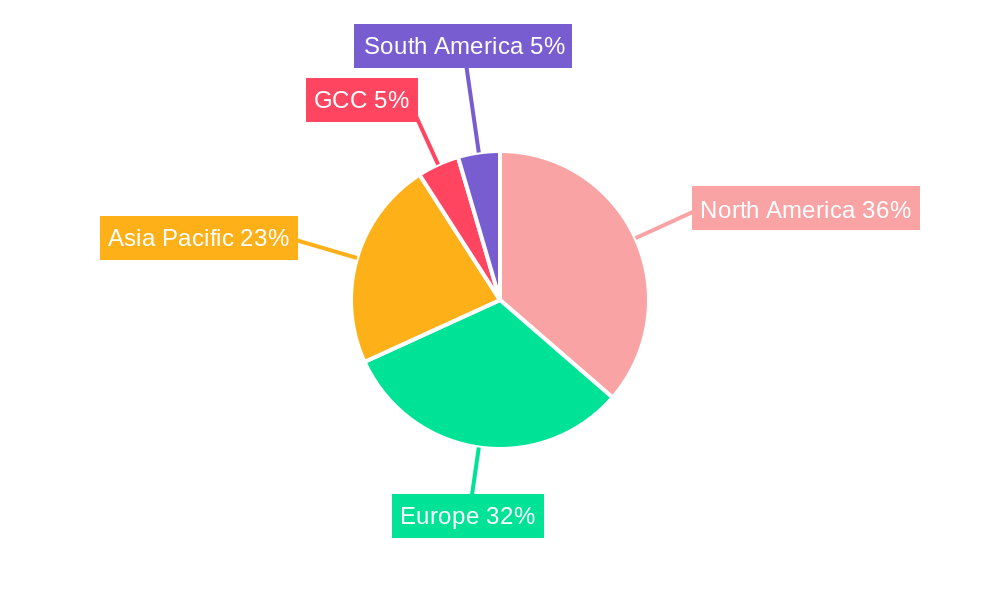
Dominant Regions, Countries, or Segments in Embolotherapy Industry
North America currently holds the largest market share, driven by high healthcare expenditure, advanced medical infrastructure, and a large patient pool. Europe follows as a significant market, exhibiting strong growth potential. Asia-Pacific is also showing rapid expansion, fueled by rising healthcare awareness and increasing disposable incomes. Within the segmentation, Peripheral Vascular Disease (PVD) currently dominates the application segment, followed by Oncology and Neurology. Coiling devices represent the larger segment within embolization techniques.
- North America: High healthcare spending, advanced infrastructure, and large patient pool contribute to dominance.
- Europe: Strong growth potential driven by increasing prevalence of target conditions and technological advancements.
- Asia-Pacific: Rapid expansion fueled by improving healthcare infrastructure and rising disposable incomes.
- Segment Dominance: Peripheral Vascular Disease (PVD) leads in application, with Coiling devices leading in Embolization Technique.
Embolotherapy Industry Product Landscape
The embolotherapy product landscape is characterized by a diverse range of devices, including coils, liquid embolic agents, and vascular plugs. Recent innovations focus on improved biocompatibility, enhanced deliverability, and precise occlusion capabilities. These advancements aim to minimize complications, reduce procedure times, and improve patient outcomes. Key features include improved navigability, enhanced thrombogenicity, and tailored material properties for specific applications.
Key Drivers, Barriers & Challenges in Embolotherapy Industry
Key Drivers:
- Rising prevalence of target diseases (e.g., PVD, aneurysms, cancer).
- Technological advancements resulting in improved device efficacy and safety.
- Growing preference for minimally invasive procedures.
- Favorable reimbursement policies in several regions.
Key Challenges:
- High cost of procedures can limit accessibility, especially in developing countries. (Impact: xx% reduction in market potential in low-income regions)
- Stringent regulatory pathways can delay product launches and increase development costs. (Impact: xx months delay in average product launch)
- Intense competition among established players and emerging companies. (Impact: pressure on pricing and margins)
- Supply chain disruptions can affect device availability and lead times. (Impact: xx% increase in device costs during disruption periods)
Emerging Opportunities in Embolotherapy Industry
- Expanding into untapped markets in developing economies.
- Development of novel embolic agents with improved efficacy and biocompatibility.
- Personalized medicine approaches tailored to individual patient needs.
- Growing application in new therapeutic areas (e.g., uterine fibroids, hypervascular tumors).
Growth Accelerators in the Embolotherapy Industry
Technological advancements, including the development of bioabsorbable embolic materials and image-guided systems, are key growth catalysts. Strategic partnerships and collaborations between device manufacturers and healthcare providers enhance market penetration. Expanding into emerging markets and focusing on unmet medical needs are also crucial growth strategies.
Key Players Shaping the Embolotherapy Industry Market
- Terumo Corp
- Cook Medical
- Merit Medical Systems Inc
- Shape Memory Medical Inc
- Abbott Laboratories
- Medtronic PLC
- Johnson and Johnson (CERENOVUS)
- B Braun Melsungen AG
- Stryker Corporation
- Boston Scientific Corporation
- W L Gore & Associates Inc
- Penumbra Inc
Notable Milestones in Embolotherapy Industry Sector
- July 2021: Terumo Medical Corporation introduces AZUR Vascular Plug, compatible with microcatheters to occlude arteries up to 8mm.
- April 2021: FDA approves Medtronic PLC's Pipeline Flex Embolization Device with Shield Technology for brain aneurysms.
In-Depth Embolotherapy Industry Market Outlook
The embolotherapy market is poised for continued strong growth, driven by the factors mentioned previously. Strategic investments in R&D, expansion into new therapeutic areas, and the adoption of innovative technologies will shape the future market landscape. The increasing prevalence of chronic diseases and the rising demand for minimally invasive procedures will create lucrative opportunities for market players. Focusing on patient-centric solutions and improving healthcare accessibility will further drive market expansion.
Embolotherapy Industry Segmentation
-
1. Embolization Technique
- 1.1. Coiling Devices
- 1.2. Non-coiling Devices
-
2. Application
- 2.1. Peripheral Vascular Disease
- 2.2. Oncology
- 2.3. Neurology
- 2.4. Urology
- 2.5. Other Applications
Embolotherapy Industry Segmentation By Geography
-
1. North America
- 1.1. United States
- 1.2. Canada
- 1.3. Mexico
-
2. Europe
- 2.1. Germany
- 2.2. United Kingdom
- 2.3. France
- 2.4. Italy
- 2.5. Spain
- 2.6. Rest of Europe
-
3. Asia Pacific
- 3.1. China
- 3.2. Japan
- 3.3. India
- 3.4. Australia
- 3.5. South Korea
- 3.6. Rest of Asia Pacific
- 4. Middle East
-
5. GCC
- 5.1. South Africa
- 5.2. Rest of Middle East
-
6. South America
- 6.1. Brazil
- 6.2. Argentina
- 6.3. Rest of South America
Embolotherapy Industry REPORT HIGHLIGHTS
| Aspects | Details |
|---|---|
| Study Period | 2019-2033 |
| Base Year | 2024 |
| Estimated Year | 2025 |
| Forecast Period | 2025-2033 |
| Historical Period | 2019-2024 |
| Growth Rate | CAGR of 7.26% from 2019-2033 |
| Segmentation |
|
Table of Contents
- 1. Introduction
- 1.1. Research Scope
- 1.2. Market Segmentation
- 1.3. Research Methodology
- 1.4. Definitions and Assumptions
- 2. Executive Summary
- 2.1. Introduction
- 3. Market Dynamics
- 3.1. Introduction
- 3.2. Market Drivers
- 3.2.1. Increasing Prevalence of Vascular Diseases; Technological Advancements in Embolization Products and Procedures; Increasing Research and Development Activities
- 3.3. Market Restrains
- 3.3.1. High Costs Associated with Embolization Procedures; Stringent Regulatory Norms; Complications Associated with Embolization Procedures
- 3.4. Market Trends
- 3.4.1. The Non-coiling Devices Segment is Expected to Hold a Major Market Share in the Vascular Embolization Market over the Forecast Period
- 4. Market Factor Analysis
- 4.1. Porters Five Forces
- 4.2. Supply/Value Chain
- 4.3. PESTEL analysis
- 4.4. Market Entropy
- 4.5. Patent/Trademark Analysis
- 5. Global Embolotherapy Industry Analysis, Insights and Forecast, 2019-2031
- 5.1. Market Analysis, Insights and Forecast - by Embolization Technique
- 5.1.1. Coiling Devices
- 5.1.2. Non-coiling Devices
- 5.2. Market Analysis, Insights and Forecast - by Application
- 5.2.1. Peripheral Vascular Disease
- 5.2.2. Oncology
- 5.2.3. Neurology
- 5.2.4. Urology
- 5.2.5. Other Applications
- 5.3. Market Analysis, Insights and Forecast - by Region
- 5.3.1. North America
- 5.3.2. Europe
- 5.3.3. Asia Pacific
- 5.3.4. Middle East
- 5.3.5. GCC
- 5.3.6. South America
- 5.1. Market Analysis, Insights and Forecast - by Embolization Technique
- 6. North America Embolotherapy Industry Analysis, Insights and Forecast, 2019-2031
- 6.1. Market Analysis, Insights and Forecast - by Embolization Technique
- 6.1.1. Coiling Devices
- 6.1.2. Non-coiling Devices
- 6.2. Market Analysis, Insights and Forecast - by Application
- 6.2.1. Peripheral Vascular Disease
- 6.2.2. Oncology
- 6.2.3. Neurology
- 6.2.4. Urology
- 6.2.5. Other Applications
- 6.1. Market Analysis, Insights and Forecast - by Embolization Technique
- 7. Europe Embolotherapy Industry Analysis, Insights and Forecast, 2019-2031
- 7.1. Market Analysis, Insights and Forecast - by Embolization Technique
- 7.1.1. Coiling Devices
- 7.1.2. Non-coiling Devices
- 7.2. Market Analysis, Insights and Forecast - by Application
- 7.2.1. Peripheral Vascular Disease
- 7.2.2. Oncology
- 7.2.3. Neurology
- 7.2.4. Urology
- 7.2.5. Other Applications
- 7.1. Market Analysis, Insights and Forecast - by Embolization Technique
- 8. Asia Pacific Embolotherapy Industry Analysis, Insights and Forecast, 2019-2031
- 8.1. Market Analysis, Insights and Forecast - by Embolization Technique
- 8.1.1. Coiling Devices
- 8.1.2. Non-coiling Devices
- 8.2. Market Analysis, Insights and Forecast - by Application
- 8.2.1. Peripheral Vascular Disease
- 8.2.2. Oncology
- 8.2.3. Neurology
- 8.2.4. Urology
- 8.2.5. Other Applications
- 8.1. Market Analysis, Insights and Forecast - by Embolization Technique
- 9. Middle East Embolotherapy Industry Analysis, Insights and Forecast, 2019-2031
- 9.1. Market Analysis, Insights and Forecast - by Embolization Technique
- 9.1.1. Coiling Devices
- 9.1.2. Non-coiling Devices
- 9.2. Market Analysis, Insights and Forecast - by Application
- 9.2.1. Peripheral Vascular Disease
- 9.2.2. Oncology
- 9.2.3. Neurology
- 9.2.4. Urology
- 9.2.5. Other Applications
- 9.1. Market Analysis, Insights and Forecast - by Embolization Technique
- 10. GCC Embolotherapy Industry Analysis, Insights and Forecast, 2019-2031
- 10.1. Market Analysis, Insights and Forecast - by Embolization Technique
- 10.1.1. Coiling Devices
- 10.1.2. Non-coiling Devices
- 10.2. Market Analysis, Insights and Forecast - by Application
- 10.2.1. Peripheral Vascular Disease
- 10.2.2. Oncology
- 10.2.3. Neurology
- 10.2.4. Urology
- 10.2.5. Other Applications
- 10.1. Market Analysis, Insights and Forecast - by Embolization Technique
- 11. South America Embolotherapy Industry Analysis, Insights and Forecast, 2019-2031
- 11.1. Market Analysis, Insights and Forecast - by Embolization Technique
- 11.1.1. Coiling Devices
- 11.1.2. Non-coiling Devices
- 11.2. Market Analysis, Insights and Forecast - by Application
- 11.2.1. Peripheral Vascular Disease
- 11.2.2. Oncology
- 11.2.3. Neurology
- 11.2.4. Urology
- 11.2.5. Other Applications
- 11.1. Market Analysis, Insights and Forecast - by Embolization Technique
- 12. North America Embolotherapy Industry Analysis, Insights and Forecast, 2019-2031
- 12.1. Market Analysis, Insights and Forecast - By Country/Sub-region
- 12.1.1. undefined
- 13. Europe Embolotherapy Industry Analysis, Insights and Forecast, 2019-2031
- 13.1. Market Analysis, Insights and Forecast - By Country/Sub-region
- 13.1.1. undefined
- 14. Asia Pacific Embolotherapy Industry Analysis, Insights and Forecast, 2019-2031
- 14.1. Market Analysis, Insights and Forecast - By Country/Sub-region
- 14.1.1. undefined
- 15. GCC Embolotherapy Industry Analysis, Insights and Forecast, 2019-2031
- 15.1. Market Analysis, Insights and Forecast - By Country/Sub-region
- 15.1.1. undefined
- 16. South America Embolotherapy Industry Analysis, Insights and Forecast, 2019-2031
- 16.1. Market Analysis, Insights and Forecast - By Country/Sub-region
- 16.1.1. undefined
- 17. Competitive Analysis
- 17.1. Global Market Share Analysis 2024
- 17.2. Company Profiles
- 17.2.1 Terumo Corp
- 17.2.1.1. Overview
- 17.2.1.2. Products
- 17.2.1.3. SWOT Analysis
- 17.2.1.4. Recent Developments
- 17.2.1.5. Financials (Based on Availability)
- 17.2.2 Cook Medical
- 17.2.2.1. Overview
- 17.2.2.2. Products
- 17.2.2.3. SWOT Analysis
- 17.2.2.4. Recent Developments
- 17.2.2.5. Financials (Based on Availability)
- 17.2.3 Merit Medical Systems Inc
- 17.2.3.1. Overview
- 17.2.3.2. Products
- 17.2.3.3. SWOT Analysis
- 17.2.3.4. Recent Developments
- 17.2.3.5. Financials (Based on Availability)
- 17.2.4 Shape Memory Medical Inc
- 17.2.4.1. Overview
- 17.2.4.2. Products
- 17.2.4.3. SWOT Analysis
- 17.2.4.4. Recent Developments
- 17.2.4.5. Financials (Based on Availability)
- 17.2.5 Abbott Laboratories
- 17.2.5.1. Overview
- 17.2.5.2. Products
- 17.2.5.3. SWOT Analysis
- 17.2.5.4. Recent Developments
- 17.2.5.5. Financials (Based on Availability)
- 17.2.6 Medtronic PLC
- 17.2.6.1. Overview
- 17.2.6.2. Products
- 17.2.6.3. SWOT Analysis
- 17.2.6.4. Recent Developments
- 17.2.6.5. Financials (Based on Availability)
- 17.2.7 Johnson and Johnson (CERENOVUS)
- 17.2.7.1. Overview
- 17.2.7.2. Products
- 17.2.7.3. SWOT Analysis
- 17.2.7.4. Recent Developments
- 17.2.7.5. Financials (Based on Availability)
- 17.2.8 B Braun Melsungen AG
- 17.2.8.1. Overview
- 17.2.8.2. Products
- 17.2.8.3. SWOT Analysis
- 17.2.8.4. Recent Developments
- 17.2.8.5. Financials (Based on Availability)
- 17.2.9 Stryker Corporation
- 17.2.9.1. Overview
- 17.2.9.2. Products
- 17.2.9.3. SWOT Analysis
- 17.2.9.4. Recent Developments
- 17.2.9.5. Financials (Based on Availability)
- 17.2.10 Boston Scientific Corporation
- 17.2.10.1. Overview
- 17.2.10.2. Products
- 17.2.10.3. SWOT Analysis
- 17.2.10.4. Recent Developments
- 17.2.10.5. Financials (Based on Availability)
- 17.2.11 W L Gore & Associates Inc
- 17.2.11.1. Overview
- 17.2.11.2. Products
- 17.2.11.3. SWOT Analysis
- 17.2.11.4. Recent Developments
- 17.2.11.5. Financials (Based on Availability)
- 17.2.12 Penumbra Inc
- 17.2.12.1. Overview
- 17.2.12.2. Products
- 17.2.12.3. SWOT Analysis
- 17.2.12.4. Recent Developments
- 17.2.12.5. Financials (Based on Availability)
- 17.2.1 Terumo Corp
List of Figures
- Figure 1: Global Embolotherapy Industry Revenue Breakdown (Million, %) by Region 2024 & 2032
- Figure 2: Global Embolotherapy Industry Volume Breakdown (K Unit, %) by Region 2024 & 2032
- Figure 3: North America Embolotherapy Industry Revenue (Million), by Country 2024 & 2032
- Figure 4: North America Embolotherapy Industry Volume (K Unit), by Country 2024 & 2032
- Figure 5: North America Embolotherapy Industry Revenue Share (%), by Country 2024 & 2032
- Figure 6: North America Embolotherapy Industry Volume Share (%), by Country 2024 & 2032
- Figure 7: Europe Embolotherapy Industry Revenue (Million), by Country 2024 & 2032
- Figure 8: Europe Embolotherapy Industry Volume (K Unit), by Country 2024 & 2032
- Figure 9: Europe Embolotherapy Industry Revenue Share (%), by Country 2024 & 2032
- Figure 10: Europe Embolotherapy Industry Volume Share (%), by Country 2024 & 2032
- Figure 11: Asia Pacific Embolotherapy Industry Revenue (Million), by Country 2024 & 2032
- Figure 12: Asia Pacific Embolotherapy Industry Volume (K Unit), by Country 2024 & 2032
- Figure 13: Asia Pacific Embolotherapy Industry Revenue Share (%), by Country 2024 & 2032
- Figure 14: Asia Pacific Embolotherapy Industry Volume Share (%), by Country 2024 & 2032
- Figure 15: GCC Embolotherapy Industry Revenue (Million), by Country 2024 & 2032
- Figure 16: GCC Embolotherapy Industry Volume (K Unit), by Country 2024 & 2032
- Figure 17: GCC Embolotherapy Industry Revenue Share (%), by Country 2024 & 2032
- Figure 18: GCC Embolotherapy Industry Volume Share (%), by Country 2024 & 2032
- Figure 19: South America Embolotherapy Industry Revenue (Million), by Country 2024 & 2032
- Figure 20: South America Embolotherapy Industry Volume (K Unit), by Country 2024 & 2032
- Figure 21: South America Embolotherapy Industry Revenue Share (%), by Country 2024 & 2032
- Figure 22: South America Embolotherapy Industry Volume Share (%), by Country 2024 & 2032
- Figure 23: North America Embolotherapy Industry Revenue (Million), by Embolization Technique 2024 & 2032
- Figure 24: North America Embolotherapy Industry Volume (K Unit), by Embolization Technique 2024 & 2032
- Figure 25: North America Embolotherapy Industry Revenue Share (%), by Embolization Technique 2024 & 2032
- Figure 26: North America Embolotherapy Industry Volume Share (%), by Embolization Technique 2024 & 2032
- Figure 27: North America Embolotherapy Industry Revenue (Million), by Application 2024 & 2032
- Figure 28: North America Embolotherapy Industry Volume (K Unit), by Application 2024 & 2032
- Figure 29: North America Embolotherapy Industry Revenue Share (%), by Application 2024 & 2032
- Figure 30: North America Embolotherapy Industry Volume Share (%), by Application 2024 & 2032
- Figure 31: North America Embolotherapy Industry Revenue (Million), by Country 2024 & 2032
- Figure 32: North America Embolotherapy Industry Volume (K Unit), by Country 2024 & 2032
- Figure 33: North America Embolotherapy Industry Revenue Share (%), by Country 2024 & 2032
- Figure 34: North America Embolotherapy Industry Volume Share (%), by Country 2024 & 2032
- Figure 35: Europe Embolotherapy Industry Revenue (Million), by Embolization Technique 2024 & 2032
- Figure 36: Europe Embolotherapy Industry Volume (K Unit), by Embolization Technique 2024 & 2032
- Figure 37: Europe Embolotherapy Industry Revenue Share (%), by Embolization Technique 2024 & 2032
- Figure 38: Europe Embolotherapy Industry Volume Share (%), by Embolization Technique 2024 & 2032
- Figure 39: Europe Embolotherapy Industry Revenue (Million), by Application 2024 & 2032
- Figure 40: Europe Embolotherapy Industry Volume (K Unit), by Application 2024 & 2032
- Figure 41: Europe Embolotherapy Industry Revenue Share (%), by Application 2024 & 2032
- Figure 42: Europe Embolotherapy Industry Volume Share (%), by Application 2024 & 2032
- Figure 43: Europe Embolotherapy Industry Revenue (Million), by Country 2024 & 2032
- Figure 44: Europe Embolotherapy Industry Volume (K Unit), by Country 2024 & 2032
- Figure 45: Europe Embolotherapy Industry Revenue Share (%), by Country 2024 & 2032
- Figure 46: Europe Embolotherapy Industry Volume Share (%), by Country 2024 & 2032
- Figure 47: Asia Pacific Embolotherapy Industry Revenue (Million), by Embolization Technique 2024 & 2032
- Figure 48: Asia Pacific Embolotherapy Industry Volume (K Unit), by Embolization Technique 2024 & 2032
- Figure 49: Asia Pacific Embolotherapy Industry Revenue Share (%), by Embolization Technique 2024 & 2032
- Figure 50: Asia Pacific Embolotherapy Industry Volume Share (%), by Embolization Technique 2024 & 2032
- Figure 51: Asia Pacific Embolotherapy Industry Revenue (Million), by Application 2024 & 2032
- Figure 52: Asia Pacific Embolotherapy Industry Volume (K Unit), by Application 2024 & 2032
- Figure 53: Asia Pacific Embolotherapy Industry Revenue Share (%), by Application 2024 & 2032
- Figure 54: Asia Pacific Embolotherapy Industry Volume Share (%), by Application 2024 & 2032
- Figure 55: Asia Pacific Embolotherapy Industry Revenue (Million), by Country 2024 & 2032
- Figure 56: Asia Pacific Embolotherapy Industry Volume (K Unit), by Country 2024 & 2032
- Figure 57: Asia Pacific Embolotherapy Industry Revenue Share (%), by Country 2024 & 2032
- Figure 58: Asia Pacific Embolotherapy Industry Volume Share (%), by Country 2024 & 2032
- Figure 59: Middle East Embolotherapy Industry Revenue (Million), by Embolization Technique 2024 & 2032
- Figure 60: Middle East Embolotherapy Industry Volume (K Unit), by Embolization Technique 2024 & 2032
- Figure 61: Middle East Embolotherapy Industry Revenue Share (%), by Embolization Technique 2024 & 2032
- Figure 62: Middle East Embolotherapy Industry Volume Share (%), by Embolization Technique 2024 & 2032
- Figure 63: Middle East Embolotherapy Industry Revenue (Million), by Application 2024 & 2032
- Figure 64: Middle East Embolotherapy Industry Volume (K Unit), by Application 2024 & 2032
- Figure 65: Middle East Embolotherapy Industry Revenue Share (%), by Application 2024 & 2032
- Figure 66: Middle East Embolotherapy Industry Volume Share (%), by Application 2024 & 2032
- Figure 67: Middle East Embolotherapy Industry Revenue (Million), by Country 2024 & 2032
- Figure 68: Middle East Embolotherapy Industry Volume (K Unit), by Country 2024 & 2032
- Figure 69: Middle East Embolotherapy Industry Revenue Share (%), by Country 2024 & 2032
- Figure 70: Middle East Embolotherapy Industry Volume Share (%), by Country 2024 & 2032
- Figure 71: GCC Embolotherapy Industry Revenue (Million), by Embolization Technique 2024 & 2032
- Figure 72: GCC Embolotherapy Industry Volume (K Unit), by Embolization Technique 2024 & 2032
- Figure 73: GCC Embolotherapy Industry Revenue Share (%), by Embolization Technique 2024 & 2032
- Figure 74: GCC Embolotherapy Industry Volume Share (%), by Embolization Technique 2024 & 2032
- Figure 75: GCC Embolotherapy Industry Revenue (Million), by Application 2024 & 2032
- Figure 76: GCC Embolotherapy Industry Volume (K Unit), by Application 2024 & 2032
- Figure 77: GCC Embolotherapy Industry Revenue Share (%), by Application 2024 & 2032
- Figure 78: GCC Embolotherapy Industry Volume Share (%), by Application 2024 & 2032
- Figure 79: GCC Embolotherapy Industry Revenue (Million), by Country 2024 & 2032
- Figure 80: GCC Embolotherapy Industry Volume (K Unit), by Country 2024 & 2032
- Figure 81: GCC Embolotherapy Industry Revenue Share (%), by Country 2024 & 2032
- Figure 82: GCC Embolotherapy Industry Volume Share (%), by Country 2024 & 2032
- Figure 83: South America Embolotherapy Industry Revenue (Million), by Embolization Technique 2024 & 2032
- Figure 84: South America Embolotherapy Industry Volume (K Unit), by Embolization Technique 2024 & 2032
- Figure 85: South America Embolotherapy Industry Revenue Share (%), by Embolization Technique 2024 & 2032
- Figure 86: South America Embolotherapy Industry Volume Share (%), by Embolization Technique 2024 & 2032
- Figure 87: South America Embolotherapy Industry Revenue (Million), by Application 2024 & 2032
- Figure 88: South America Embolotherapy Industry Volume (K Unit), by Application 2024 & 2032
- Figure 89: South America Embolotherapy Industry Revenue Share (%), by Application 2024 & 2032
- Figure 90: South America Embolotherapy Industry Volume Share (%), by Application 2024 & 2032
- Figure 91: South America Embolotherapy Industry Revenue (Million), by Country 2024 & 2032
- Figure 92: South America Embolotherapy Industry Volume (K Unit), by Country 2024 & 2032
- Figure 93: South America Embolotherapy Industry Revenue Share (%), by Country 2024 & 2032
- Figure 94: South America Embolotherapy Industry Volume Share (%), by Country 2024 & 2032
List of Tables
- Table 1: Global Embolotherapy Industry Revenue Million Forecast, by Region 2019 & 2032
- Table 2: Global Embolotherapy Industry Volume K Unit Forecast, by Region 2019 & 2032
- Table 3: Global Embolotherapy Industry Revenue Million Forecast, by Embolization Technique 2019 & 2032
- Table 4: Global Embolotherapy Industry Volume K Unit Forecast, by Embolization Technique 2019 & 2032
- Table 5: Global Embolotherapy Industry Revenue Million Forecast, by Application 2019 & 2032
- Table 6: Global Embolotherapy Industry Volume K Unit Forecast, by Application 2019 & 2032
- Table 7: Global Embolotherapy Industry Revenue Million Forecast, by Region 2019 & 2032
- Table 8: Global Embolotherapy Industry Volume K Unit Forecast, by Region 2019 & 2032
- Table 9: Global Embolotherapy Industry Revenue Million Forecast, by Country 2019 & 2032
- Table 10: Global Embolotherapy Industry Volume K Unit Forecast, by Country 2019 & 2032
- Table 11: Global Embolotherapy Industry Revenue Million Forecast, by Country 2019 & 2032
- Table 12: Global Embolotherapy Industry Volume K Unit Forecast, by Country 2019 & 2032
- Table 13: Global Embolotherapy Industry Revenue Million Forecast, by Country 2019 & 2032
- Table 14: Global Embolotherapy Industry Volume K Unit Forecast, by Country 2019 & 2032
- Table 15: Global Embolotherapy Industry Revenue Million Forecast, by Country 2019 & 2032
- Table 16: Global Embolotherapy Industry Volume K Unit Forecast, by Country 2019 & 2032
- Table 17: Global Embolotherapy Industry Revenue Million Forecast, by Country 2019 & 2032
- Table 18: Global Embolotherapy Industry Volume K Unit Forecast, by Country 2019 & 2032
- Table 19: Global Embolotherapy Industry Revenue Million Forecast, by Embolization Technique 2019 & 2032
- Table 20: Global Embolotherapy Industry Volume K Unit Forecast, by Embolization Technique 2019 & 2032
- Table 21: Global Embolotherapy Industry Revenue Million Forecast, by Application 2019 & 2032
- Table 22: Global Embolotherapy Industry Volume K Unit Forecast, by Application 2019 & 2032
- Table 23: Global Embolotherapy Industry Revenue Million Forecast, by Country 2019 & 2032
- Table 24: Global Embolotherapy Industry Volume K Unit Forecast, by Country 2019 & 2032
- Table 25: United States Embolotherapy Industry Revenue (Million) Forecast, by Application 2019 & 2032
- Table 26: United States Embolotherapy Industry Volume (K Unit) Forecast, by Application 2019 & 2032
- Table 27: Canada Embolotherapy Industry Revenue (Million) Forecast, by Application 2019 & 2032
- Table 28: Canada Embolotherapy Industry Volume (K Unit) Forecast, by Application 2019 & 2032
- Table 29: Mexico Embolotherapy Industry Revenue (Million) Forecast, by Application 2019 & 2032
- Table 30: Mexico Embolotherapy Industry Volume (K Unit) Forecast, by Application 2019 & 2032
- Table 31: Global Embolotherapy Industry Revenue Million Forecast, by Embolization Technique 2019 & 2032
- Table 32: Global Embolotherapy Industry Volume K Unit Forecast, by Embolization Technique 2019 & 2032
- Table 33: Global Embolotherapy Industry Revenue Million Forecast, by Application 2019 & 2032
- Table 34: Global Embolotherapy Industry Volume K Unit Forecast, by Application 2019 & 2032
- Table 35: Global Embolotherapy Industry Revenue Million Forecast, by Country 2019 & 2032
- Table 36: Global Embolotherapy Industry Volume K Unit Forecast, by Country 2019 & 2032
- Table 37: Germany Embolotherapy Industry Revenue (Million) Forecast, by Application 2019 & 2032
- Table 38: Germany Embolotherapy Industry Volume (K Unit) Forecast, by Application 2019 & 2032
- Table 39: United Kingdom Embolotherapy Industry Revenue (Million) Forecast, by Application 2019 & 2032
- Table 40: United Kingdom Embolotherapy Industry Volume (K Unit) Forecast, by Application 2019 & 2032
- Table 41: France Embolotherapy Industry Revenue (Million) Forecast, by Application 2019 & 2032
- Table 42: France Embolotherapy Industry Volume (K Unit) Forecast, by Application 2019 & 2032
- Table 43: Italy Embolotherapy Industry Revenue (Million) Forecast, by Application 2019 & 2032
- Table 44: Italy Embolotherapy Industry Volume (K Unit) Forecast, by Application 2019 & 2032
- Table 45: Spain Embolotherapy Industry Revenue (Million) Forecast, by Application 2019 & 2032
- Table 46: Spain Embolotherapy Industry Volume (K Unit) Forecast, by Application 2019 & 2032
- Table 47: Rest of Europe Embolotherapy Industry Revenue (Million) Forecast, by Application 2019 & 2032
- Table 48: Rest of Europe Embolotherapy Industry Volume (K Unit) Forecast, by Application 2019 & 2032
- Table 49: Global Embolotherapy Industry Revenue Million Forecast, by Embolization Technique 2019 & 2032
- Table 50: Global Embolotherapy Industry Volume K Unit Forecast, by Embolization Technique 2019 & 2032
- Table 51: Global Embolotherapy Industry Revenue Million Forecast, by Application 2019 & 2032
- Table 52: Global Embolotherapy Industry Volume K Unit Forecast, by Application 2019 & 2032
- Table 53: Global Embolotherapy Industry Revenue Million Forecast, by Country 2019 & 2032
- Table 54: Global Embolotherapy Industry Volume K Unit Forecast, by Country 2019 & 2032
- Table 55: China Embolotherapy Industry Revenue (Million) Forecast, by Application 2019 & 2032
- Table 56: China Embolotherapy Industry Volume (K Unit) Forecast, by Application 2019 & 2032
- Table 57: Japan Embolotherapy Industry Revenue (Million) Forecast, by Application 2019 & 2032
- Table 58: Japan Embolotherapy Industry Volume (K Unit) Forecast, by Application 2019 & 2032
- Table 59: India Embolotherapy Industry Revenue (Million) Forecast, by Application 2019 & 2032
- Table 60: India Embolotherapy Industry Volume (K Unit) Forecast, by Application 2019 & 2032
- Table 61: Australia Embolotherapy Industry Revenue (Million) Forecast, by Application 2019 & 2032
- Table 62: Australia Embolotherapy Industry Volume (K Unit) Forecast, by Application 2019 & 2032
- Table 63: South Korea Embolotherapy Industry Revenue (Million) Forecast, by Application 2019 & 2032
- Table 64: South Korea Embolotherapy Industry Volume (K Unit) Forecast, by Application 2019 & 2032
- Table 65: Rest of Asia Pacific Embolotherapy Industry Revenue (Million) Forecast, by Application 2019 & 2032
- Table 66: Rest of Asia Pacific Embolotherapy Industry Volume (K Unit) Forecast, by Application 2019 & 2032
- Table 67: Global Embolotherapy Industry Revenue Million Forecast, by Embolization Technique 2019 & 2032
- Table 68: Global Embolotherapy Industry Volume K Unit Forecast, by Embolization Technique 2019 & 2032
- Table 69: Global Embolotherapy Industry Revenue Million Forecast, by Application 2019 & 2032
- Table 70: Global Embolotherapy Industry Volume K Unit Forecast, by Application 2019 & 2032
- Table 71: Global Embolotherapy Industry Revenue Million Forecast, by Country 2019 & 2032
- Table 72: Global Embolotherapy Industry Volume K Unit Forecast, by Country 2019 & 2032
- Table 73: Global Embolotherapy Industry Revenue Million Forecast, by Embolization Technique 2019 & 2032
- Table 74: Global Embolotherapy Industry Volume K Unit Forecast, by Embolization Technique 2019 & 2032
- Table 75: Global Embolotherapy Industry Revenue Million Forecast, by Application 2019 & 2032
- Table 76: Global Embolotherapy Industry Volume K Unit Forecast, by Application 2019 & 2032
- Table 77: Global Embolotherapy Industry Revenue Million Forecast, by Country 2019 & 2032
- Table 78: Global Embolotherapy Industry Volume K Unit Forecast, by Country 2019 & 2032
- Table 79: South Africa Embolotherapy Industry Revenue (Million) Forecast, by Application 2019 & 2032
- Table 80: South Africa Embolotherapy Industry Volume (K Unit) Forecast, by Application 2019 & 2032
- Table 81: Rest of Middle East Embolotherapy Industry Revenue (Million) Forecast, by Application 2019 & 2032
- Table 82: Rest of Middle East Embolotherapy Industry Volume (K Unit) Forecast, by Application 2019 & 2032
- Table 83: Global Embolotherapy Industry Revenue Million Forecast, by Embolization Technique 2019 & 2032
- Table 84: Global Embolotherapy Industry Volume K Unit Forecast, by Embolization Technique 2019 & 2032
- Table 85: Global Embolotherapy Industry Revenue Million Forecast, by Application 2019 & 2032
- Table 86: Global Embolotherapy Industry Volume K Unit Forecast, by Application 2019 & 2032
- Table 87: Global Embolotherapy Industry Revenue Million Forecast, by Country 2019 & 2032
- Table 88: Global Embolotherapy Industry Volume K Unit Forecast, by Country 2019 & 2032
- Table 89: Brazil Embolotherapy Industry Revenue (Million) Forecast, by Application 2019 & 2032
- Table 90: Brazil Embolotherapy Industry Volume (K Unit) Forecast, by Application 2019 & 2032
- Table 91: Argentina Embolotherapy Industry Revenue (Million) Forecast, by Application 2019 & 2032
- Table 92: Argentina Embolotherapy Industry Volume (K Unit) Forecast, by Application 2019 & 2032
- Table 93: Rest of South America Embolotherapy Industry Revenue (Million) Forecast, by Application 2019 & 2032
- Table 94: Rest of South America Embolotherapy Industry Volume (K Unit) Forecast, by Application 2019 & 2032
Frequently Asked Questions
1. What is the projected Compound Annual Growth Rate (CAGR) of the Embolotherapy Industry?
The projected CAGR is approximately 7.26%.
2. Which companies are prominent players in the Embolotherapy Industry?
Key companies in the market include Terumo Corp, Cook Medical, Merit Medical Systems Inc, Shape Memory Medical Inc, Abbott Laboratories, Medtronic PLC, Johnson and Johnson (CERENOVUS), B Braun Melsungen AG, Stryker Corporation, Boston Scientific Corporation, W L Gore & Associates Inc , Penumbra Inc.
3. What are the main segments of the Embolotherapy Industry?
The market segments include Embolization Technique, Application.
4. Can you provide details about the market size?
The market size is estimated to be USD 1.94 Million as of 2022.
5. What are some drivers contributing to market growth?
Increasing Prevalence of Vascular Diseases; Technological Advancements in Embolization Products and Procedures; Increasing Research and Development Activities.
6. What are the notable trends driving market growth?
The Non-coiling Devices Segment is Expected to Hold a Major Market Share in the Vascular Embolization Market over the Forecast Period.
7. Are there any restraints impacting market growth?
High Costs Associated with Embolization Procedures; Stringent Regulatory Norms; Complications Associated with Embolization Procedures.
8. Can you provide examples of recent developments in the market?
In July 2021, Terumo Medical Corporation (TMC) has the introduction of its AZUR Vascular Plug, the first and only plug compatible with a microcatheter to occlude arteries up to 8mm in diameter. The newest addition to Terumo's robust embolization portfolio is indicated for use to reduce or block the rate of blood flow in arteries of the peripheral vasculature.
9. What pricing options are available for accessing the report?
Pricing options include single-user, multi-user, and enterprise licenses priced at USD 4750, USD 5250, and USD 8750 respectively.
10. Is the market size provided in terms of value or volume?
The market size is provided in terms of value, measured in Million and volume, measured in K Unit.
11. Are there any specific market keywords associated with the report?
Yes, the market keyword associated with the report is "Embolotherapy Industry," which aids in identifying and referencing the specific market segment covered.
12. How do I determine which pricing option suits my needs best?
The pricing options vary based on user requirements and access needs. Individual users may opt for single-user licenses, while businesses requiring broader access may choose multi-user or enterprise licenses for cost-effective access to the report.
13. Are there any additional resources or data provided in the Embolotherapy Industry report?
While the report offers comprehensive insights, it's advisable to review the specific contents or supplementary materials provided to ascertain if additional resources or data are available.
14. How can I stay updated on further developments or reports in the Embolotherapy Industry?
To stay informed about further developments, trends, and reports in the Embolotherapy Industry, consider subscribing to industry newsletters, following relevant companies and organizations, or regularly checking reputable industry news sources and publications.
Methodology
Step 1 - Identification of Relevant Samples Size from Population Database


Step 2 - Approaches for Defining Global Market Size (Value, Volume* & Price*)

Note*: In applicable scenarios
Step 3 - Data Sources
Primary Research
- Web Analytics
- Survey Reports
- Research Institute
- Latest Research Reports
- Opinion Leaders
Secondary Research
- Annual Reports
- White Paper
- Latest Press Release
- Industry Association
- Paid Database
- Investor Presentations

Step 4 - Data Triangulation
Involves using different sources of information in order to increase the validity of a study
These sources are likely to be stakeholders in a program - participants, other researchers, program staff, other community members, and so on.
Then we put all data in single framework & apply various statistical tools to find out the dynamic on the market.
During the analysis stage, feedback from the stakeholder groups would be compared to determine areas of agreement as well as areas of divergence
