

Key Insights
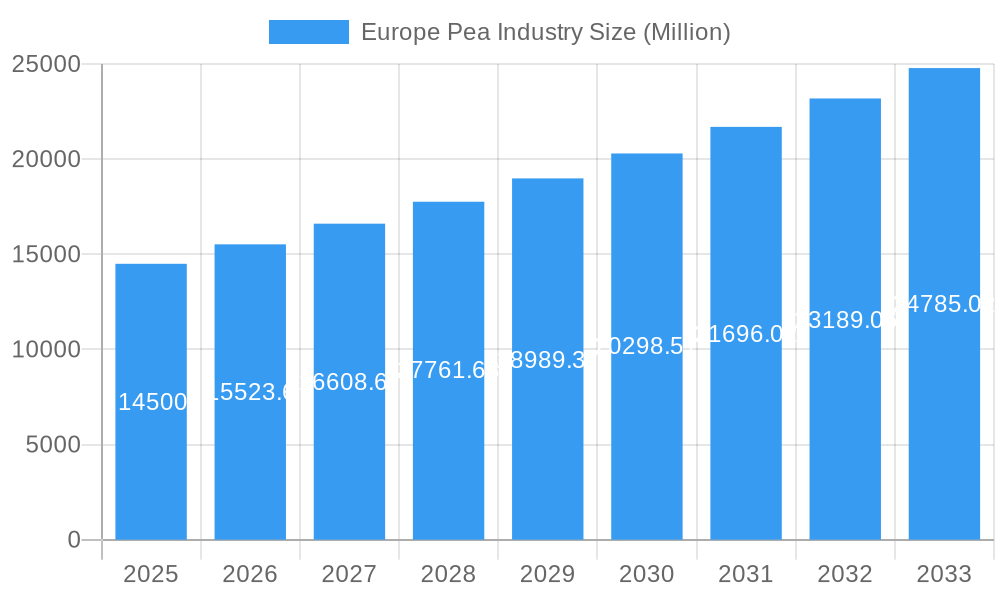
The European pea industry, valued at €14.50 billion in 2025, is projected to experience robust growth, driven by increasing consumer demand for plant-based protein sources and the rising popularity of pea-based food products. This growth is further fueled by the expanding food processing industry and the increasing adoption of sustainable and ethical sourcing practices within the agricultural sector. Key European countries like Germany, France, and the UK are significant contributors to the market, with substantial production and consumption. The industry's growth is also influenced by government initiatives promoting sustainable agriculture and the development of innovative pea-based products catering to specific dietary needs and preferences. While challenges exist, including fluctuating crop yields due to climate change and competition from other protein sources, the overall outlook for the European pea industry remains positive. The forecast period of 2025-2033 indicates a continued expansion, with a projected Compound Annual Growth Rate (CAGR) of 6.88%, suggesting a significant market opportunity for players across the value chain, from cultivation and processing to retail and distribution. Competition among key players like Sensus, Tereos, Lantmännen, AGRANA, and Roquette is expected to intensify as they strive to meet the growing market demand and innovate to maintain their market share. Price trends will likely be influenced by supply and demand dynamics, as well as global economic conditions. Specific country analyses, such as those provided for Russia, Ukraine, France, Spain, and the Netherlands, offer granular insights for more precise market targeting and strategic decision-making.
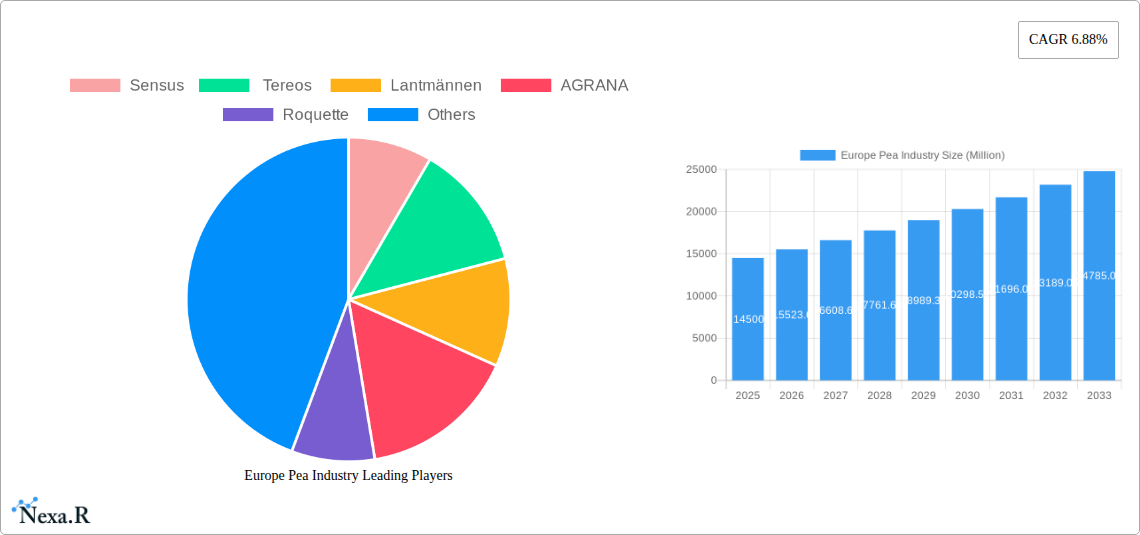
Europe Pea Industry Market Size (In Billion)
The segmentation of the European pea market by country allows for a nuanced understanding of regional variations in production, pricing, and consumption patterns. This detail is crucial for effective market penetration strategies. The historical data (2019-2024) provides a valuable baseline for forecasting future trends accurately. Further research into specific drivers (e.g., government subsidies, technological advancements in processing), trends (e.g., functional food trends, the rise of veganism), and restraints (e.g., land availability, pest control challenges) would enable even more precise projections and strategic planning for industry stakeholders. Focusing on sustainability and traceability will be critical for maintaining consumer trust and driving further growth in this dynamic market.
Europe Pea Industry Company Market Share
This comprehensive report provides a detailed analysis of the European pea industry, encompassing market dynamics, growth trends, regional performance, key players, and future outlook. The study period covers 2019-2033, with a base year of 2025 and a forecast period of 2025-2033. This in-depth analysis is essential for industry professionals, investors, and stakeholders seeking to understand and capitalize on opportunities within this dynamic market. The report features detailed breakdowns of production and price trends across key European nations, including Russia, Ukraine, France, Spain, and the Netherlands.
Europe Pea Industry Market Dynamics & Structure
The European pea industry is characterized by a moderately concentrated market structure, with leading entities such as Sensus, Tereos, Lantmännen, AGRANA, and Roquette collectively commanding a significant market share (estimated at xx%). A primary engine for market expansion is technological innovation, particularly in advanced protein extraction techniques and sophisticated processing methods. The industry operates within an evolving regulatory landscape, where stringent food safety standards and growing sustainability mandates continuously shape production methodologies and international trade dynamics. Competitive pressures arise from a diverse array of alternative protein sources, including other pulses like lentils and beans, as well as soy-based products and a burgeoning market for meat alternatives, all of which exert influence on market share. Simultaneously, a pronounced shift in end-user demographics towards health-conscious consumers is demonstrably fueling increased demand for innovative and versatile pea-based products across various food and beverage categories. Mergers and acquisitions (M&A) activity within the sector, while moderate in volume (approximately xx deals in the last five years), are strategically focused on expanding comprehensive product portfolios and broadening geographic reach, indicating a consolidation trend aimed at enhancing market competitiveness.
- Market Concentration: A moderately concentrated landscape, with the top 5 players collectively holding an estimated xx% of the market share.
- Technological Innovation: The industry's focus is sharply directed towards refining extraction techniques for higher protein yields and developing a wider array of value-added products that cater to diverse consumer needs.
- Regulatory Landscape: Operations are increasingly influenced by robust and continually evolving food safety regulations and ambitious sustainability standards, impacting both production and market access.
- Competitive Substitutes: The market faces competition from a range of alternatives, including other nutrient-rich pulses (lentils, fava beans), soy-based proteins, and a rapidly growing segment of plant-based meat alternatives.
- End-User Demographics: A significant growth driver is the expanding base of health-conscious consumers, alongside a notable increase in demand from vegan and vegetarian consumer segments.
- M&A Activity: The sector experiences moderate M&A activity, with strategic acquisitions primarily aimed at portfolio diversification, geographical expansion, and market consolidation to achieve greater economies of scale.
Europe Pea Industry Growth Trends & Insights
The European pea industry has demonstrated consistent and robust growth throughout the historical period of 2019-2024, achieving a Compound Annual Growth Rate (CAGR) of approximately xx%. This sustained expansion is largely attributable to the escalating consumer appetite for plant-based protein sources, a heightened awareness of the comprehensive nutritional advantages offered by peas, and the continuous development of innovative and appealing pea-based food products. Furthermore, significant advancements in processing and extraction technologies have been instrumental in enhancing both operational efficiency and the overall quality of pea-derived ingredients. A notable shift in consumer behavior, characterized by a growing preference for sustainably and ethically sourced products, is creating significant opportunities for companies that champion environmentally responsible farming practices and transparent supply chains. Looking ahead, the forecast period (2025-2033) is projected to witness continued strong growth, with an anticipated CAGR of xx%. This upward trajectory is expected to be propelled by increased market penetration across a wider spectrum of food and beverage segments, alongside a growing adoption of pea protein in diverse non-food applications, such as animal feed and industrial uses. The market size is currently estimated at xx million units in 2025, with projections indicating a significant expansion to xx million units by 2033.
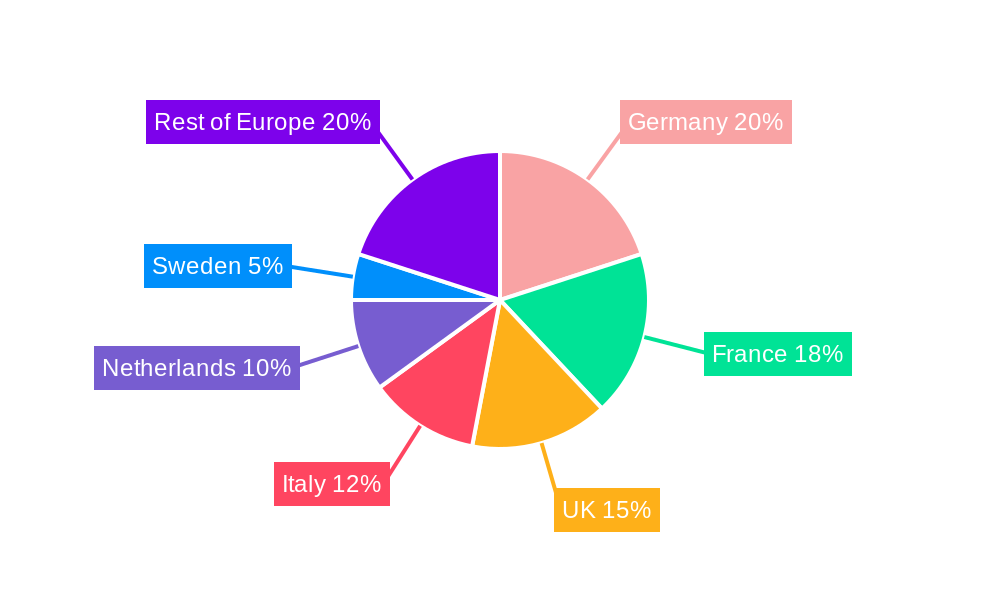
Dominant Regions, Countries, or Segments in Europe Pea Industry
France currently holds a dominant position in the European pea market, largely due to its well-established agricultural infrastructure and substantial pea production capacity, accounting for an estimated xx% of the market share in 2025. Other key contributors to the European pea market include the Netherlands, recognized for its advanced agricultural technologies and efficient processing capabilities, and Eastern European nations. Notably, Ukraine has historically been a significant producer, though its output has been substantially impacted by the ongoing geopolitical conflict. Russia's pea production, despite facing its own set of challenges due to geopolitical factors, remains a considerable force within the global supply chain. Spain also plays a significant role, contributing to the European pea market through its growing production and export capabilities. The "Rest of Europe" segment is identified as exhibiting high growth potential, particularly in countries with developing agricultural sectors and a burgeoning consumer interest in plant-based food options, signaling future market expansion opportunities.
- France: Leads with a robust agricultural infrastructure and large-scale pea production capabilities.
- Netherlands: Characterized by a strong agricultural sector and the implementation of efficient processing technologies.
- Ukraine: Historically a significant producer, currently facing substantial disruptions to production due to geopolitical factors.
- Spain: Demonstrates increasing production volumes and expanding export potential.
- Russia: Remains a considerable producer, though navigating challenges stemming from geopolitical complexities.
- Rest of Europe: Presents a segment with high growth potential, driven by developing agricultural sectors and rising consumer interest in plant-based diets.
Europe Pea Industry Product Landscape
The European pea industry offers a diverse range of products, including whole peas, split peas, pea flour, pea protein, and pea starch. Recent innovations focus on enhancing the functionality and nutritional value of pea-based ingredients. Pea protein isolates and concentrates are witnessing high demand driven by their application in meat alternatives, dietary supplements, and sports nutrition products. Technological advancements, such as improved extraction methods and novel processing techniques, are continuously improving the quality and yield of pea-derived ingredients, making them more competitive compared to traditional protein sources.
Key Drivers, Barriers & Challenges in Europe Pea Industry
Key Drivers: Growing demand for plant-based proteins, increasing consumer health consciousness, technological advancements improving efficiency and product quality, government support for sustainable agriculture.
Challenges: Volatility in raw material prices, supply chain disruptions, competition from other protein sources, regulatory hurdles, and sustainability concerns related to pea production and processing. For example, fluctuating yields due to adverse weather conditions can significantly impact profitability (estimated xx% impact on profit margins in the past year).
Emerging Opportunities in Europe Pea Industry
Untapped markets within the food and beverage sector exist in specialty food products, functional foods, and pet food, presenting significant opportunities. Innovation in pea-based ingredients, such as novel textures and flavors, will expand their application across food categories. Growing consumer preference for sustainable and ethical sourcing provides opportunities for businesses to highlight their commitment to environmentally friendly farming practices and transparent supply chains.
Growth Accelerators in the Europe Pea Industry Industry
Technological breakthroughs in processing and extraction will drive higher yields and improved product quality. Strategic partnerships between pea processors and food manufacturers will enhance product development and market penetration. Expansion into new markets, particularly in Asia and the Middle East, will significantly increase market size.
Key Players Shaping the Europe Pea Industry Market
Notable Milestones in Europe Pea Industry Sector
- October 2022: Roquette launched an innovative new line of premium organic pea ingredients, expanding its portfolio of sustainable plant-based solutions.
- September 2022: Lantmännen announced a significant investment of USD 95.7 million to establish a state-of-the-art pea protein production facility, underscoring its commitment to the growing plant-based market.
- May 2022: The signing of a phytosanitary protocol for peas between China and Russia was noted, potentially influencing global trade dynamics and increasing international competition for European producers.
In-Depth Europe Pea Industry Market Outlook
The European pea industry is strategically positioned for substantial growth in the forthcoming years, propelled by a powerful confluence of influential factors. Key among these is the persistently rising consumer demand for plant-based protein alternatives, driven by evolving health consciousness and dietary preferences. Coupled with this is the continuous stream of innovation in processing technologies and the development of novel pea-based products that cater to a wider range of applications and consumer tastes. Furthermore, supportive government policies that champion sustainable agriculture and promote the adoption of plant-based food systems are creating a more favorable operating environment. Strategic partnerships and proactive expansion into emerging markets are expected to further accelerate this growth trajectory, presenting exciting and lucrative opportunities for existing industry players and new entrants alike. The market's long-term potential is significant, offering the prospect of substantial returns for businesses that adeptly navigate the inherent challenges and strategically capitalize on the burgeoning opportunities within the European pea sector.
Europe Pea Industry Segmentation
-
1. Russia
-
1.1. Production Analysis
- 1.1.1. Consumption Analysis and Market Value
- 1.1.2. Import Market Analysis (Volume and Value)
- 1.1.3. Export Market Analysis (Volume and Value)
- 1.1.4. Price Trend Analysis
- 1.2. Ukraine
- 1.3. France
- 1.4. Spain
- 1.5. Netherlands
- 1.6. Rest of Europe
-
1.1. Production Analysis
-
2. Russia
-
2.1. Production Analysis
- 2.1.1. Consumption Analysis and Market Value
- 2.1.2. Import Market Analysis (Volume and Value)
- 2.1.3. Export Market Analysis (Volume and Value)
- 2.1.4. Price Trend Analysis
- 2.2. Ukraine
- 2.3. France
- 2.4. Spain
- 2.5. Netherlands
- 2.6. Rest of Europe
-
2.1. Production Analysis
Europe Pea Industry Segmentation By Geography
-
1. Europe
- 1.1. United Kingdom
- 1.2. Germany
- 1.3. France
- 1.4. Italy
- 1.5. Spain
- 1.6. Netherlands
- 1.7. Belgium
- 1.8. Sweden
- 1.9. Norway
- 1.10. Poland
- 1.11. Denmark
Europe Pea Industry Regional Market Share
Geographic Coverage of Europe Pea Industry
Europe Pea Industry REPORT HIGHLIGHTS
| Aspects | Details |
|---|---|
| Study Period | 2020-2034 |
| Base Year | 2025 |
| Estimated Year | 2026 |
| Forecast Period | 2026-2034 |
| Historical Period | 2020-2025 |
| Growth Rate | CAGR of 6.88% from 2020-2034 |
| Segmentation |
|
Table of Contents
- 1. Introduction
- 1.1. Research Scope
- 1.2. Market Segmentation
- 1.3. Research Methodology
- 1.4. Definitions and Assumptions
- 2. Executive Summary
- 2.1. Introduction
- 3. Market Dynamics
- 3.1. Introduction
- 3.2. Market Drivers
- 3.2.1. Rising Consumption of Cashew Nuts in the Country; Favorable Government Initiatives
- 3.3. Market Restrains
- 3.3.1. Hazardous Climatic Condition Hinders Cashew Production; Stringent Regulations Related to Food Quality Standards
- 3.4. Market Trends
- 3.4.1. Growing Export Opportunity
- 4. Market Factor Analysis
- 4.1. Porters Five Forces
- 4.2. Supply/Value Chain
- 4.3. PESTEL analysis
- 4.4. Market Entropy
- 4.5. Patent/Trademark Analysis
- 5. Europe Pea Industry Analysis, Insights and Forecast, 2020-2032
- 5.1. Market Analysis, Insights and Forecast - by Russia
- 5.1.1. Production Analysis
- 5.1.1.1. Consumption Analysis and Market Value
- 5.1.1.2. Import Market Analysis (Volume and Value)
- 5.1.1.3. Export Market Analysis (Volume and Value)
- 5.1.1.4. Price Trend Analysis
- 5.1.2. Ukraine
- 5.1.3. France
- 5.1.4. Spain
- 5.1.5. Netherlands
- 5.1.6. Rest of Europe
- 5.1.1. Production Analysis
- 5.2. Market Analysis, Insights and Forecast - by Russia
- 5.2.1. Production Analysis
- 5.2.1.1. Consumption Analysis and Market Value
- 5.2.1.2. Import Market Analysis (Volume and Value)
- 5.2.1.3. Export Market Analysis (Volume and Value)
- 5.2.1.4. Price Trend Analysis
- 5.2.2. Ukraine
- 5.2.3. France
- 5.2.4. Spain
- 5.2.5. Netherlands
- 5.2.6. Rest of Europe
- 5.2.1. Production Analysis
- 5.3. Market Analysis, Insights and Forecast - by Region
- 5.3.1. Europe
- 5.1. Market Analysis, Insights and Forecast - by Russia
- 6. Competitive Analysis
- 6.1. Market Share Analysis 2025
- 6.2. Company Profiles
- 6.2.1 Sensus
- 6.2.1.1. Overview
- 6.2.1.2. Products
- 6.2.1.3. SWOT Analysis
- 6.2.1.4. Recent Developments
- 6.2.1.5. Financials (Based on Availability)
- 6.2.2 Tereos
- 6.2.2.1. Overview
- 6.2.2.2. Products
- 6.2.2.3. SWOT Analysis
- 6.2.2.4. Recent Developments
- 6.2.2.5. Financials (Based on Availability)
- 6.2.3 Lantmännen
- 6.2.3.1. Overview
- 6.2.3.2. Products
- 6.2.3.3. SWOT Analysis
- 6.2.3.4. Recent Developments
- 6.2.3.5. Financials (Based on Availability)
- 6.2.4 AGRANA
- 6.2.4.1. Overview
- 6.2.4.2. Products
- 6.2.4.3. SWOT Analysis
- 6.2.4.4. Recent Developments
- 6.2.4.5. Financials (Based on Availability)
- 6.2.5 Roquette
- 6.2.5.1. Overview
- 6.2.5.2. Products
- 6.2.5.3. SWOT Analysis
- 6.2.5.4. Recent Developments
- 6.2.5.5. Financials (Based on Availability)
- 6.2.1 Sensus
List of Figures
- Figure 1: Europe Pea Industry Revenue Breakdown (Million, %) by Product 2025 & 2033
- Figure 2: Europe Pea Industry Share (%) by Company 2025
List of Tables
- Table 1: Europe Pea Industry Revenue Million Forecast, by Russia 2020 & 2033
- Table 2: Europe Pea Industry Volume million units Forecast, by Russia 2020 & 2033
- Table 3: Europe Pea Industry Revenue Million Forecast, by Russia 2020 & 2033
- Table 4: Europe Pea Industry Volume million units Forecast, by Russia 2020 & 2033
- Table 5: Europe Pea Industry Revenue Million Forecast, by Region 2020 & 2033
- Table 6: Europe Pea Industry Volume million units Forecast, by Region 2020 & 2033
- Table 7: Europe Pea Industry Revenue Million Forecast, by Russia 2020 & 2033
- Table 8: Europe Pea Industry Volume million units Forecast, by Russia 2020 & 2033
- Table 9: Europe Pea Industry Revenue Million Forecast, by Russia 2020 & 2033
- Table 10: Europe Pea Industry Volume million units Forecast, by Russia 2020 & 2033
- Table 11: Europe Pea Industry Revenue Million Forecast, by Country 2020 & 2033
- Table 12: Europe Pea Industry Volume million units Forecast, by Country 2020 & 2033
- Table 13: United Kingdom Europe Pea Industry Revenue (Million) Forecast, by Application 2020 & 2033
- Table 14: United Kingdom Europe Pea Industry Volume (million units) Forecast, by Application 2020 & 2033
- Table 15: Germany Europe Pea Industry Revenue (Million) Forecast, by Application 2020 & 2033
- Table 16: Germany Europe Pea Industry Volume (million units) Forecast, by Application 2020 & 2033
- Table 17: France Europe Pea Industry Revenue (Million) Forecast, by Application 2020 & 2033
- Table 18: France Europe Pea Industry Volume (million units) Forecast, by Application 2020 & 2033
- Table 19: Italy Europe Pea Industry Revenue (Million) Forecast, by Application 2020 & 2033
- Table 20: Italy Europe Pea Industry Volume (million units) Forecast, by Application 2020 & 2033
- Table 21: Spain Europe Pea Industry Revenue (Million) Forecast, by Application 2020 & 2033
- Table 22: Spain Europe Pea Industry Volume (million units) Forecast, by Application 2020 & 2033
- Table 23: Netherlands Europe Pea Industry Revenue (Million) Forecast, by Application 2020 & 2033
- Table 24: Netherlands Europe Pea Industry Volume (million units) Forecast, by Application 2020 & 2033
- Table 25: Belgium Europe Pea Industry Revenue (Million) Forecast, by Application 2020 & 2033
- Table 26: Belgium Europe Pea Industry Volume (million units) Forecast, by Application 2020 & 2033
- Table 27: Sweden Europe Pea Industry Revenue (Million) Forecast, by Application 2020 & 2033
- Table 28: Sweden Europe Pea Industry Volume (million units) Forecast, by Application 2020 & 2033
- Table 29: Norway Europe Pea Industry Revenue (Million) Forecast, by Application 2020 & 2033
- Table 30: Norway Europe Pea Industry Volume (million units) Forecast, by Application 2020 & 2033
- Table 31: Poland Europe Pea Industry Revenue (Million) Forecast, by Application 2020 & 2033
- Table 32: Poland Europe Pea Industry Volume (million units) Forecast, by Application 2020 & 2033
- Table 33: Denmark Europe Pea Industry Revenue (Million) Forecast, by Application 2020 & 2033
- Table 34: Denmark Europe Pea Industry Volume (million units) Forecast, by Application 2020 & 2033
Frequently Asked Questions
1. What is the projected Compound Annual Growth Rate (CAGR) of the Europe Pea Industry?
The projected CAGR is approximately 6.88%.
2. Which companies are prominent players in the Europe Pea Industry?
Key companies in the market include Sensus, Tereos , Lantmännen , AGRANA, Roquette .
3. What are the main segments of the Europe Pea Industry?
The market segments include Russia, Russia.
4. Can you provide details about the market size?
The market size is estimated to be USD 14.50 Million as of 2022.
5. What are some drivers contributing to market growth?
Rising Consumption of Cashew Nuts in the Country; Favorable Government Initiatives.
6. What are the notable trends driving market growth?
Growing Export Opportunity.
7. Are there any restraints impacting market growth?
Hazardous Climatic Condition Hinders Cashew Production; Stringent Regulations Related to Food Quality Standards.
8. Can you provide examples of recent developments in the market?
October 2022: Roquette, a global leader in plant-based ingredients and a pioneer of plant proteins, launched a new line of organic pea ingredients: organic pea starch and organic pea protein to the Europe market.
9. What pricing options are available for accessing the report?
Pricing options include single-user, multi-user, and enterprise licenses priced at USD 4750, USD 4950, and USD 6800 respectively.
10. Is the market size provided in terms of value or volume?
The market size is provided in terms of value, measured in Million and volume, measured in million units.
11. Are there any specific market keywords associated with the report?
Yes, the market keyword associated with the report is "Europe Pea Industry," which aids in identifying and referencing the specific market segment covered.
12. How do I determine which pricing option suits my needs best?
The pricing options vary based on user requirements and access needs. Individual users may opt for single-user licenses, while businesses requiring broader access may choose multi-user or enterprise licenses for cost-effective access to the report.
13. Are there any additional resources or data provided in the Europe Pea Industry report?
While the report offers comprehensive insights, it's advisable to review the specific contents or supplementary materials provided to ascertain if additional resources or data are available.
14. How can I stay updated on further developments or reports in the Europe Pea Industry?
To stay informed about further developments, trends, and reports in the Europe Pea Industry, consider subscribing to industry newsletters, following relevant companies and organizations, or regularly checking reputable industry news sources and publications.
Methodology
Step 1 - Identification of Relevant Samples Size from Population Database


Step 2 - Approaches for Defining Global Market Size (Value, Volume* & Price*)

Note*: In applicable scenarios
Step 3 - Data Sources
Primary Research
- Web Analytics
- Survey Reports
- Research Institute
- Latest Research Reports
- Opinion Leaders
Secondary Research
- Annual Reports
- White Paper
- Latest Press Release
- Industry Association
- Paid Database
- Investor Presentations

Step 4 - Data Triangulation
Involves using different sources of information in order to increase the validity of a study
These sources are likely to be stakeholders in a program - participants, other researchers, program staff, other community members, and so on.
Then we put all data in single framework & apply various statistical tools to find out the dynamic on the market.
During the analysis stage, feedback from the stakeholder groups would be compared to determine areas of agreement as well as areas of divergence