

Key Insights
The global Electric Vehicle (EV) taxi market is experiencing robust growth, driven by increasing environmental concerns, stringent emission regulations, and the decreasing cost of EV batteries. The market's Compound Annual Growth Rate (CAGR) exceeding 12% from 2019 to 2024 indicates significant expansion. This growth is fueled by a shift towards sustainable transportation solutions, particularly in densely populated urban areas where EVs offer operational cost advantages through reduced fuel expenses. The segment encompassing four-wheeler taxis is anticipated to dominate the market, owing to higher passenger capacity and longer operational ranges compared to two-wheeler taxis. Hybrid Electric Vehicles (HEVs) currently hold a larger market share than Battery Electric Vehicles (BEVs), however, BEVs are projected to experience faster growth due to continuous technological advancements and improving charging infrastructure. Key players like Ola Cabs, Uber, and Blu Smart Mobility are actively investing in expanding their EV taxi fleets, further accelerating market penetration. Regional variations exist, with North America and Europe currently holding substantial market shares, driven by early adoption and supportive government policies. However, rapidly developing economies in Asia, particularly India and China, are poised for significant future growth as EV infrastructure improves and consumer demand increases. The market faces challenges including high initial investment costs for EVs, limited charging infrastructure in certain regions, and range anxiety among potential users. Nevertheless, ongoing technological improvements and governmental incentives are actively mitigating these restraints.
The forecast period of 2025-2033 anticipates continued strong growth, propelled by substantial investments in charging infrastructure and the introduction of more affordable and technologically advanced EV models. The market segmentation will likely continue to evolve, with the potential for new business models focusing on shared mobility and ride-hailing services. The competitive landscape remains dynamic, with existing players expanding their services and new entrants emerging. Success in this market will hinge on factors including technological innovation, strategic partnerships, effective fleet management, and the ability to adapt to evolving consumer preferences and regulatory changes. The overall outlook for the EV taxi market remains highly promising, presenting substantial opportunities for investors and industry participants.
The Definitive EV Taxi Industry Report: 2019-2033
This comprehensive report provides an in-depth analysis of the burgeoning Electric Vehicle (EV) Taxi industry, encompassing market dynamics, growth trends, competitive landscape, and future outlook. With a focus on key players like Blu Smart Mobility, Ola Cabs, and Uber, this report serves as an indispensable resource for industry professionals, investors, and strategists seeking to navigate this rapidly evolving sector. The study period covers 2019-2033, with 2025 as the base and estimated year, and a forecast period of 2025-2033. The historical period analyzed is 2019-2024.
EV Taxi Industry Market Dynamics & Structure
The EV taxi market is experiencing a period of rapid transformation driven by technological advancements, stringent environmental regulations, and evolving consumer preferences. Market concentration is currently moderate, with a few dominant players and a growing number of smaller entrants. Technological innovation, particularly in battery technology and autonomous driving systems, is a key driver, while regulatory frameworks, including emission standards and charging infrastructure development, significantly influence market growth. Competitive substitutes include traditional gasoline-powered taxis and ride-sharing services. The end-user demographic is expanding to include environmentally conscious consumers, businesses seeking sustainable transportation solutions, and urban populations facing increasing traffic congestion. M&A activity is expected to increase as larger players seek to consolidate market share and acquire emerging technologies.
- Market Concentration: Moderate, with xx% market share held by the top 5 players in 2025.
- Technological Innovation: Focus on battery range, charging times, and autonomous capabilities.
- Regulatory Landscape: Stringent emission norms and incentives for EV adoption are key drivers.
- M&A Activity: xx deals expected between 2025-2033, primarily focused on technology acquisition and market expansion.
- Innovation Barriers: High initial investment costs, limited charging infrastructure in certain regions.
EV Taxi Industry Growth Trends & Insights
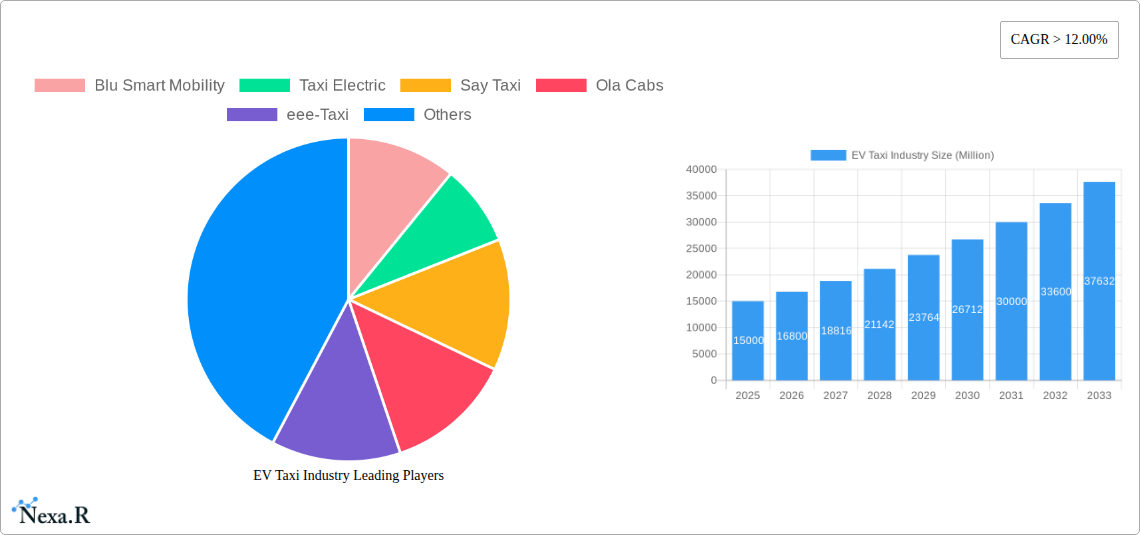
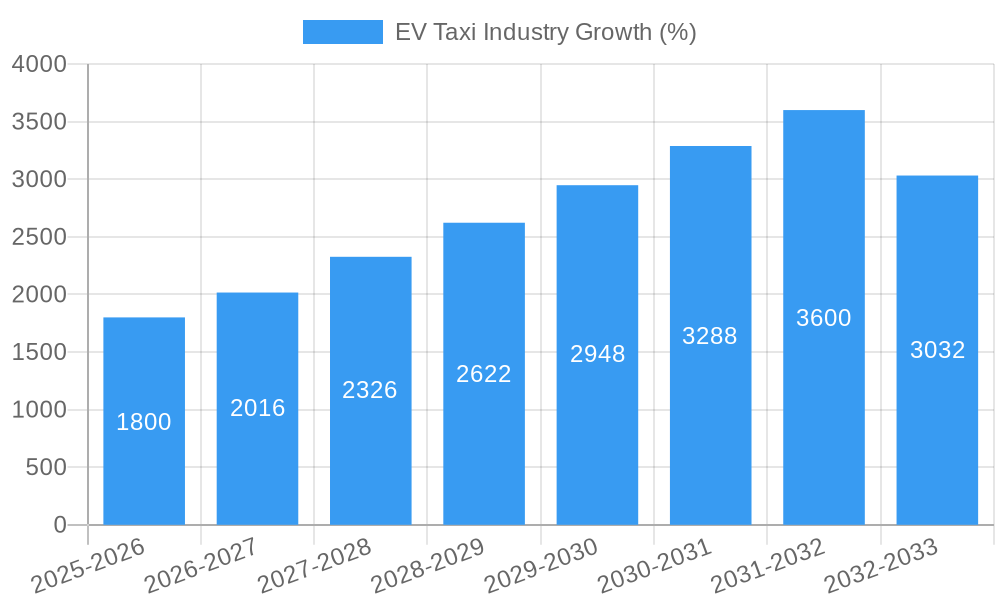
The EV taxi market is experiencing robust growth, fueled by increasing environmental concerns, government support, and advancements in battery technology. The market size is projected to reach xx million units by 2033, exhibiting a CAGR of xx% during the forecast period. Adoption rates are accelerating, driven by decreasing EV prices and improved vehicle performance. Technological disruptions, such as the introduction of autonomous driving capabilities, are poised to further revolutionize the industry. Consumer behavior is shifting towards sustainable transportation options, with increasing demand for eco-friendly ride-hailing services.
- Market Size (Million Units): 2025: xx; 2033: xx
- CAGR (2025-2033): xx%
- Market Penetration: xx% in major urban areas by 2033
- Key Adoption Drivers: Decreasing EV prices, improved battery technology, government incentives.
Dominant Regions, Countries, or Segments in EV Taxi Industry
The dominant regions for EV taxis are concentrated in developed economies with robust infrastructure and supportive government policies. Within these regions, urban areas with high population density and strong environmental regulations are leading the charge. The Battery Electric Vehicle (BEV) segment is currently outpacing Hybrid Electric Vehicle (HEV) adoption due to technological advancements and cost reductions. Four-wheeler taxis dominate the vehicle type segment due to higher passenger capacity and suitability for diverse transportation needs.
- Leading Region: North America (xx% market share in 2025). Key Drivers: strong consumer demand, government support, and well-established charging infrastructure.
- Leading Country: USA (xx% of the North American market share in 2025).
- Leading Segment (Type): Battery Electric Vehicle (BEV) - xx% market share in 2025.
- Leading Segment (Vehicle Type): Four-Wheeler Taxi - xx% market share in 2025.
EV Taxi Industry Product Landscape
The EV taxi product landscape is characterized by increasing vehicle range, faster charging times, and improved safety features. Key innovations include advanced battery technologies, such as solid-state batteries, and integration of autonomous driving systems. Unique selling propositions include reduced emissions, lower running costs, and enhanced passenger comfort. These advancements are driving higher adoption rates and improving the overall customer experience.
Key Drivers, Barriers & Challenges in EV Taxi Industry
Key Drivers: Government incentives (tax credits, subsidies), increasing environmental concerns, falling battery costs, technological advancements in battery technology and autonomous driving.
Challenges: High initial investment costs for EV taxis, limited charging infrastructure in many areas, range anxiety among consumers, and competition from traditional taxi and ride-sharing services. The impact of these challenges is a slower than expected rollout in many regions, estimated to slow down growth by xx% in 2027.
Emerging Opportunities in EV Taxi Industry
Emerging opportunities include expanding into untapped markets in developing economies, integrating advanced technologies such as AI and machine learning for improved route optimization and passenger experience, and catering to the growing demand for sustainable tourism and logistics solutions. The integration of subscription models and the introduction of specialized services, such as dedicated EV taxi lanes, are additional opportunities that will shape the industry landscape.
Growth Accelerators in the EV Taxi Industry
Technological breakthroughs in battery technology, strategic partnerships between EV manufacturers and ride-hailing companies, and expansion into new markets are accelerating growth. Government policies aimed at promoting the adoption of EVs and improvements in charging infrastructure are also key growth catalysts.
Key Players Shaping the EV Taxi Industry Market
- Blu Smart Mobility
- Taxi Electric
- Say Taxi
- Ola Cabs
- eee-Taxi
- Connexxion
- Uber
- Prakrit
Notable Milestones in EV Taxi Industry Sector
- 2020: Several major cities introduced EV taxi pilot programs.
- 2022: Significant investments in charging infrastructure announced by governments worldwide.
- 2023: Several new EV taxi models launched with extended range and improved features.
In-Depth EV Taxi Industry Market Outlook
The future of the EV taxi industry is bright, with continued growth driven by technological advancements, supportive government policies, and increasing consumer demand for sustainable transportation. Strategic partnerships, market expansion into emerging economies, and the adoption of innovative business models will be key to success in this dynamic sector. The market is expected to see significant consolidation as larger players acquire smaller companies and expand their market share. The long-term outlook remains highly positive, with significant growth potential.
EV Taxi Industry Segmentation
-
1. Type
- 1.1. Hybrid Electric Vehicle
- 1.2. Battery Electric Vehicle
-
2. Vehicle Type
- 2.1. Two Wheeler Taxi
- 2.2. Four Wheeler Taxi
EV Taxi Industry Segmentation By Geography
- 1. United States
- 2. Canada
- 3. Rest of North America
- 4. Germany
- 5. United Kingdom
- 6. France
- 7. Italy
- 8. Rest of Europe
- 9. China
- 10. India
- 11. Japan
- 12. South Korea
- 13. Rest of Asia Pacific
- 14. Mexico
- 15. Brazil
- 16. United Arab Emirates
- 17. Other Countries

EV Taxi Industry REPORT HIGHLIGHTS
| Aspects | Details |
|---|---|
| Study Period | 2019-2033 |
| Base Year | 2024 |
| Estimated Year | 2025 |
| Forecast Period | 2025-2033 |
| Historical Period | 2019-2024 |
| Growth Rate | CAGR of > 12.00% from 2019-2033 |
| Segmentation |
|
Table of Contents
- 1. Introduction
- 1.1. Research Scope
- 1.2. Market Segmentation
- 1.3. Research Methodology
- 1.4. Definitions and Assumptions
- 2. Executive Summary
- 2.1. Introduction
- 3. Market Dynamics
- 3.1. Introduction
- 3.2. Market Drivers
- 3.2.1. Government Policies to promote electric Vehicles Sales
- 3.3. Market Restrains
- 3.3.1. High Cost of Capital Expenditure for Electric Vehicle Infrastructure
- 3.4. Market Trends
- 3.4.1. Government Initiatives and Investment is Boosting the Demand
- 4. Market Factor Analysis
- 4.1. Porters Five Forces
- 4.2. Supply/Value Chain
- 4.3. PESTEL analysis
- 4.4. Market Entropy
- 4.5. Patent/Trademark Analysis
- 5. Global EV Taxi Industry Analysis, Insights and Forecast, 2019-2031
- 5.1. Market Analysis, Insights and Forecast - by Type
- 5.1.1. Hybrid Electric Vehicle
- 5.1.2. Battery Electric Vehicle
- 5.2. Market Analysis, Insights and Forecast - by Vehicle Type
- 5.2.1. Two Wheeler Taxi
- 5.2.2. Four Wheeler Taxi
- 5.3. Market Analysis, Insights and Forecast - by Region
- 5.3.1. United States
- 5.3.2. Canada
- 5.3.3. Rest of North America
- 5.3.4. Germany
- 5.3.5. United Kingdom
- 5.3.6. France
- 5.3.7. Italy
- 5.3.8. Rest of Europe
- 5.3.9. China
- 5.3.10. India
- 5.3.11. Japan
- 5.3.12. South Korea
- 5.3.13. Rest of Asia Pacific
- 5.3.14. Mexico
- 5.3.15. Brazil
- 5.3.16. United Arab Emirates
- 5.3.17. Other Countries
- 5.1. Market Analysis, Insights and Forecast - by Type
- 6. United States EV Taxi Industry Analysis, Insights and Forecast, 2019-2031
- 6.1. Market Analysis, Insights and Forecast - by Type
- 6.1.1. Hybrid Electric Vehicle
- 6.1.2. Battery Electric Vehicle
- 6.2. Market Analysis, Insights and Forecast - by Vehicle Type
- 6.2.1. Two Wheeler Taxi
- 6.2.2. Four Wheeler Taxi
- 6.1. Market Analysis, Insights and Forecast - by Type
- 7. Canada EV Taxi Industry Analysis, Insights and Forecast, 2019-2031
- 7.1. Market Analysis, Insights and Forecast - by Type
- 7.1.1. Hybrid Electric Vehicle
- 7.1.2. Battery Electric Vehicle
- 7.2. Market Analysis, Insights and Forecast - by Vehicle Type
- 7.2.1. Two Wheeler Taxi
- 7.2.2. Four Wheeler Taxi
- 7.1. Market Analysis, Insights and Forecast - by Type
- 8. Rest of North America EV Taxi Industry Analysis, Insights and Forecast, 2019-2031
- 8.1. Market Analysis, Insights and Forecast - by Type
- 8.1.1. Hybrid Electric Vehicle
- 8.1.2. Battery Electric Vehicle
- 8.2. Market Analysis, Insights and Forecast - by Vehicle Type
- 8.2.1. Two Wheeler Taxi
- 8.2.2. Four Wheeler Taxi
- 8.1. Market Analysis, Insights and Forecast - by Type
- 9. Germany EV Taxi Industry Analysis, Insights and Forecast, 2019-2031
- 9.1. Market Analysis, Insights and Forecast - by Type
- 9.1.1. Hybrid Electric Vehicle
- 9.1.2. Battery Electric Vehicle
- 9.2. Market Analysis, Insights and Forecast - by Vehicle Type
- 9.2.1. Two Wheeler Taxi
- 9.2.2. Four Wheeler Taxi
- 9.1. Market Analysis, Insights and Forecast - by Type
- 10. United Kingdom EV Taxi Industry Analysis, Insights and Forecast, 2019-2031
- 10.1. Market Analysis, Insights and Forecast - by Type
- 10.1.1. Hybrid Electric Vehicle
- 10.1.2. Battery Electric Vehicle
- 10.2. Market Analysis, Insights and Forecast - by Vehicle Type
- 10.2.1. Two Wheeler Taxi
- 10.2.2. Four Wheeler Taxi
- 10.1. Market Analysis, Insights and Forecast - by Type
- 11. France EV Taxi Industry Analysis, Insights and Forecast, 2019-2031
- 11.1. Market Analysis, Insights and Forecast - by Type
- 11.1.1. Hybrid Electric Vehicle
- 11.1.2. Battery Electric Vehicle
- 11.2. Market Analysis, Insights and Forecast - by Vehicle Type
- 11.2.1. Two Wheeler Taxi
- 11.2.2. Four Wheeler Taxi
- 11.1. Market Analysis, Insights and Forecast - by Type
- 12. Italy EV Taxi Industry Analysis, Insights and Forecast, 2019-2031
- 12.1. Market Analysis, Insights and Forecast - by Type
- 12.1.1. Hybrid Electric Vehicle
- 12.1.2. Battery Electric Vehicle
- 12.2. Market Analysis, Insights and Forecast - by Vehicle Type
- 12.2.1. Two Wheeler Taxi
- 12.2.2. Four Wheeler Taxi
- 12.1. Market Analysis, Insights and Forecast - by Type
- 13. Rest of Europe EV Taxi Industry Analysis, Insights and Forecast, 2019-2031
- 13.1. Market Analysis, Insights and Forecast - by Type
- 13.1.1. Hybrid Electric Vehicle
- 13.1.2. Battery Electric Vehicle
- 13.2. Market Analysis, Insights and Forecast - by Vehicle Type
- 13.2.1. Two Wheeler Taxi
- 13.2.2. Four Wheeler Taxi
- 13.1. Market Analysis, Insights and Forecast - by Type
- 14. China EV Taxi Industry Analysis, Insights and Forecast, 2019-2031
- 14.1. Market Analysis, Insights and Forecast - by Type
- 14.1.1. Hybrid Electric Vehicle
- 14.1.2. Battery Electric Vehicle
- 14.2. Market Analysis, Insights and Forecast - by Vehicle Type
- 14.2.1. Two Wheeler Taxi
- 14.2.2. Four Wheeler Taxi
- 14.1. Market Analysis, Insights and Forecast - by Type
- 15. India EV Taxi Industry Analysis, Insights and Forecast, 2019-2031
- 15.1. Market Analysis, Insights and Forecast - by Type
- 15.1.1. Hybrid Electric Vehicle
- 15.1.2. Battery Electric Vehicle
- 15.2. Market Analysis, Insights and Forecast - by Vehicle Type
- 15.2.1. Two Wheeler Taxi
- 15.2.2. Four Wheeler Taxi
- 15.1. Market Analysis, Insights and Forecast - by Type
- 16. Japan EV Taxi Industry Analysis, Insights and Forecast, 2019-2031
- 16.1. Market Analysis, Insights and Forecast - by Type
- 16.1.1. Hybrid Electric Vehicle
- 16.1.2. Battery Electric Vehicle
- 16.2. Market Analysis, Insights and Forecast - by Vehicle Type
- 16.2.1. Two Wheeler Taxi
- 16.2.2. Four Wheeler Taxi
- 16.1. Market Analysis, Insights and Forecast - by Type
- 17. South Korea EV Taxi Industry Analysis, Insights and Forecast, 2019-2031
- 17.1. Market Analysis, Insights and Forecast - by Type
- 17.1.1. Hybrid Electric Vehicle
- 17.1.2. Battery Electric Vehicle
- 17.2. Market Analysis, Insights and Forecast - by Vehicle Type
- 17.2.1. Two Wheeler Taxi
- 17.2.2. Four Wheeler Taxi
- 17.1. Market Analysis, Insights and Forecast - by Type
- 18. Rest of Asia Pacific EV Taxi Industry Analysis, Insights and Forecast, 2019-2031
- 18.1. Market Analysis, Insights and Forecast - by Type
- 18.1.1. Hybrid Electric Vehicle
- 18.1.2. Battery Electric Vehicle
- 18.2. Market Analysis, Insights and Forecast - by Vehicle Type
- 18.2.1. Two Wheeler Taxi
- 18.2.2. Four Wheeler Taxi
- 18.1. Market Analysis, Insights and Forecast - by Type
- 19. Mexico EV Taxi Industry Analysis, Insights and Forecast, 2019-2031
- 19.1. Market Analysis, Insights and Forecast - by Type
- 19.1.1. Hybrid Electric Vehicle
- 19.1.2. Battery Electric Vehicle
- 19.2. Market Analysis, Insights and Forecast - by Vehicle Type
- 19.2.1. Two Wheeler Taxi
- 19.2.2. Four Wheeler Taxi
- 19.1. Market Analysis, Insights and Forecast - by Type
- 20. Brazil EV Taxi Industry Analysis, Insights and Forecast, 2019-2031
- 20.1. Market Analysis, Insights and Forecast - by Type
- 20.1.1. Hybrid Electric Vehicle
- 20.1.2. Battery Electric Vehicle
- 20.2. Market Analysis, Insights and Forecast - by Vehicle Type
- 20.2.1. Two Wheeler Taxi
- 20.2.2. Four Wheeler Taxi
- 20.1. Market Analysis, Insights and Forecast - by Type
- 21. United Arab Emirates EV Taxi Industry Analysis, Insights and Forecast, 2019-2031
- 21.1. Market Analysis, Insights and Forecast - by Type
- 21.1.1. Hybrid Electric Vehicle
- 21.1.2. Battery Electric Vehicle
- 21.2. Market Analysis, Insights and Forecast - by Vehicle Type
- 21.2.1. Two Wheeler Taxi
- 21.2.2. Four Wheeler Taxi
- 21.1. Market Analysis, Insights and Forecast - by Type
- 22. Other Countries EV Taxi Industry Analysis, Insights and Forecast, 2019-2031
- 22.1. Market Analysis, Insights and Forecast - by Type
- 22.1.1. Hybrid Electric Vehicle
- 22.1.2. Battery Electric Vehicle
- 22.2. Market Analysis, Insights and Forecast - by Vehicle Type
- 22.2.1. Two Wheeler Taxi
- 22.2.2. Four Wheeler Taxi
- 22.1. Market Analysis, Insights and Forecast - by Type
- 23. United States EV Taxi Industry Analysis, Insights and Forecast, 2019-2031
- 23.1. Market Analysis, Insights and Forecast - By Country/Sub-region
- 23.1.1.
- 24. Canada EV Taxi Industry Analysis, Insights and Forecast, 2019-2031
- 24.1. Market Analysis, Insights and Forecast - By Country/Sub-region
- 24.1.1.
- 25. Rest of North America EV Taxi Industry Analysis, Insights and Forecast, 2019-2031
- 25.1. Market Analysis, Insights and Forecast - By Country/Sub-region
- 25.1.1.
- 26. Germany EV Taxi Industry Analysis, Insights and Forecast, 2019-2031
- 26.1. Market Analysis, Insights and Forecast - By Country/Sub-region
- 26.1.1.
- 27. United Kingdom EV Taxi Industry Analysis, Insights and Forecast, 2019-2031
- 27.1. Market Analysis, Insights and Forecast - By Country/Sub-region
- 27.1.1.
- 28. France EV Taxi Industry Analysis, Insights and Forecast, 2019-2031
- 28.1. Market Analysis, Insights and Forecast - By Country/Sub-region
- 28.1.1.
- 29. Italy EV Taxi Industry Analysis, Insights and Forecast, 2019-2031
- 29.1. Market Analysis, Insights and Forecast - By Country/Sub-region
- 29.1.1.
- 30. Rest of Europe EV Taxi Industry Analysis, Insights and Forecast, 2019-2031
- 30.1. Market Analysis, Insights and Forecast - By Country/Sub-region
- 30.1.1.
- 31. China EV Taxi Industry Analysis, Insights and Forecast, 2019-2031
- 31.1. Market Analysis, Insights and Forecast - By Country/Sub-region
- 31.1.1.
- 32. India EV Taxi Industry Analysis, Insights and Forecast, 2019-2031
- 32.1. Market Analysis, Insights and Forecast - By Country/Sub-region
- 32.1.1.
- 33. Japan EV Taxi Industry Analysis, Insights and Forecast, 2019-2031
- 33.1. Market Analysis, Insights and Forecast - By Country/Sub-region
- 33.1.1.
- 34. South Korea EV Taxi Industry Analysis, Insights and Forecast, 2019-2031
- 34.1. Market Analysis, Insights and Forecast - By Country/Sub-region
- 34.1.1.
- 35. Rest of Asia Pacific EV Taxi Industry Analysis, Insights and Forecast, 2019-2031
- 35.1. Market Analysis, Insights and Forecast - By Country/Sub-region
- 35.1.1.
- 36. Mexico EV Taxi Industry Analysis, Insights and Forecast, 2019-2031
- 36.1. Market Analysis, Insights and Forecast - By Country/Sub-region
- 36.1.1.
- 37. Brazil EV Taxi Industry Analysis, Insights and Forecast, 2019-2031
- 37.1. Market Analysis, Insights and Forecast - By Country/Sub-region
- 37.1.1.
- 38. United Arab Emirates EV Taxi Industry Analysis, Insights and Forecast, 2019-2031
- 38.1. Market Analysis, Insights and Forecast - By Country/Sub-region
- 38.1.1.
- 39. Other Countries EV Taxi Industry Analysis, Insights and Forecast, 2019-2031
- 39.1. Market Analysis, Insights and Forecast - By Country/Sub-region
- 39.1.1.
- 40. Competitive Analysis
- 40.1. Global Market Share Analysis 2024
- 40.2. Company Profiles
- 40.2.1 Blu Smart Mobility
- 40.2.1.1. Overview
- 40.2.1.2. Products
- 40.2.1.3. SWOT Analysis
- 40.2.1.4. Recent Developments
- 40.2.1.5. Financials (Based on Availability)
- 40.2.2 Taxi Electric
- 40.2.2.1. Overview
- 40.2.2.2. Products
- 40.2.2.3. SWOT Analysis
- 40.2.2.4. Recent Developments
- 40.2.2.5. Financials (Based on Availability)
- 40.2.3 Say Taxi
- 40.2.3.1. Overview
- 40.2.3.2. Products
- 40.2.3.3. SWOT Analysis
- 40.2.3.4. Recent Developments
- 40.2.3.5. Financials (Based on Availability)
- 40.2.4 Ola Cabs
- 40.2.4.1. Overview
- 40.2.4.2. Products
- 40.2.4.3. SWOT Analysis
- 40.2.4.4. Recent Developments
- 40.2.4.5. Financials (Based on Availability)
- 40.2.5 eee-Taxi
- 40.2.5.1. Overview
- 40.2.5.2. Products
- 40.2.5.3. SWOT Analysis
- 40.2.5.4. Recent Developments
- 40.2.5.5. Financials (Based on Availability)
- 40.2.6 Connexxion
- 40.2.6.1. Overview
- 40.2.6.2. Products
- 40.2.6.3. SWOT Analysis
- 40.2.6.4. Recent Developments
- 40.2.6.5. Financials (Based on Availability)
- 40.2.7 Uber
- 40.2.7.1. Overview
- 40.2.7.2. Products
- 40.2.7.3. SWOT Analysis
- 40.2.7.4. Recent Developments
- 40.2.7.5. Financials (Based on Availability)
- 40.2.8 Prakrit
- 40.2.8.1. Overview
- 40.2.8.2. Products
- 40.2.8.3. SWOT Analysis
- 40.2.8.4. Recent Developments
- 40.2.8.5. Financials (Based on Availability)
- 40.2.1 Blu Smart Mobility
List of Figures
- Figure 1: Global EV Taxi Industry Revenue Breakdown (Million, %) by Region 2024 & 2032
- Figure 2: United States EV Taxi Industry Revenue (Million), by Country 2024 & 2032
- Figure 3: United States EV Taxi Industry Revenue Share (%), by Country 2024 & 2032
- Figure 4: Canada EV Taxi Industry Revenue (Million), by Country 2024 & 2032
- Figure 5: Canada EV Taxi Industry Revenue Share (%), by Country 2024 & 2032
- Figure 6: Rest of North America EV Taxi Industry Revenue (Million), by Country 2024 & 2032
- Figure 7: Rest of North America EV Taxi Industry Revenue Share (%), by Country 2024 & 2032
- Figure 8: Germany EV Taxi Industry Revenue (Million), by Country 2024 & 2032
- Figure 9: Germany EV Taxi Industry Revenue Share (%), by Country 2024 & 2032
- Figure 10: United Kingdom EV Taxi Industry Revenue (Million), by Country 2024 & 2032
- Figure 11: United Kingdom EV Taxi Industry Revenue Share (%), by Country 2024 & 2032
- Figure 12: France EV Taxi Industry Revenue (Million), by Country 2024 & 2032
- Figure 13: France EV Taxi Industry Revenue Share (%), by Country 2024 & 2032
- Figure 14: Italy EV Taxi Industry Revenue (Million), by Country 2024 & 2032
- Figure 15: Italy EV Taxi Industry Revenue Share (%), by Country 2024 & 2032
- Figure 16: Rest of Europe EV Taxi Industry Revenue (Million), by Country 2024 & 2032
- Figure 17: Rest of Europe EV Taxi Industry Revenue Share (%), by Country 2024 & 2032
- Figure 18: China EV Taxi Industry Revenue (Million), by Country 2024 & 2032
- Figure 19: China EV Taxi Industry Revenue Share (%), by Country 2024 & 2032
- Figure 20: India EV Taxi Industry Revenue (Million), by Country 2024 & 2032
- Figure 21: India EV Taxi Industry Revenue Share (%), by Country 2024 & 2032
- Figure 22: Japan EV Taxi Industry Revenue (Million), by Country 2024 & 2032
- Figure 23: Japan EV Taxi Industry Revenue Share (%), by Country 2024 & 2032
- Figure 24: South Korea EV Taxi Industry Revenue (Million), by Country 2024 & 2032
- Figure 25: South Korea EV Taxi Industry Revenue Share (%), by Country 2024 & 2032
- Figure 26: Rest of Asia Pacific EV Taxi Industry Revenue (Million), by Country 2024 & 2032
- Figure 27: Rest of Asia Pacific EV Taxi Industry Revenue Share (%), by Country 2024 & 2032
- Figure 28: Mexico EV Taxi Industry Revenue (Million), by Country 2024 & 2032
- Figure 29: Mexico EV Taxi Industry Revenue Share (%), by Country 2024 & 2032
- Figure 30: Brazil EV Taxi Industry Revenue (Million), by Country 2024 & 2032
- Figure 31: Brazil EV Taxi Industry Revenue Share (%), by Country 2024 & 2032
- Figure 32: United Arab Emirates EV Taxi Industry Revenue (Million), by Country 2024 & 2032
- Figure 33: United Arab Emirates EV Taxi Industry Revenue Share (%), by Country 2024 & 2032
- Figure 34: Other Countries EV Taxi Industry Revenue (Million), by Country 2024 & 2032
- Figure 35: Other Countries EV Taxi Industry Revenue Share (%), by Country 2024 & 2032
- Figure 36: United States EV Taxi Industry Revenue (Million), by Type 2024 & 2032
- Figure 37: United States EV Taxi Industry Revenue Share (%), by Type 2024 & 2032
- Figure 38: United States EV Taxi Industry Revenue (Million), by Vehicle Type 2024 & 2032
- Figure 39: United States EV Taxi Industry Revenue Share (%), by Vehicle Type 2024 & 2032
- Figure 40: United States EV Taxi Industry Revenue (Million), by Country 2024 & 2032
- Figure 41: United States EV Taxi Industry Revenue Share (%), by Country 2024 & 2032
- Figure 42: Canada EV Taxi Industry Revenue (Million), by Type 2024 & 2032
- Figure 43: Canada EV Taxi Industry Revenue Share (%), by Type 2024 & 2032
- Figure 44: Canada EV Taxi Industry Revenue (Million), by Vehicle Type 2024 & 2032
- Figure 45: Canada EV Taxi Industry Revenue Share (%), by Vehicle Type 2024 & 2032
- Figure 46: Canada EV Taxi Industry Revenue (Million), by Country 2024 & 2032
- Figure 47: Canada EV Taxi Industry Revenue Share (%), by Country 2024 & 2032
- Figure 48: Rest of North America EV Taxi Industry Revenue (Million), by Type 2024 & 2032
- Figure 49: Rest of North America EV Taxi Industry Revenue Share (%), by Type 2024 & 2032
- Figure 50: Rest of North America EV Taxi Industry Revenue (Million), by Vehicle Type 2024 & 2032
- Figure 51: Rest of North America EV Taxi Industry Revenue Share (%), by Vehicle Type 2024 & 2032
- Figure 52: Rest of North America EV Taxi Industry Revenue (Million), by Country 2024 & 2032
- Figure 53: Rest of North America EV Taxi Industry Revenue Share (%), by Country 2024 & 2032
- Figure 54: Germany EV Taxi Industry Revenue (Million), by Type 2024 & 2032
- Figure 55: Germany EV Taxi Industry Revenue Share (%), by Type 2024 & 2032
- Figure 56: Germany EV Taxi Industry Revenue (Million), by Vehicle Type 2024 & 2032
- Figure 57: Germany EV Taxi Industry Revenue Share (%), by Vehicle Type 2024 & 2032
- Figure 58: Germany EV Taxi Industry Revenue (Million), by Country 2024 & 2032
- Figure 59: Germany EV Taxi Industry Revenue Share (%), by Country 2024 & 2032
- Figure 60: United Kingdom EV Taxi Industry Revenue (Million), by Type 2024 & 2032
- Figure 61: United Kingdom EV Taxi Industry Revenue Share (%), by Type 2024 & 2032
- Figure 62: United Kingdom EV Taxi Industry Revenue (Million), by Vehicle Type 2024 & 2032
- Figure 63: United Kingdom EV Taxi Industry Revenue Share (%), by Vehicle Type 2024 & 2032
- Figure 64: United Kingdom EV Taxi Industry Revenue (Million), by Country 2024 & 2032
- Figure 65: United Kingdom EV Taxi Industry Revenue Share (%), by Country 2024 & 2032
- Figure 66: France EV Taxi Industry Revenue (Million), by Type 2024 & 2032
- Figure 67: France EV Taxi Industry Revenue Share (%), by Type 2024 & 2032
- Figure 68: France EV Taxi Industry Revenue (Million), by Vehicle Type 2024 & 2032
- Figure 69: France EV Taxi Industry Revenue Share (%), by Vehicle Type 2024 & 2032
- Figure 70: France EV Taxi Industry Revenue (Million), by Country 2024 & 2032
- Figure 71: France EV Taxi Industry Revenue Share (%), by Country 2024 & 2032
- Figure 72: Italy EV Taxi Industry Revenue (Million), by Type 2024 & 2032
- Figure 73: Italy EV Taxi Industry Revenue Share (%), by Type 2024 & 2032
- Figure 74: Italy EV Taxi Industry Revenue (Million), by Vehicle Type 2024 & 2032
- Figure 75: Italy EV Taxi Industry Revenue Share (%), by Vehicle Type 2024 & 2032
- Figure 76: Italy EV Taxi Industry Revenue (Million), by Country 2024 & 2032
- Figure 77: Italy EV Taxi Industry Revenue Share (%), by Country 2024 & 2032
- Figure 78: Rest of Europe EV Taxi Industry Revenue (Million), by Type 2024 & 2032
- Figure 79: Rest of Europe EV Taxi Industry Revenue Share (%), by Type 2024 & 2032
- Figure 80: Rest of Europe EV Taxi Industry Revenue (Million), by Vehicle Type 2024 & 2032
- Figure 81: Rest of Europe EV Taxi Industry Revenue Share (%), by Vehicle Type 2024 & 2032
- Figure 82: Rest of Europe EV Taxi Industry Revenue (Million), by Country 2024 & 2032
- Figure 83: Rest of Europe EV Taxi Industry Revenue Share (%), by Country 2024 & 2032
- Figure 84: China EV Taxi Industry Revenue (Million), by Type 2024 & 2032
- Figure 85: China EV Taxi Industry Revenue Share (%), by Type 2024 & 2032
- Figure 86: China EV Taxi Industry Revenue (Million), by Vehicle Type 2024 & 2032
- Figure 87: China EV Taxi Industry Revenue Share (%), by Vehicle Type 2024 & 2032
- Figure 88: China EV Taxi Industry Revenue (Million), by Country 2024 & 2032
- Figure 89: China EV Taxi Industry Revenue Share (%), by Country 2024 & 2032
- Figure 90: India EV Taxi Industry Revenue (Million), by Type 2024 & 2032
- Figure 91: India EV Taxi Industry Revenue Share (%), by Type 2024 & 2032
- Figure 92: India EV Taxi Industry Revenue (Million), by Vehicle Type 2024 & 2032
- Figure 93: India EV Taxi Industry Revenue Share (%), by Vehicle Type 2024 & 2032
- Figure 94: India EV Taxi Industry Revenue (Million), by Country 2024 & 2032
- Figure 95: India EV Taxi Industry Revenue Share (%), by Country 2024 & 2032
- Figure 96: Japan EV Taxi Industry Revenue (Million), by Type 2024 & 2032
- Figure 97: Japan EV Taxi Industry Revenue Share (%), by Type 2024 & 2032
- Figure 98: Japan EV Taxi Industry Revenue (Million), by Vehicle Type 2024 & 2032
- Figure 99: Japan EV Taxi Industry Revenue Share (%), by Vehicle Type 2024 & 2032
- Figure 100: Japan EV Taxi Industry Revenue (Million), by Country 2024 & 2032
- Figure 101: Japan EV Taxi Industry Revenue Share (%), by Country 2024 & 2032
- Figure 102: South Korea EV Taxi Industry Revenue (Million), by Type 2024 & 2032
- Figure 103: South Korea EV Taxi Industry Revenue Share (%), by Type 2024 & 2032
- Figure 104: South Korea EV Taxi Industry Revenue (Million), by Vehicle Type 2024 & 2032
- Figure 105: South Korea EV Taxi Industry Revenue Share (%), by Vehicle Type 2024 & 2032
- Figure 106: South Korea EV Taxi Industry Revenue (Million), by Country 2024 & 2032
- Figure 107: South Korea EV Taxi Industry Revenue Share (%), by Country 2024 & 2032
- Figure 108: Rest of Asia Pacific EV Taxi Industry Revenue (Million), by Type 2024 & 2032
- Figure 109: Rest of Asia Pacific EV Taxi Industry Revenue Share (%), by Type 2024 & 2032
- Figure 110: Rest of Asia Pacific EV Taxi Industry Revenue (Million), by Vehicle Type 2024 & 2032
- Figure 111: Rest of Asia Pacific EV Taxi Industry Revenue Share (%), by Vehicle Type 2024 & 2032
- Figure 112: Rest of Asia Pacific EV Taxi Industry Revenue (Million), by Country 2024 & 2032
- Figure 113: Rest of Asia Pacific EV Taxi Industry Revenue Share (%), by Country 2024 & 2032
- Figure 114: Mexico EV Taxi Industry Revenue (Million), by Type 2024 & 2032
- Figure 115: Mexico EV Taxi Industry Revenue Share (%), by Type 2024 & 2032
- Figure 116: Mexico EV Taxi Industry Revenue (Million), by Vehicle Type 2024 & 2032
- Figure 117: Mexico EV Taxi Industry Revenue Share (%), by Vehicle Type 2024 & 2032
- Figure 118: Mexico EV Taxi Industry Revenue (Million), by Country 2024 & 2032
- Figure 119: Mexico EV Taxi Industry Revenue Share (%), by Country 2024 & 2032
- Figure 120: Brazil EV Taxi Industry Revenue (Million), by Type 2024 & 2032
- Figure 121: Brazil EV Taxi Industry Revenue Share (%), by Type 2024 & 2032
- Figure 122: Brazil EV Taxi Industry Revenue (Million), by Vehicle Type 2024 & 2032
- Figure 123: Brazil EV Taxi Industry Revenue Share (%), by Vehicle Type 2024 & 2032
- Figure 124: Brazil EV Taxi Industry Revenue (Million), by Country 2024 & 2032
- Figure 125: Brazil EV Taxi Industry Revenue Share (%), by Country 2024 & 2032
- Figure 126: United Arab Emirates EV Taxi Industry Revenue (Million), by Type 2024 & 2032
- Figure 127: United Arab Emirates EV Taxi Industry Revenue Share (%), by Type 2024 & 2032
- Figure 128: United Arab Emirates EV Taxi Industry Revenue (Million), by Vehicle Type 2024 & 2032
- Figure 129: United Arab Emirates EV Taxi Industry Revenue Share (%), by Vehicle Type 2024 & 2032
- Figure 130: United Arab Emirates EV Taxi Industry Revenue (Million), by Country 2024 & 2032
- Figure 131: United Arab Emirates EV Taxi Industry Revenue Share (%), by Country 2024 & 2032
- Figure 132: Other Countries EV Taxi Industry Revenue (Million), by Type 2024 & 2032
- Figure 133: Other Countries EV Taxi Industry Revenue Share (%), by Type 2024 & 2032
- Figure 134: Other Countries EV Taxi Industry Revenue (Million), by Vehicle Type 2024 & 2032
- Figure 135: Other Countries EV Taxi Industry Revenue Share (%), by Vehicle Type 2024 & 2032
- Figure 136: Other Countries EV Taxi Industry Revenue (Million), by Country 2024 & 2032
- Figure 137: Other Countries EV Taxi Industry Revenue Share (%), by Country 2024 & 2032
List of Tables
- Table 1: Global EV Taxi Industry Revenue Million Forecast, by Region 2019 & 2032
- Table 2: Global EV Taxi Industry Revenue Million Forecast, by Type 2019 & 2032
- Table 3: Global EV Taxi Industry Revenue Million Forecast, by Vehicle Type 2019 & 2032
- Table 4: Global EV Taxi Industry Revenue Million Forecast, by Region 2019 & 2032
- Table 5: Global EV Taxi Industry Revenue Million Forecast, by Country 2019 & 2032
- Table 6: EV Taxi Industry Revenue (Million) Forecast, by Application 2019 & 2032
- Table 7: Global EV Taxi Industry Revenue Million Forecast, by Country 2019 & 2032
- Table 8: EV Taxi Industry Revenue (Million) Forecast, by Application 2019 & 2032
- Table 9: Global EV Taxi Industry Revenue Million Forecast, by Country 2019 & 2032
- Table 10: EV Taxi Industry Revenue (Million) Forecast, by Application 2019 & 2032
- Table 11: Global EV Taxi Industry Revenue Million Forecast, by Country 2019 & 2032
- Table 12: EV Taxi Industry Revenue (Million) Forecast, by Application 2019 & 2032
- Table 13: Global EV Taxi Industry Revenue Million Forecast, by Country 2019 & 2032
- Table 14: EV Taxi Industry Revenue (Million) Forecast, by Application 2019 & 2032
- Table 15: Global EV Taxi Industry Revenue Million Forecast, by Country 2019 & 2032
- Table 16: EV Taxi Industry Revenue (Million) Forecast, by Application 2019 & 2032
- Table 17: Global EV Taxi Industry Revenue Million Forecast, by Country 2019 & 2032
- Table 18: EV Taxi Industry Revenue (Million) Forecast, by Application 2019 & 2032
- Table 19: Global EV Taxi Industry Revenue Million Forecast, by Country 2019 & 2032
- Table 20: EV Taxi Industry Revenue (Million) Forecast, by Application 2019 & 2032
- Table 21: Global EV Taxi Industry Revenue Million Forecast, by Country 2019 & 2032
- Table 22: EV Taxi Industry Revenue (Million) Forecast, by Application 2019 & 2032
- Table 23: Global EV Taxi Industry Revenue Million Forecast, by Country 2019 & 2032
- Table 24: EV Taxi Industry Revenue (Million) Forecast, by Application 2019 & 2032
- Table 25: Global EV Taxi Industry Revenue Million Forecast, by Country 2019 & 2032
- Table 26: EV Taxi Industry Revenue (Million) Forecast, by Application 2019 & 2032
- Table 27: Global EV Taxi Industry Revenue Million Forecast, by Country 2019 & 2032
- Table 28: EV Taxi Industry Revenue (Million) Forecast, by Application 2019 & 2032
- Table 29: Global EV Taxi Industry Revenue Million Forecast, by Country 2019 & 2032
- Table 30: EV Taxi Industry Revenue (Million) Forecast, by Application 2019 & 2032
- Table 31: Global EV Taxi Industry Revenue Million Forecast, by Country 2019 & 2032
- Table 32: EV Taxi Industry Revenue (Million) Forecast, by Application 2019 & 2032
- Table 33: Global EV Taxi Industry Revenue Million Forecast, by Country 2019 & 2032
- Table 34: EV Taxi Industry Revenue (Million) Forecast, by Application 2019 & 2032
- Table 35: Global EV Taxi Industry Revenue Million Forecast, by Country 2019 & 2032
- Table 36: EV Taxi Industry Revenue (Million) Forecast, by Application 2019 & 2032
- Table 37: Global EV Taxi Industry Revenue Million Forecast, by Country 2019 & 2032
- Table 38: EV Taxi Industry Revenue (Million) Forecast, by Application 2019 & 2032
- Table 39: Global EV Taxi Industry Revenue Million Forecast, by Type 2019 & 2032
- Table 40: Global EV Taxi Industry Revenue Million Forecast, by Vehicle Type 2019 & 2032
- Table 41: Global EV Taxi Industry Revenue Million Forecast, by Country 2019 & 2032
- Table 42: Global EV Taxi Industry Revenue Million Forecast, by Type 2019 & 2032
- Table 43: Global EV Taxi Industry Revenue Million Forecast, by Vehicle Type 2019 & 2032
- Table 44: Global EV Taxi Industry Revenue Million Forecast, by Country 2019 & 2032
- Table 45: Global EV Taxi Industry Revenue Million Forecast, by Type 2019 & 2032
- Table 46: Global EV Taxi Industry Revenue Million Forecast, by Vehicle Type 2019 & 2032
- Table 47: Global EV Taxi Industry Revenue Million Forecast, by Country 2019 & 2032
- Table 48: Global EV Taxi Industry Revenue Million Forecast, by Type 2019 & 2032
- Table 49: Global EV Taxi Industry Revenue Million Forecast, by Vehicle Type 2019 & 2032
- Table 50: Global EV Taxi Industry Revenue Million Forecast, by Country 2019 & 2032
- Table 51: Global EV Taxi Industry Revenue Million Forecast, by Type 2019 & 2032
- Table 52: Global EV Taxi Industry Revenue Million Forecast, by Vehicle Type 2019 & 2032
- Table 53: Global EV Taxi Industry Revenue Million Forecast, by Country 2019 & 2032
- Table 54: Global EV Taxi Industry Revenue Million Forecast, by Type 2019 & 2032
- Table 55: Global EV Taxi Industry Revenue Million Forecast, by Vehicle Type 2019 & 2032
- Table 56: Global EV Taxi Industry Revenue Million Forecast, by Country 2019 & 2032
- Table 57: Global EV Taxi Industry Revenue Million Forecast, by Type 2019 & 2032
- Table 58: Global EV Taxi Industry Revenue Million Forecast, by Vehicle Type 2019 & 2032
- Table 59: Global EV Taxi Industry Revenue Million Forecast, by Country 2019 & 2032
- Table 60: Global EV Taxi Industry Revenue Million Forecast, by Type 2019 & 2032
- Table 61: Global EV Taxi Industry Revenue Million Forecast, by Vehicle Type 2019 & 2032
- Table 62: Global EV Taxi Industry Revenue Million Forecast, by Country 2019 & 2032
- Table 63: Global EV Taxi Industry Revenue Million Forecast, by Type 2019 & 2032
- Table 64: Global EV Taxi Industry Revenue Million Forecast, by Vehicle Type 2019 & 2032
- Table 65: Global EV Taxi Industry Revenue Million Forecast, by Country 2019 & 2032
- Table 66: Global EV Taxi Industry Revenue Million Forecast, by Type 2019 & 2032
- Table 67: Global EV Taxi Industry Revenue Million Forecast, by Vehicle Type 2019 & 2032
- Table 68: Global EV Taxi Industry Revenue Million Forecast, by Country 2019 & 2032
- Table 69: Global EV Taxi Industry Revenue Million Forecast, by Type 2019 & 2032
- Table 70: Global EV Taxi Industry Revenue Million Forecast, by Vehicle Type 2019 & 2032
- Table 71: Global EV Taxi Industry Revenue Million Forecast, by Country 2019 & 2032
- Table 72: Global EV Taxi Industry Revenue Million Forecast, by Type 2019 & 2032
- Table 73: Global EV Taxi Industry Revenue Million Forecast, by Vehicle Type 2019 & 2032
- Table 74: Global EV Taxi Industry Revenue Million Forecast, by Country 2019 & 2032
- Table 75: Global EV Taxi Industry Revenue Million Forecast, by Type 2019 & 2032
- Table 76: Global EV Taxi Industry Revenue Million Forecast, by Vehicle Type 2019 & 2032
- Table 77: Global EV Taxi Industry Revenue Million Forecast, by Country 2019 & 2032
- Table 78: Global EV Taxi Industry Revenue Million Forecast, by Type 2019 & 2032
- Table 79: Global EV Taxi Industry Revenue Million Forecast, by Vehicle Type 2019 & 2032
- Table 80: Global EV Taxi Industry Revenue Million Forecast, by Country 2019 & 2032
- Table 81: Global EV Taxi Industry Revenue Million Forecast, by Type 2019 & 2032
- Table 82: Global EV Taxi Industry Revenue Million Forecast, by Vehicle Type 2019 & 2032
- Table 83: Global EV Taxi Industry Revenue Million Forecast, by Country 2019 & 2032
- Table 84: Global EV Taxi Industry Revenue Million Forecast, by Type 2019 & 2032
- Table 85: Global EV Taxi Industry Revenue Million Forecast, by Vehicle Type 2019 & 2032
- Table 86: Global EV Taxi Industry Revenue Million Forecast, by Country 2019 & 2032
- Table 87: Global EV Taxi Industry Revenue Million Forecast, by Type 2019 & 2032
- Table 88: Global EV Taxi Industry Revenue Million Forecast, by Vehicle Type 2019 & 2032
- Table 89: Global EV Taxi Industry Revenue Million Forecast, by Country 2019 & 2032
Frequently Asked Questions
1. What is the projected Compound Annual Growth Rate (CAGR) of the EV Taxi Industry?
The projected CAGR is approximately > 12.00%.
2. Which companies are prominent players in the EV Taxi Industry?
Key companies in the market include Blu Smart Mobility, Taxi Electric, Say Taxi, Ola Cabs, eee-Taxi, Connexxion, Uber, Prakrit.
3. What are the main segments of the EV Taxi Industry?
The market segments include Type, Vehicle Type.
4. Can you provide details about the market size?
The market size is estimated to be USD XX Million as of 2022.
5. What are some drivers contributing to market growth?
Government Policies to promote electric Vehicles Sales.
6. What are the notable trends driving market growth?
Government Initiatives and Investment is Boosting the Demand.
7. Are there any restraints impacting market growth?
High Cost of Capital Expenditure for Electric Vehicle Infrastructure.
8. Can you provide examples of recent developments in the market?
N/A
9. What pricing options are available for accessing the report?
Pricing options include single-user, multi-user, and enterprise licenses priced at USD 4750, USD 5250, and USD 8750 respectively.
10. Is the market size provided in terms of value or volume?
The market size is provided in terms of value, measured in Million.
11. Are there any specific market keywords associated with the report?
Yes, the market keyword associated with the report is "EV Taxi Industry," which aids in identifying and referencing the specific market segment covered.
12. How do I determine which pricing option suits my needs best?
The pricing options vary based on user requirements and access needs. Individual users may opt for single-user licenses, while businesses requiring broader access may choose multi-user or enterprise licenses for cost-effective access to the report.
13. Are there any additional resources or data provided in the EV Taxi Industry report?
While the report offers comprehensive insights, it's advisable to review the specific contents or supplementary materials provided to ascertain if additional resources or data are available.
14. How can I stay updated on further developments or reports in the EV Taxi Industry?
To stay informed about further developments, trends, and reports in the EV Taxi Industry, consider subscribing to industry newsletters, following relevant companies and organizations, or regularly checking reputable industry news sources and publications.
Methodology
Step 1 - Identification of Relevant Samples Size from Population Database


Step 2 - Approaches for Defining Global Market Size (Value, Volume* & Price*)

Note*: In applicable scenarios
Step 3 - Data Sources
Primary Research
- Web Analytics
- Survey Reports
- Research Institute
- Latest Research Reports
- Opinion Leaders
Secondary Research
- Annual Reports
- White Paper
- Latest Press Release
- Industry Association
- Paid Database
- Investor Presentations

Step 4 - Data Triangulation
Involves using different sources of information in order to increase the validity of a study
These sources are likely to be stakeholders in a program - participants, other researchers, program staff, other community members, and so on.
Then we put all data in single framework & apply various statistical tools to find out the dynamic on the market.
During the analysis stage, feedback from the stakeholder groups would be compared to determine areas of agreement as well as areas of divergence
