

Key Insights
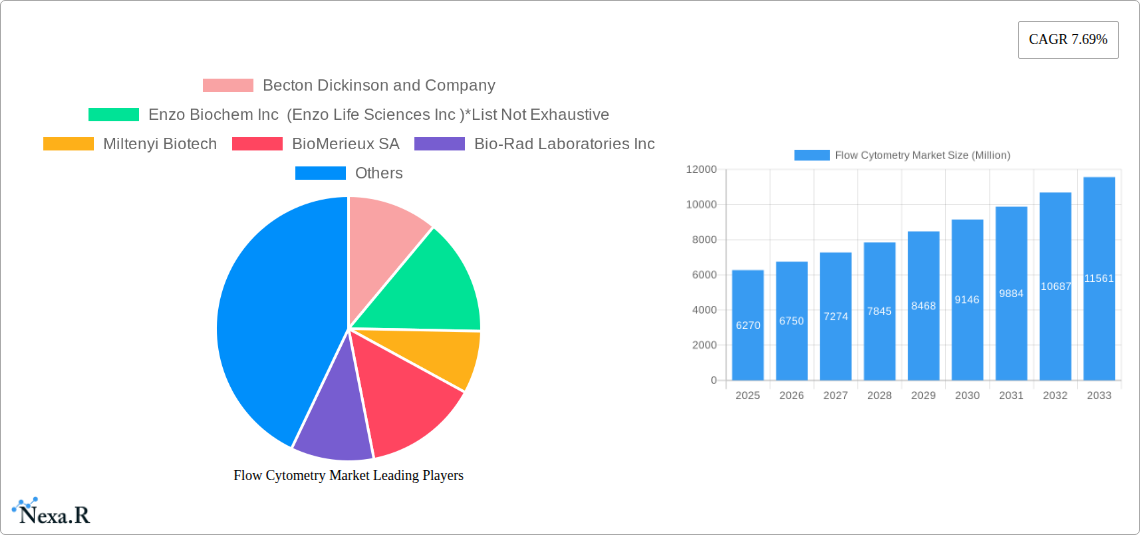
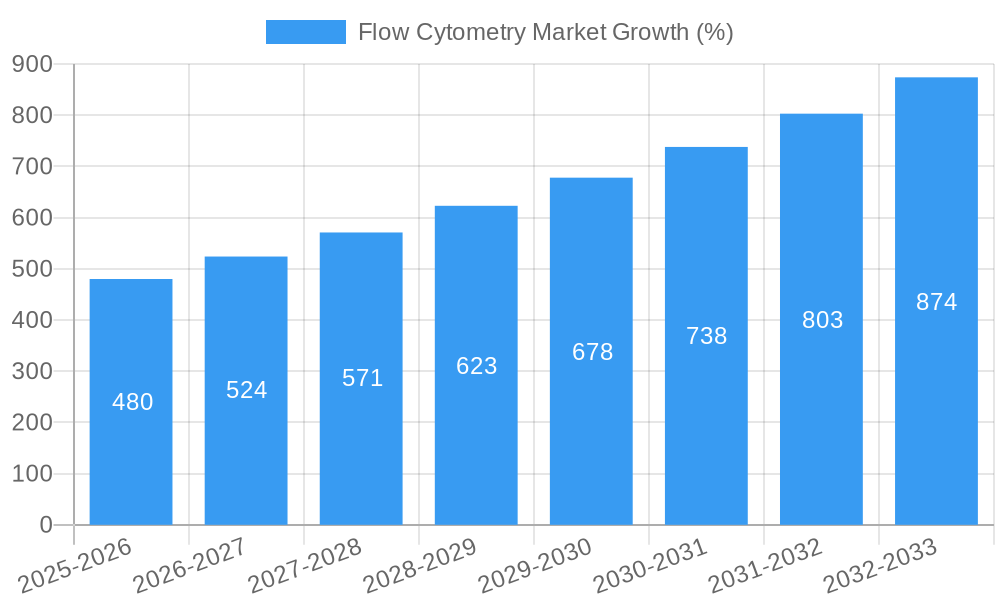
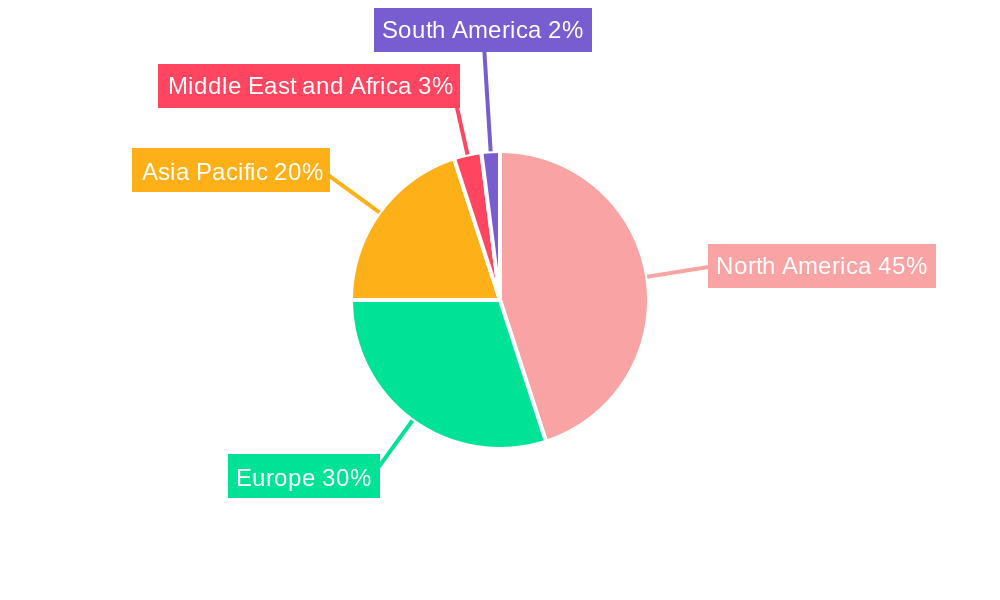
The global flow cytometry market, valued at $6.27 billion in 2025, is projected to experience robust growth, driven by a Compound Annual Growth Rate (CAGR) of 7.69% from 2025 to 2033. This expansion is fueled by several key factors. The increasing prevalence of chronic diseases like cancer and autoimmune disorders necessitates advanced diagnostic tools, significantly boosting demand for flow cytometry in clinical settings. Furthermore, the burgeoning field of immunotherapy and personalized medicine relies heavily on flow cytometry for cell characterization and monitoring treatment response, creating substantial market opportunities. Technological advancements, such as the development of high-throughput instruments and sophisticated software for data analysis, are further enhancing the efficiency and accuracy of flow cytometry, contributing to market growth. The strong research and development activities in academia and pharmaceutical companies are also driving demand for flow cytometers and related reagents and services. While the market faces some restraints, such as high instrument costs and the need for skilled personnel, the overall market outlook remains positive. Growth is expected across all segments, including cell-based and bead-based technologies, with applications spanning oncology, drug discovery, stem cell research, and immunology. Geographic growth will be particularly strong in rapidly developing economies of Asia-Pacific, driven by increasing healthcare infrastructure and investment in life sciences research.
The market segmentation reveals a diverse landscape. Hospitals and clinics constitute a significant end-user segment, followed by academia and research institutions. Among product types, instruments dominate the market share, followed by kits and reagents. The cell-based flow cytometry technology segment currently holds a larger market share compared to bead-based, but both are expected to experience growth driven by technological innovation. Major players like Becton Dickinson, Thermo Fisher Scientific, and Danaher Corporation (Beckman Coulter) are heavily invested in R&D and strategic acquisitions, aiming to consolidate their market positions. This competitive landscape further encourages innovation and drives the overall market growth. The forecast period indicates continued expansion, positioning flow cytometry as a crucial technology across various healthcare and research applications.
Flow Cytometry Market: A Comprehensive Report (2019-2033)
This comprehensive report provides a detailed analysis of the Flow Cytometry market, encompassing market dynamics, growth trends, regional segmentation, product landscape, key players, and future outlook. The study period covers 2019-2033, with a base year of 2025 and a forecast period of 2025-2033. The report utilizes extensive data and expert analysis to deliver actionable insights for industry professionals, investors, and researchers. The global flow cytometry market size is projected to reach xx Million by 2033.
Flow Cytometry Market Market Dynamics & Structure
The flow cytometry market is characterized by moderate concentration, with key players like Becton Dickinson and Company, Thermo Fisher Scientific Inc., and Danaher Corporation (Beckman Coulter Inc.) holding significant market share. Technological innovation, particularly in areas like cloud-based data analysis and high-throughput systems, is a key driver. Regulatory frameworks governing diagnostic applications and research use impact market growth. Competitive substitutes, such as microscopy techniques, exist but flow cytometry’s advantages in high-throughput analysis and multi-parameter data acquisition maintain its dominance. The market exhibits strong growth in the pharmaceutical and biotechnology sectors, fueled by drug discovery and development. M&A activity in the sector is moderate, with strategic acquisitions focusing on expanding product portfolios and technological capabilities. The historical period (2019-2024) saw a xx% CAGR, driven primarily by increasing demand from research and clinical diagnostics.
- Market Concentration: Moderately concentrated, with top 5 players holding approximately xx% market share in 2025.
- Technological Innovation: Cloud-based data analysis, high-throughput systems, and advancements in cell sorting technologies are key drivers.
- Regulatory Landscape: Stringent regulatory approvals for diagnostic applications influence market growth.
- Competitive Substitutes: Microscopy and other cell analysis techniques offer limited competition.
- M&A Activity: Moderate level of mergers and acquisitions, focusing on technology and product expansion.
- End-User Demographics: Strong growth in pharmaceutical and biotechnology sectors, followed by research institutes and hospitals.
Flow Cytometry Market Growth Trends & Insights
The flow cytometry market exhibits strong growth potential, driven by factors such as increasing prevalence of chronic diseases, rising demand for advanced diagnostic tools, and the growing adoption of personalized medicine. The market is witnessing a significant shift toward high-throughput systems and cloud-based data analysis solutions, streamlining workflows and improving efficiency. The adoption rate of flow cytometry technologies is increasing across various end-user segments, particularly in the pharmaceutical and biotechnology industries, where its application in drug discovery and development is rapidly expanding. This growth is further fueled by technological advancements, including increased sensitivity and specificity, miniaturization, and automation. Consumer behavior is shifting towards preference for integrated solutions offering comprehensive software and services alongside instruments and reagents. The market experienced a CAGR of xx% during the historical period (2019-2024) and is projected to maintain a CAGR of xx% during the forecast period (2025-2033). Market penetration in developing economies is also expected to increase significantly.
Dominant Regions, Countries, or Segments in Flow Cytometry Market
North America currently dominates the flow cytometry market, driven by strong research infrastructure, high healthcare expenditure, and the presence of major market players. However, Asia-Pacific is projected to witness the fastest growth rate during the forecast period, fueled by rising healthcare investments and increasing adoption in emerging economies.
By End-User: Pharmaceutical and Biotechnology Companies lead in market share, driven by high R&D spending. Hospitals and Clinics follow closely, driven by expanding diagnostics needs.
By Product Type: Instruments holds the largest market share, followed by kits and reagents. Software and services are experiencing rapid growth.
By Technology: Cell-based flow cytometry dominates the market, due to its established applications, but bead-based flow cytometry is growing rapidly.
By Application: Oncology is the dominant application, followed by drug discovery and immunology.
- North America: Strong market presence due to advanced healthcare infrastructure and high R&D spending.
- Europe: Mature market with steady growth driven by increasing diagnostic needs and research activities.
- Asia-Pacific: Fastest-growing region, driven by increasing healthcare expenditure and adoption in emerging economies.
- Hospitals and Clinics: High demand due to routine diagnostic testing.
- Pharmaceutical & Biotechnology: Significant investment in R&D fuels market growth.
- Instruments: Highest market share due to fundamental role in flow cytometry applications.
- Oncology: Largest application area due to prevalence of cancer and its diagnostic requirements.
Flow Cytometry Market Product Landscape
The flow cytometry product landscape is marked by continuous innovation in instrument design, software functionalities, and reagent development. High-throughput instruments with increased sensitivity and speed are being introduced, along with user-friendly software that simplifies data analysis. The focus is on integrating advanced functionalities, such as automation, multi-parameter analysis, and cloud connectivity, to enhance efficiency and data interpretation. Unique selling propositions include ease of use, high-throughput capabilities, and comprehensive software packages offering advanced analytical tools.
Key Drivers, Barriers & Challenges in Flow Cytometry Market
Key Drivers:
- Increasing prevalence of chronic diseases driving diagnostic needs.
- Growing demand for personalized medicine and advanced diagnostic tools.
- Technological advancements leading to higher throughput, sensitivity, and ease of use.
- Rising investments in R&D across pharmaceutical and biotechnology industries.
Key Barriers & Challenges:
- High initial cost of flow cytometers can restrict adoption in resource-constrained settings.
- Complex data analysis requiring specialized expertise can hinder widespread use.
- Stringent regulatory requirements for diagnostic applications can slow market penetration.
- Competition from other cell analysis techniques.
Emerging Opportunities in Flow Cytometry Market
- Expansion into untapped markets in developing countries.
- Development of point-of-care flow cytometry systems.
- Integration of artificial intelligence and machine learning for data analysis.
- Application in new therapeutic areas, such as immunotherapy and gene therapy.
Growth Accelerators in the Flow Cytometry Market Industry
Technological advancements such as the development of miniaturized and portable flow cytometers, cloud-based data analysis platforms, and the integration of AI for data interpretation are driving market expansion. Strategic partnerships between instrument manufacturers, reagent suppliers, and software developers are also accelerating growth. The increasing demand for high-throughput screening and automation is further fueling market expansion.
Key Players Shaping the Flow Cytometry Market Market
- Becton Dickinson and Company
- Enzo Biochem Inc (Enzo Life Sciences Inc)
- Miltenyi Biotech
- BioMerieux SA
- Bio-Rad Laboratories Inc
- Stratedigm Inc
- Sony Biotechnology Inc (Sony Corporation of America)
- Agilent Technologies Inc
- Sysmex Corporation
- Danaher corporation (Beckman Coulter Inc)
- Luminex Corporation
- ThermoFisher Scientific Inc
Notable Milestones in Flow Cytometry Market Sector
- September 2022: Becton, Dickinson, and Company released BD Research Cloud, a cloud-based software solution streamlining flow cytometry workflows.
- November 2022: Sony Corporation released SFA-Life Sciences Cloud Platform, a cloud-based solution for analyzing flow cytometry data, facilitating the identification of rare cells.
In-Depth Flow Cytometry Market Market Outlook
The flow cytometry market is poised for significant growth in the coming years, driven by continuous technological innovation, increasing demand from research and clinical settings, and expansion into emerging markets. Strategic partnerships and the development of integrated solutions offering comprehensive software and services alongside instruments and reagents will further accelerate growth. The market is expected to witness the emergence of novel applications and improved data analysis tools, creating substantial opportunities for market players.
Flow Cytometry Market Segmentation
-
1. Product Type
- 1.1. Instrument
- 1.2. Kit and Reagent
- 1.3. Software and Services
-
2. Technology
- 2.1. Cell-based Flow Cytometry
- 2.2. Bead-based Flow Cytometry
-
3. Application
- 3.1. Oncology
- 3.2. Drug Discovery
- 3.3. Stem Cell Therapy
- 3.4. Organ Transplantation
- 3.5. Hematology
- 3.6. Other Applications
-
4. End-User
- 4.1. Hospitals and Clinics
- 4.2. Academia and Research Institutes
- 4.3. Pharmaceutical and Biotechnology Companies
- 4.4. Other End-Users
Flow Cytometry Market Segmentation By Geography
-
1. North America
- 1.1. United States
- 1.2. Canada
- 1.3. Mexico
-
2. Europe
- 2.1. Germany
- 2.2. United Kingdom
- 2.3. France
- 2.4. Italy
- 2.5. Spain
- 2.6. Rest of Europe
-
3. Asia Pacific
- 3.1. China
- 3.2. Japan
- 3.3. India
- 3.4. Australia
- 3.5. South Korea
- 3.6. Rest of Asia Pacific
-
4. Middle East and Africa
- 4.1. GCC
- 4.2. South Africa
- 4.3. Rest of Middle East and Africa
-
5. South America
- 5.1. Brazil
- 5.2. Argentina
- 5.3. Rest of South America
Flow Cytometry Market REPORT HIGHLIGHTS
| Aspects | Details |
|---|---|
| Study Period | 2019-2033 |
| Base Year | 2024 |
| Estimated Year | 2025 |
| Forecast Period | 2025-2033 |
| Historical Period | 2019-2024 |
| Growth Rate | CAGR of 7.69% from 2019-2033 |
| Segmentation |
|
Table of Contents
- 1. Introduction
- 1.1. Research Scope
- 1.2. Market Segmentation
- 1.3. Research Methodology
- 1.4. Definitions and Assumptions
- 2. Executive Summary
- 2.1. Introduction
- 3. Market Dynamics
- 3.1. Introduction
- 3.2. Market Drivers
- 3.2.1. Growing Adoption of Flow Cytometry in Stem Cell Research; Increasing Applications of Flow Cytometry in Clinical Research
- 3.3. Market Restrains
- 3.3.1. Lack of Awareness about the Potential Benefits of Flow Cytometry Techniques; High Cost of the Equipment
- 3.4. Market Trends
- 3.4.1. Stem Cell Therapy Segment is Expected to Witness a Significant Growth Over the Forecast Period.
- 4. Market Factor Analysis
- 4.1. Porters Five Forces
- 4.2. Supply/Value Chain
- 4.3. PESTEL analysis
- 4.4. Market Entropy
- 4.5. Patent/Trademark Analysis
- 5. Global Flow Cytometry Market Analysis, Insights and Forecast, 2019-2031
- 5.1. Market Analysis, Insights and Forecast - by Product Type
- 5.1.1. Instrument
- 5.1.2. Kit and Reagent
- 5.1.3. Software and Services
- 5.2. Market Analysis, Insights and Forecast - by Technology
- 5.2.1. Cell-based Flow Cytometry
- 5.2.2. Bead-based Flow Cytometry
- 5.3. Market Analysis, Insights and Forecast - by Application
- 5.3.1. Oncology
- 5.3.2. Drug Discovery
- 5.3.3. Stem Cell Therapy
- 5.3.4. Organ Transplantation
- 5.3.5. Hematology
- 5.3.6. Other Applications
- 5.4. Market Analysis, Insights and Forecast - by End-User
- 5.4.1. Hospitals and Clinics
- 5.4.2. Academia and Research Institutes
- 5.4.3. Pharmaceutical and Biotechnology Companies
- 5.4.4. Other End-Users
- 5.5. Market Analysis, Insights and Forecast - by Region
- 5.5.1. North America
- 5.5.2. Europe
- 5.5.3. Asia Pacific
- 5.5.4. Middle East and Africa
- 5.5.5. South America
- 5.1. Market Analysis, Insights and Forecast - by Product Type
- 6. North America Flow Cytometry Market Analysis, Insights and Forecast, 2019-2031
- 6.1. Market Analysis, Insights and Forecast - by Product Type
- 6.1.1. Instrument
- 6.1.2. Kit and Reagent
- 6.1.3. Software and Services
- 6.2. Market Analysis, Insights and Forecast - by Technology
- 6.2.1. Cell-based Flow Cytometry
- 6.2.2. Bead-based Flow Cytometry
- 6.3. Market Analysis, Insights and Forecast - by Application
- 6.3.1. Oncology
- 6.3.2. Drug Discovery
- 6.3.3. Stem Cell Therapy
- 6.3.4. Organ Transplantation
- 6.3.5. Hematology
- 6.3.6. Other Applications
- 6.4. Market Analysis, Insights and Forecast - by End-User
- 6.4.1. Hospitals and Clinics
- 6.4.2. Academia and Research Institutes
- 6.4.3. Pharmaceutical and Biotechnology Companies
- 6.4.4. Other End-Users
- 6.1. Market Analysis, Insights and Forecast - by Product Type
- 7. Europe Flow Cytometry Market Analysis, Insights and Forecast, 2019-2031
- 7.1. Market Analysis, Insights and Forecast - by Product Type
- 7.1.1. Instrument
- 7.1.2. Kit and Reagent
- 7.1.3. Software and Services
- 7.2. Market Analysis, Insights and Forecast - by Technology
- 7.2.1. Cell-based Flow Cytometry
- 7.2.2. Bead-based Flow Cytometry
- 7.3. Market Analysis, Insights and Forecast - by Application
- 7.3.1. Oncology
- 7.3.2. Drug Discovery
- 7.3.3. Stem Cell Therapy
- 7.3.4. Organ Transplantation
- 7.3.5. Hematology
- 7.3.6. Other Applications
- 7.4. Market Analysis, Insights and Forecast - by End-User
- 7.4.1. Hospitals and Clinics
- 7.4.2. Academia and Research Institutes
- 7.4.3. Pharmaceutical and Biotechnology Companies
- 7.4.4. Other End-Users
- 7.1. Market Analysis, Insights and Forecast - by Product Type
- 8. Asia Pacific Flow Cytometry Market Analysis, Insights and Forecast, 2019-2031
- 8.1. Market Analysis, Insights and Forecast - by Product Type
- 8.1.1. Instrument
- 8.1.2. Kit and Reagent
- 8.1.3. Software and Services
- 8.2. Market Analysis, Insights and Forecast - by Technology
- 8.2.1. Cell-based Flow Cytometry
- 8.2.2. Bead-based Flow Cytometry
- 8.3. Market Analysis, Insights and Forecast - by Application
- 8.3.1. Oncology
- 8.3.2. Drug Discovery
- 8.3.3. Stem Cell Therapy
- 8.3.4. Organ Transplantation
- 8.3.5. Hematology
- 8.3.6. Other Applications
- 8.4. Market Analysis, Insights and Forecast - by End-User
- 8.4.1. Hospitals and Clinics
- 8.4.2. Academia and Research Institutes
- 8.4.3. Pharmaceutical and Biotechnology Companies
- 8.4.4. Other End-Users
- 8.1. Market Analysis, Insights and Forecast - by Product Type
- 9. Middle East and Africa Flow Cytometry Market Analysis, Insights and Forecast, 2019-2031
- 9.1. Market Analysis, Insights and Forecast - by Product Type
- 9.1.1. Instrument
- 9.1.2. Kit and Reagent
- 9.1.3. Software and Services
- 9.2. Market Analysis, Insights and Forecast - by Technology
- 9.2.1. Cell-based Flow Cytometry
- 9.2.2. Bead-based Flow Cytometry
- 9.3. Market Analysis, Insights and Forecast - by Application
- 9.3.1. Oncology
- 9.3.2. Drug Discovery
- 9.3.3. Stem Cell Therapy
- 9.3.4. Organ Transplantation
- 9.3.5. Hematology
- 9.3.6. Other Applications
- 9.4. Market Analysis, Insights and Forecast - by End-User
- 9.4.1. Hospitals and Clinics
- 9.4.2. Academia and Research Institutes
- 9.4.3. Pharmaceutical and Biotechnology Companies
- 9.4.4. Other End-Users
- 9.1. Market Analysis, Insights and Forecast - by Product Type
- 10. South America Flow Cytometry Market Analysis, Insights and Forecast, 2019-2031
- 10.1. Market Analysis, Insights and Forecast - by Product Type
- 10.1.1. Instrument
- 10.1.2. Kit and Reagent
- 10.1.3. Software and Services
- 10.2. Market Analysis, Insights and Forecast - by Technology
- 10.2.1. Cell-based Flow Cytometry
- 10.2.2. Bead-based Flow Cytometry
- 10.3. Market Analysis, Insights and Forecast - by Application
- 10.3.1. Oncology
- 10.3.2. Drug Discovery
- 10.3.3. Stem Cell Therapy
- 10.3.4. Organ Transplantation
- 10.3.5. Hematology
- 10.3.6. Other Applications
- 10.4. Market Analysis, Insights and Forecast - by End-User
- 10.4.1. Hospitals and Clinics
- 10.4.2. Academia and Research Institutes
- 10.4.3. Pharmaceutical and Biotechnology Companies
- 10.4.4. Other End-Users
- 10.1. Market Analysis, Insights and Forecast - by Product Type
- 11. North America Flow Cytometry Market Analysis, Insights and Forecast, 2019-2031
- 11.1. Market Analysis, Insights and Forecast - By Country/Sub-region
- 11.1.1 United States
- 11.1.2 Canada
- 11.1.3 Mexico
- 12. Europe Flow Cytometry Market Analysis, Insights and Forecast, 2019-2031
- 12.1. Market Analysis, Insights and Forecast - By Country/Sub-region
- 12.1.1 Germany
- 12.1.2 United Kingdom
- 12.1.3 France
- 12.1.4 Italy
- 12.1.5 Spain
- 12.1.6 Rest of Europe
- 13. Asia Pacific Flow Cytometry Market Analysis, Insights and Forecast, 2019-2031
- 13.1. Market Analysis, Insights and Forecast - By Country/Sub-region
- 13.1.1 China
- 13.1.2 Japan
- 13.1.3 India
- 13.1.4 Australia
- 13.1.5 South Korea
- 13.1.6 Rest of Asia Pacific
- 14. Middle East and Africa Flow Cytometry Market Analysis, Insights and Forecast, 2019-2031
- 14.1. Market Analysis, Insights and Forecast - By Country/Sub-region
- 14.1.1 GCC
- 14.1.2 South Africa
- 14.1.3 Rest of Middle East and Africa
- 15. South America Flow Cytometry Market Analysis, Insights and Forecast, 2019-2031
- 15.1. Market Analysis, Insights and Forecast - By Country/Sub-region
- 15.1.1 Brazil
- 15.1.2 Argentina
- 15.1.3 Rest of South America
- 16. Competitive Analysis
- 16.1. Global Market Share Analysis 2024
- 16.2. Company Profiles
- 16.2.1 Becton Dickinson and Company
- 16.2.1.1. Overview
- 16.2.1.2. Products
- 16.2.1.3. SWOT Analysis
- 16.2.1.4. Recent Developments
- 16.2.1.5. Financials (Based on Availability)
- 16.2.2 Enzo Biochem Inc (Enzo Life Sciences Inc )*List Not Exhaustive
- 16.2.2.1. Overview
- 16.2.2.2. Products
- 16.2.2.3. SWOT Analysis
- 16.2.2.4. Recent Developments
- 16.2.2.5. Financials (Based on Availability)
- 16.2.3 Miltenyi Biotech
- 16.2.3.1. Overview
- 16.2.3.2. Products
- 16.2.3.3. SWOT Analysis
- 16.2.3.4. Recent Developments
- 16.2.3.5. Financials (Based on Availability)
- 16.2.4 BioMerieux SA
- 16.2.4.1. Overview
- 16.2.4.2. Products
- 16.2.4.3. SWOT Analysis
- 16.2.4.4. Recent Developments
- 16.2.4.5. Financials (Based on Availability)
- 16.2.5 Bio-Rad Laboratories Inc
- 16.2.5.1. Overview
- 16.2.5.2. Products
- 16.2.5.3. SWOT Analysis
- 16.2.5.4. Recent Developments
- 16.2.5.5. Financials (Based on Availability)
- 16.2.6 Stratedigm Inc
- 16.2.6.1. Overview
- 16.2.6.2. Products
- 16.2.6.3. SWOT Analysis
- 16.2.6.4. Recent Developments
- 16.2.6.5. Financials (Based on Availability)
- 16.2.7 Sony Biotechnology Inc (Sony Corporation of America)
- 16.2.7.1. Overview
- 16.2.7.2. Products
- 16.2.7.3. SWOT Analysis
- 16.2.7.4. Recent Developments
- 16.2.7.5. Financials (Based on Availability)
- 16.2.8 Agilent Technologies Inc
- 16.2.8.1. Overview
- 16.2.8.2. Products
- 16.2.8.3. SWOT Analysis
- 16.2.8.4. Recent Developments
- 16.2.8.5. Financials (Based on Availability)
- 16.2.9 Sysmex Corporation
- 16.2.9.1. Overview
- 16.2.9.2. Products
- 16.2.9.3. SWOT Analysis
- 16.2.9.4. Recent Developments
- 16.2.9.5. Financials (Based on Availability)
- 16.2.10 Danaher corporation (Beckman Coulter Inc )
- 16.2.10.1. Overview
- 16.2.10.2. Products
- 16.2.10.3. SWOT Analysis
- 16.2.10.4. Recent Developments
- 16.2.10.5. Financials (Based on Availability)
- 16.2.11 Luminex Corporation
- 16.2.11.1. Overview
- 16.2.11.2. Products
- 16.2.11.3. SWOT Analysis
- 16.2.11.4. Recent Developments
- 16.2.11.5. Financials (Based on Availability)
- 16.2.12 ThermoFisher Scientific Inc
- 16.2.12.1. Overview
- 16.2.12.2. Products
- 16.2.12.3. SWOT Analysis
- 16.2.12.4. Recent Developments
- 16.2.12.5. Financials (Based on Availability)
- 16.2.1 Becton Dickinson and Company
List of Figures
- Figure 1: Global Flow Cytometry Market Revenue Breakdown (Million, %) by Region 2024 & 2032
- Figure 2: North America Flow Cytometry Market Revenue (Million), by Country 2024 & 2032
- Figure 3: North America Flow Cytometry Market Revenue Share (%), by Country 2024 & 2032
- Figure 4: Europe Flow Cytometry Market Revenue (Million), by Country 2024 & 2032
- Figure 5: Europe Flow Cytometry Market Revenue Share (%), by Country 2024 & 2032
- Figure 6: Asia Pacific Flow Cytometry Market Revenue (Million), by Country 2024 & 2032
- Figure 7: Asia Pacific Flow Cytometry Market Revenue Share (%), by Country 2024 & 2032
- Figure 8: Middle East and Africa Flow Cytometry Market Revenue (Million), by Country 2024 & 2032
- Figure 9: Middle East and Africa Flow Cytometry Market Revenue Share (%), by Country 2024 & 2032
- Figure 10: South America Flow Cytometry Market Revenue (Million), by Country 2024 & 2032
- Figure 11: South America Flow Cytometry Market Revenue Share (%), by Country 2024 & 2032
- Figure 12: North America Flow Cytometry Market Revenue (Million), by Product Type 2024 & 2032
- Figure 13: North America Flow Cytometry Market Revenue Share (%), by Product Type 2024 & 2032
- Figure 14: North America Flow Cytometry Market Revenue (Million), by Technology 2024 & 2032
- Figure 15: North America Flow Cytometry Market Revenue Share (%), by Technology 2024 & 2032
- Figure 16: North America Flow Cytometry Market Revenue (Million), by Application 2024 & 2032
- Figure 17: North America Flow Cytometry Market Revenue Share (%), by Application 2024 & 2032
- Figure 18: North America Flow Cytometry Market Revenue (Million), by End-User 2024 & 2032
- Figure 19: North America Flow Cytometry Market Revenue Share (%), by End-User 2024 & 2032
- Figure 20: North America Flow Cytometry Market Revenue (Million), by Country 2024 & 2032
- Figure 21: North America Flow Cytometry Market Revenue Share (%), by Country 2024 & 2032
- Figure 22: Europe Flow Cytometry Market Revenue (Million), by Product Type 2024 & 2032
- Figure 23: Europe Flow Cytometry Market Revenue Share (%), by Product Type 2024 & 2032
- Figure 24: Europe Flow Cytometry Market Revenue (Million), by Technology 2024 & 2032
- Figure 25: Europe Flow Cytometry Market Revenue Share (%), by Technology 2024 & 2032
- Figure 26: Europe Flow Cytometry Market Revenue (Million), by Application 2024 & 2032
- Figure 27: Europe Flow Cytometry Market Revenue Share (%), by Application 2024 & 2032
- Figure 28: Europe Flow Cytometry Market Revenue (Million), by End-User 2024 & 2032
- Figure 29: Europe Flow Cytometry Market Revenue Share (%), by End-User 2024 & 2032
- Figure 30: Europe Flow Cytometry Market Revenue (Million), by Country 2024 & 2032
- Figure 31: Europe Flow Cytometry Market Revenue Share (%), by Country 2024 & 2032
- Figure 32: Asia Pacific Flow Cytometry Market Revenue (Million), by Product Type 2024 & 2032
- Figure 33: Asia Pacific Flow Cytometry Market Revenue Share (%), by Product Type 2024 & 2032
- Figure 34: Asia Pacific Flow Cytometry Market Revenue (Million), by Technology 2024 & 2032
- Figure 35: Asia Pacific Flow Cytometry Market Revenue Share (%), by Technology 2024 & 2032
- Figure 36: Asia Pacific Flow Cytometry Market Revenue (Million), by Application 2024 & 2032
- Figure 37: Asia Pacific Flow Cytometry Market Revenue Share (%), by Application 2024 & 2032
- Figure 38: Asia Pacific Flow Cytometry Market Revenue (Million), by End-User 2024 & 2032
- Figure 39: Asia Pacific Flow Cytometry Market Revenue Share (%), by End-User 2024 & 2032
- Figure 40: Asia Pacific Flow Cytometry Market Revenue (Million), by Country 2024 & 2032
- Figure 41: Asia Pacific Flow Cytometry Market Revenue Share (%), by Country 2024 & 2032
- Figure 42: Middle East and Africa Flow Cytometry Market Revenue (Million), by Product Type 2024 & 2032
- Figure 43: Middle East and Africa Flow Cytometry Market Revenue Share (%), by Product Type 2024 & 2032
- Figure 44: Middle East and Africa Flow Cytometry Market Revenue (Million), by Technology 2024 & 2032
- Figure 45: Middle East and Africa Flow Cytometry Market Revenue Share (%), by Technology 2024 & 2032
- Figure 46: Middle East and Africa Flow Cytometry Market Revenue (Million), by Application 2024 & 2032
- Figure 47: Middle East and Africa Flow Cytometry Market Revenue Share (%), by Application 2024 & 2032
- Figure 48: Middle East and Africa Flow Cytometry Market Revenue (Million), by End-User 2024 & 2032
- Figure 49: Middle East and Africa Flow Cytometry Market Revenue Share (%), by End-User 2024 & 2032
- Figure 50: Middle East and Africa Flow Cytometry Market Revenue (Million), by Country 2024 & 2032
- Figure 51: Middle East and Africa Flow Cytometry Market Revenue Share (%), by Country 2024 & 2032
- Figure 52: South America Flow Cytometry Market Revenue (Million), by Product Type 2024 & 2032
- Figure 53: South America Flow Cytometry Market Revenue Share (%), by Product Type 2024 & 2032
- Figure 54: South America Flow Cytometry Market Revenue (Million), by Technology 2024 & 2032
- Figure 55: South America Flow Cytometry Market Revenue Share (%), by Technology 2024 & 2032
- Figure 56: South America Flow Cytometry Market Revenue (Million), by Application 2024 & 2032
- Figure 57: South America Flow Cytometry Market Revenue Share (%), by Application 2024 & 2032
- Figure 58: South America Flow Cytometry Market Revenue (Million), by End-User 2024 & 2032
- Figure 59: South America Flow Cytometry Market Revenue Share (%), by End-User 2024 & 2032
- Figure 60: South America Flow Cytometry Market Revenue (Million), by Country 2024 & 2032
- Figure 61: South America Flow Cytometry Market Revenue Share (%), by Country 2024 & 2032
List of Tables
- Table 1: Global Flow Cytometry Market Revenue Million Forecast, by Region 2019 & 2032
- Table 2: Global Flow Cytometry Market Revenue Million Forecast, by Product Type 2019 & 2032
- Table 3: Global Flow Cytometry Market Revenue Million Forecast, by Technology 2019 & 2032
- Table 4: Global Flow Cytometry Market Revenue Million Forecast, by Application 2019 & 2032
- Table 5: Global Flow Cytometry Market Revenue Million Forecast, by End-User 2019 & 2032
- Table 6: Global Flow Cytometry Market Revenue Million Forecast, by Region 2019 & 2032
- Table 7: Global Flow Cytometry Market Revenue Million Forecast, by Country 2019 & 2032
- Table 8: United States Flow Cytometry Market Revenue (Million) Forecast, by Application 2019 & 2032
- Table 9: Canada Flow Cytometry Market Revenue (Million) Forecast, by Application 2019 & 2032
- Table 10: Mexico Flow Cytometry Market Revenue (Million) Forecast, by Application 2019 & 2032
- Table 11: Global Flow Cytometry Market Revenue Million Forecast, by Country 2019 & 2032
- Table 12: Germany Flow Cytometry Market Revenue (Million) Forecast, by Application 2019 & 2032
- Table 13: United Kingdom Flow Cytometry Market Revenue (Million) Forecast, by Application 2019 & 2032
- Table 14: France Flow Cytometry Market Revenue (Million) Forecast, by Application 2019 & 2032
- Table 15: Italy Flow Cytometry Market Revenue (Million) Forecast, by Application 2019 & 2032
- Table 16: Spain Flow Cytometry Market Revenue (Million) Forecast, by Application 2019 & 2032
- Table 17: Rest of Europe Flow Cytometry Market Revenue (Million) Forecast, by Application 2019 & 2032
- Table 18: Global Flow Cytometry Market Revenue Million Forecast, by Country 2019 & 2032
- Table 19: China Flow Cytometry Market Revenue (Million) Forecast, by Application 2019 & 2032
- Table 20: Japan Flow Cytometry Market Revenue (Million) Forecast, by Application 2019 & 2032
- Table 21: India Flow Cytometry Market Revenue (Million) Forecast, by Application 2019 & 2032
- Table 22: Australia Flow Cytometry Market Revenue (Million) Forecast, by Application 2019 & 2032
- Table 23: South Korea Flow Cytometry Market Revenue (Million) Forecast, by Application 2019 & 2032
- Table 24: Rest of Asia Pacific Flow Cytometry Market Revenue (Million) Forecast, by Application 2019 & 2032
- Table 25: Global Flow Cytometry Market Revenue Million Forecast, by Country 2019 & 2032
- Table 26: GCC Flow Cytometry Market Revenue (Million) Forecast, by Application 2019 & 2032
- Table 27: South Africa Flow Cytometry Market Revenue (Million) Forecast, by Application 2019 & 2032
- Table 28: Rest of Middle East and Africa Flow Cytometry Market Revenue (Million) Forecast, by Application 2019 & 2032
- Table 29: Global Flow Cytometry Market Revenue Million Forecast, by Country 2019 & 2032
- Table 30: Brazil Flow Cytometry Market Revenue (Million) Forecast, by Application 2019 & 2032
- Table 31: Argentina Flow Cytometry Market Revenue (Million) Forecast, by Application 2019 & 2032
- Table 32: Rest of South America Flow Cytometry Market Revenue (Million) Forecast, by Application 2019 & 2032
- Table 33: Global Flow Cytometry Market Revenue Million Forecast, by Product Type 2019 & 2032
- Table 34: Global Flow Cytometry Market Revenue Million Forecast, by Technology 2019 & 2032
- Table 35: Global Flow Cytometry Market Revenue Million Forecast, by Application 2019 & 2032
- Table 36: Global Flow Cytometry Market Revenue Million Forecast, by End-User 2019 & 2032
- Table 37: Global Flow Cytometry Market Revenue Million Forecast, by Country 2019 & 2032
- Table 38: United States Flow Cytometry Market Revenue (Million) Forecast, by Application 2019 & 2032
- Table 39: Canada Flow Cytometry Market Revenue (Million) Forecast, by Application 2019 & 2032
- Table 40: Mexico Flow Cytometry Market Revenue (Million) Forecast, by Application 2019 & 2032
- Table 41: Global Flow Cytometry Market Revenue Million Forecast, by Product Type 2019 & 2032
- Table 42: Global Flow Cytometry Market Revenue Million Forecast, by Technology 2019 & 2032
- Table 43: Global Flow Cytometry Market Revenue Million Forecast, by Application 2019 & 2032
- Table 44: Global Flow Cytometry Market Revenue Million Forecast, by End-User 2019 & 2032
- Table 45: Global Flow Cytometry Market Revenue Million Forecast, by Country 2019 & 2032
- Table 46: Germany Flow Cytometry Market Revenue (Million) Forecast, by Application 2019 & 2032
- Table 47: United Kingdom Flow Cytometry Market Revenue (Million) Forecast, by Application 2019 & 2032
- Table 48: France Flow Cytometry Market Revenue (Million) Forecast, by Application 2019 & 2032
- Table 49: Italy Flow Cytometry Market Revenue (Million) Forecast, by Application 2019 & 2032
- Table 50: Spain Flow Cytometry Market Revenue (Million) Forecast, by Application 2019 & 2032
- Table 51: Rest of Europe Flow Cytometry Market Revenue (Million) Forecast, by Application 2019 & 2032
- Table 52: Global Flow Cytometry Market Revenue Million Forecast, by Product Type 2019 & 2032
- Table 53: Global Flow Cytometry Market Revenue Million Forecast, by Technology 2019 & 2032
- Table 54: Global Flow Cytometry Market Revenue Million Forecast, by Application 2019 & 2032
- Table 55: Global Flow Cytometry Market Revenue Million Forecast, by End-User 2019 & 2032
- Table 56: Global Flow Cytometry Market Revenue Million Forecast, by Country 2019 & 2032
- Table 57: China Flow Cytometry Market Revenue (Million) Forecast, by Application 2019 & 2032
- Table 58: Japan Flow Cytometry Market Revenue (Million) Forecast, by Application 2019 & 2032
- Table 59: India Flow Cytometry Market Revenue (Million) Forecast, by Application 2019 & 2032
- Table 60: Australia Flow Cytometry Market Revenue (Million) Forecast, by Application 2019 & 2032
- Table 61: South Korea Flow Cytometry Market Revenue (Million) Forecast, by Application 2019 & 2032
- Table 62: Rest of Asia Pacific Flow Cytometry Market Revenue (Million) Forecast, by Application 2019 & 2032
- Table 63: Global Flow Cytometry Market Revenue Million Forecast, by Product Type 2019 & 2032
- Table 64: Global Flow Cytometry Market Revenue Million Forecast, by Technology 2019 & 2032
- Table 65: Global Flow Cytometry Market Revenue Million Forecast, by Application 2019 & 2032
- Table 66: Global Flow Cytometry Market Revenue Million Forecast, by End-User 2019 & 2032
- Table 67: Global Flow Cytometry Market Revenue Million Forecast, by Country 2019 & 2032
- Table 68: GCC Flow Cytometry Market Revenue (Million) Forecast, by Application 2019 & 2032
- Table 69: South Africa Flow Cytometry Market Revenue (Million) Forecast, by Application 2019 & 2032
- Table 70: Rest of Middle East and Africa Flow Cytometry Market Revenue (Million) Forecast, by Application 2019 & 2032
- Table 71: Global Flow Cytometry Market Revenue Million Forecast, by Product Type 2019 & 2032
- Table 72: Global Flow Cytometry Market Revenue Million Forecast, by Technology 2019 & 2032
- Table 73: Global Flow Cytometry Market Revenue Million Forecast, by Application 2019 & 2032
- Table 74: Global Flow Cytometry Market Revenue Million Forecast, by End-User 2019 & 2032
- Table 75: Global Flow Cytometry Market Revenue Million Forecast, by Country 2019 & 2032
- Table 76: Brazil Flow Cytometry Market Revenue (Million) Forecast, by Application 2019 & 2032
- Table 77: Argentina Flow Cytometry Market Revenue (Million) Forecast, by Application 2019 & 2032
- Table 78: Rest of South America Flow Cytometry Market Revenue (Million) Forecast, by Application 2019 & 2032
Frequently Asked Questions
1. What is the projected Compound Annual Growth Rate (CAGR) of the Flow Cytometry Market?
The projected CAGR is approximately 7.69%.
2. Which companies are prominent players in the Flow Cytometry Market?
Key companies in the market include Becton Dickinson and Company, Enzo Biochem Inc (Enzo Life Sciences Inc )*List Not Exhaustive, Miltenyi Biotech, BioMerieux SA, Bio-Rad Laboratories Inc, Stratedigm Inc, Sony Biotechnology Inc (Sony Corporation of America), Agilent Technologies Inc, Sysmex Corporation, Danaher corporation (Beckman Coulter Inc ), Luminex Corporation, ThermoFisher Scientific Inc.
3. What are the main segments of the Flow Cytometry Market?
The market segments include Product Type, Technology, Application, End-User.
4. Can you provide details about the market size?
The market size is estimated to be USD 6.27 Million as of 2022.
5. What are some drivers contributing to market growth?
Growing Adoption of Flow Cytometry in Stem Cell Research; Increasing Applications of Flow Cytometry in Clinical Research.
6. What are the notable trends driving market growth?
Stem Cell Therapy Segment is Expected to Witness a Significant Growth Over the Forecast Period..
7. Are there any restraints impacting market growth?
Lack of Awareness about the Potential Benefits of Flow Cytometry Techniques; High Cost of the Equipment.
8. Can you provide examples of recent developments in the market?
November 2022: Sony Corporation released SFA-Life Sciences Cloud Platform, a cloud-based solution for analyzing flow cytometry data that makes it easy to find rare cells like cancer cells and stem cells in a large number of cell populations. The solution uses data from flow cytometers to do this.
9. What pricing options are available for accessing the report?
Pricing options include single-user, multi-user, and enterprise licenses priced at USD 4750, USD 5250, and USD 8750 respectively.
10. Is the market size provided in terms of value or volume?
The market size is provided in terms of value, measured in Million.
11. Are there any specific market keywords associated with the report?
Yes, the market keyword associated with the report is "Flow Cytometry Market," which aids in identifying and referencing the specific market segment covered.
12. How do I determine which pricing option suits my needs best?
The pricing options vary based on user requirements and access needs. Individual users may opt for single-user licenses, while businesses requiring broader access may choose multi-user or enterprise licenses for cost-effective access to the report.
13. Are there any additional resources or data provided in the Flow Cytometry Market report?
While the report offers comprehensive insights, it's advisable to review the specific contents or supplementary materials provided to ascertain if additional resources or data are available.
14. How can I stay updated on further developments or reports in the Flow Cytometry Market?
To stay informed about further developments, trends, and reports in the Flow Cytometry Market, consider subscribing to industry newsletters, following relevant companies and organizations, or regularly checking reputable industry news sources and publications.
Methodology
Step 1 - Identification of Relevant Samples Size from Population Database


Step 2 - Approaches for Defining Global Market Size (Value, Volume* & Price*)

Note*: In applicable scenarios
Step 3 - Data Sources
Primary Research
- Web Analytics
- Survey Reports
- Research Institute
- Latest Research Reports
- Opinion Leaders
Secondary Research
- Annual Reports
- White Paper
- Latest Press Release
- Industry Association
- Paid Database
- Investor Presentations

Step 4 - Data Triangulation
Involves using different sources of information in order to increase the validity of a study
These sources are likely to be stakeholders in a program - participants, other researchers, program staff, other community members, and so on.
Then we put all data in single framework & apply various statistical tools to find out the dynamic on the market.
During the analysis stage, feedback from the stakeholder groups would be compared to determine areas of agreement as well as areas of divergence
