

Key Insights
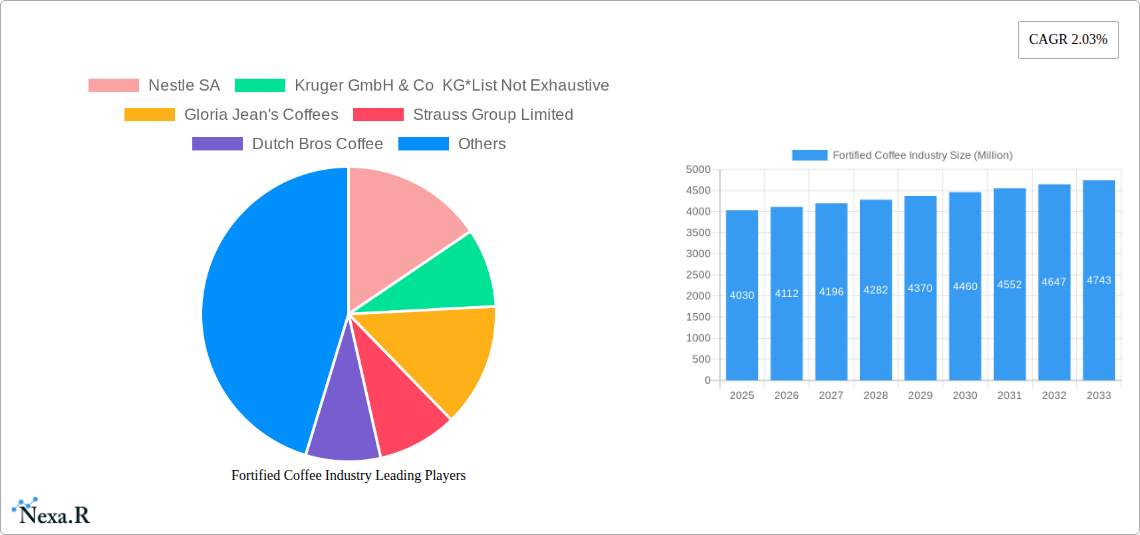
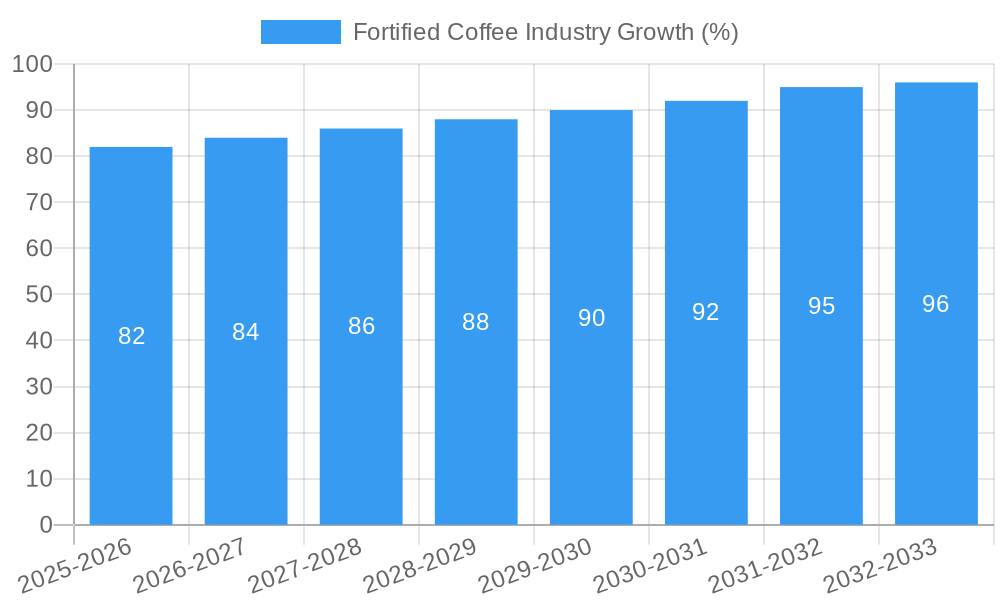
The fortified coffee market, valued at $4.03 billion in 2025, is projected to experience steady growth, driven by increasing consumer awareness of health and wellness. The Compound Annual Growth Rate (CAGR) of 2.03% indicates a consistent, albeit moderate, expansion over the forecast period (2025-2033). Key drivers include the rising demand for functional beverages offering both caffeine and added nutritional benefits, such as vitamins, minerals, and antioxidants. Consumers are increasingly seeking convenient ways to boost their daily nutrient intake, making fortified coffee an attractive option. Furthermore, the growing popularity of plant-based milks and alternative coffee options presents opportunities for innovation within this market segment. The market is segmented by product type (whole bean, ground, ready-to-drink), and distribution channels (supermarkets, cafes, convenience stores, online). The ready-to-drink segment is likely to experience faster growth due to convenience, while online channels will see increasing penetration as e-commerce expands. While the market faces potential restraints from fluctuating coffee bean prices and stringent regulatory requirements for food fortification, the overall outlook remains positive, driven by the ongoing consumer preference for healthier, functional beverages. Major players like Nestle, Starbucks, and smaller specialized brands contribute to product diversification and market competition. Geographic expansion, particularly in developing economies with rising disposable incomes, will further fuel market growth.
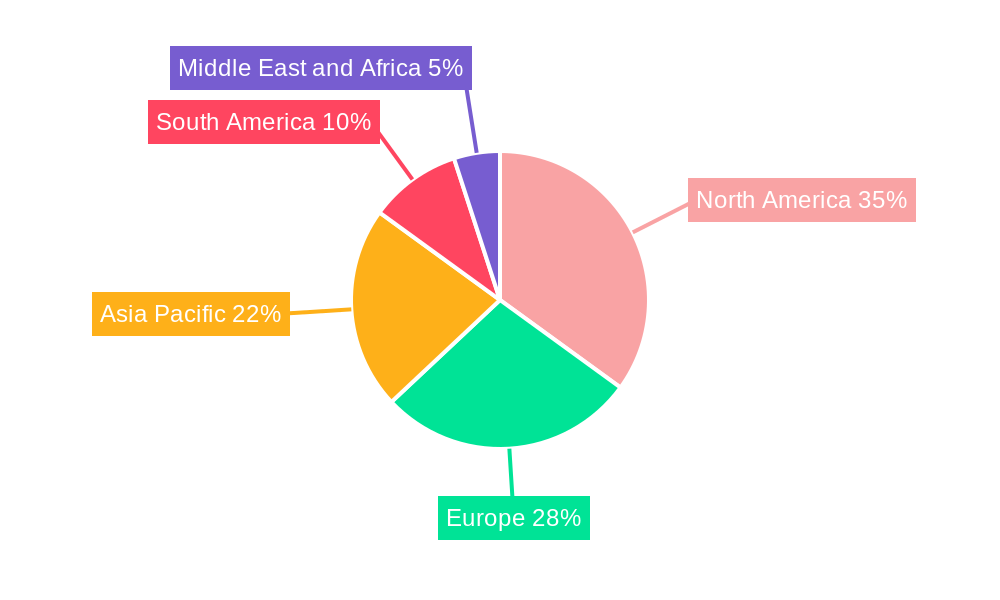
The geographical distribution of the fortified coffee market is expected to mirror global coffee consumption patterns. North America and Europe are likely to maintain significant market share, with steady growth expected in the Asia-Pacific region due to increasing coffee consumption and health consciousness. South America and the Middle East and Africa also present opportunities, although market penetration may vary due to factors like purchasing power and cultural preferences. Competitive strategies among major players will center on product differentiation, brand building, and expanding distribution networks. Innovation in flavors, ingredients, and packaging will be critical for attracting and retaining consumers in a competitive market. The continued focus on sustainability and ethical sourcing of coffee beans will also play a key role in shaping consumer preferences and brand loyalty in the fortified coffee market.
Fortified Coffee Industry Market Report: 2019-2033
This comprehensive report provides a detailed analysis of the Fortified Coffee industry, covering market dynamics, growth trends, key players, and future outlook from 2019 to 2033. The report is essential for industry professionals, investors, and anyone seeking to understand this rapidly evolving market segment. It utilizes data from the historical period (2019-2024), base year (2025), and forecast period (2025-2033), with 2025 as the estimated year. Market values are presented in millions of units.
Fortified Coffee Industry Market Dynamics & Structure
This section analyzes the Fortified Coffee market's competitive landscape, technological advancements, regulatory environment, and consumer trends. We examine market concentration, identifying key players and their market share. The impact of mergers and acquisitions (M&A) activity on market consolidation is also explored.
- Market Concentration: The Fortified Coffee market exhibits a moderately concentrated structure, with several large players holding significant market shares (Nestle SA, Starbucks Corporation, etc.), while smaller niche players cater to specific consumer segments. xx% of the market is controlled by the top 5 players in 2025.
- Technological Innovation: Technological advancements in fortification methods, packaging, and distribution channels are driving product innovation and expansion into new segments. For example, the development of more efficient and cost-effective fortification techniques is enhancing the profitability of fortified coffee products.
- Regulatory Landscape: Government regulations concerning food labeling, health claims, and ingredient sourcing significantly impact the Fortified Coffee market. Compliance costs vary by region, posing challenges to smaller companies.
- Competitive Substitutes: Other functional beverages (e.g., energy drinks, protein shakes) and traditional coffee compete with fortified coffee. The report analyses the competitive intensity and the fortified coffee's unique value proposition.
- End-User Demographics: The primary target demographic for fortified coffee comprises health-conscious consumers, athletes, and individuals seeking functional benefits beyond caffeine. Specific demographic insights are analyzed in detail within the report.
- M&A Activity: The number of M&A deals in the Fortified Coffee industry from 2019 to 2024 reached xx, indicating consolidation and expansion strategies by major players.
Fortified Coffee Industry Growth Trends & Insights
This section offers a detailed analysis of the Fortified Coffee market's growth trajectory using comprehensive market data. The report assesses market size evolution, adoption rates across various segments, and the impact of technological disruptions on market dynamics.
(600-word analysis of market size evolution (historical and projected), adoption rates, technological disruptions (e.g., innovations in fortification techniques, sustainable packaging), consumer behavior shifts (e.g., increasing demand for functional foods and beverages), CAGR, market penetration. Specific data points and quantifiable insights will be presented here.)
Dominant Regions, Countries, or Segments in Fortified Coffee Industry
This section identifies the leading regions, countries, and segments within the Fortified Coffee market, analyzing their growth drivers and market dominance.
- Product Type: The RTD (Ready-to-Drink) coffee segment is projected to experience the highest growth due to its convenience and increasing demand for on-the-go consumption options. Ground coffee continues to hold a significant market share, while whole bean coffee appeals to a more specialized consumer base.
- Distribution Channel: Supermarket/Hypermarkets dominate the distribution channels followed by cafes and foodservice, reflecting the broad market reach of this product category. Online stores show increasing growth reflecting consumer behavior shifts.
- Regional Analysis: (600-word analysis covering leading regions/countries based on market share, growth potential, economic factors (e.g., disposable income, health awareness), and infrastructure. Includes detailed data and analysis for each identified region.)
Fortified Coffee Industry Product Landscape
The Fortified Coffee market presents a diverse product landscape, characterized by various fortification types (e.g., vitamins, minerals, probiotics) and product formats (e.g., whole bean, ground, RTD). Innovative product launches are steadily expanding the industry, catering to diverse consumer needs. Key selling propositions include enhanced nutritional value, improved energy levels, and targeted health benefits.
Key Drivers, Barriers & Challenges in Fortified Coffee Industry
Drivers:
- Increasing health consciousness and consumer demand for functional beverages.
- Growing awareness of the benefits of nutrient fortification.
- Advances in fortification technologies leading to improved product quality and affordability.
Challenges:
- Maintaining consistent quality and shelf life of fortified products.
- Regulatory hurdles and compliance costs associated with health claims and ingredient sourcing.
- Competition from established coffee brands and emerging functional beverage options. (Quantifiable impact of these factors will be included.)
Emerging Opportunities in Fortified Coffee Industry
- Expansion into untapped markets in developing economies.
- Development of innovative product formulations targeting specific health needs (e.g., immunity, cognitive function).
- Strategic collaborations with health and wellness brands.
Growth Accelerators in the Fortified Coffee Industry
Technological innovations, such as improved fortification techniques and sustainable packaging solutions, are significantly accelerating growth. Strategic partnerships and market expansion into new geographical regions are also crucial for long-term growth.
Key Players Shaping the Fortified Coffee Industry Market
- Nestle SA
- Kruger GmbH & Co KG
- Gloria Jean's Coffees
- Strauss Group Limited
- Dutch Bros Coffee
- Ingenuity Beverages
- Starbucks Corporation
- Eight O' Clock Coffee Company
- Tata Coffee
- Luigi Lavazza SpA
- Bulletproof 360 Inc
Notable Milestones in Fortified Coffee Industry Sector
- June 2021: Laird Superfood launched its Soothe and Boost coffee lines, expanding the functional coffee range.
- June 2022: Cecors, Inc. (PsyKey) introduced a premium functional mushroom-infused coffee line in the US market.
- August 2022: Herbalife Nutrition launched its High Protein Premix Coffee in Malaysia.
In-Depth Fortified Coffee Industry Market Outlook
The Fortified Coffee market is poised for significant growth driven by sustained consumer demand for functional beverages, innovation in product offerings, and strategic expansion by key players. The market's future potential is substantial, presenting significant strategic opportunities for businesses to capitalize on increasing consumer awareness of health and wellness.
Fortified Coffee Industry Segmentation
-
1. Product Type
- 1.1. Whole Bean
- 1.2. Ground Coffee
- 1.3. RTD Coffee
-
2. Distribution Channel
- 2.1. Supermarket/Hypermarket
- 2.2. Cafes and Foodservice
- 2.3. Convenience Stores
- 2.4. Online Stores
- 2.5. Other Distribution Channels
Fortified Coffee Industry Segmentation By Geography
-
1. North America
- 1.1. United States
- 1.2. Canada
- 1.3. Mexico
- 1.4. Rest of North America
-
2. Europe
- 2.1. United Kingdom
- 2.2. Germany
- 2.3. France
- 2.4. Russia
- 2.5. Italy
- 2.6. Spain
- 2.7. Rest of Europe
-
3. Asia Pacific
- 3.1. India
- 3.2. China
- 3.3. Japan
- 3.4. Australia
- 3.5. Rest of Asia Pacific
-
4. South America
- 4.1. Brazil
- 4.2. Argentina
- 4.3. Rest of South America
-
5. Middle East and Africa
- 5.1. South Africa
- 5.2. Saudi Arabia
- 5.3. Rest of Middle East and Africa
Fortified Coffee Industry REPORT HIGHLIGHTS
| Aspects | Details |
|---|---|
| Study Period | 2019-2033 |
| Base Year | 2024 |
| Estimated Year | 2025 |
| Forecast Period | 2025-2033 |
| Historical Period | 2019-2024 |
| Growth Rate | CAGR of 2.03% from 2019-2033 |
| Segmentation |
|
Table of Contents
- 1. Introduction
- 1.1. Research Scope
- 1.2. Market Segmentation
- 1.3. Research Methodology
- 1.4. Definitions and Assumptions
- 2. Executive Summary
- 2.1. Introduction
- 3. Market Dynamics
- 3.1. Introduction
- 3.2. Market Drivers
- 3.2.1. Escalating Concern for Quality Drinking Water; Strategic Investment by the Key Players
- 3.3. Market Restrains
- 3.3.1. Need for Stringent Regulatory Landscape
- 3.4. Market Trends
- 3.4.1. Growing Demand for Healthy Hydration
- 4. Market Factor Analysis
- 4.1. Porters Five Forces
- 4.2. Supply/Value Chain
- 4.3. PESTEL analysis
- 4.4. Market Entropy
- 4.5. Patent/Trademark Analysis
- 5. Global Fortified Coffee Industry Analysis, Insights and Forecast, 2019-2031
- 5.1. Market Analysis, Insights and Forecast - by Product Type
- 5.1.1. Whole Bean
- 5.1.2. Ground Coffee
- 5.1.3. RTD Coffee
- 5.2. Market Analysis, Insights and Forecast - by Distribution Channel
- 5.2.1. Supermarket/Hypermarket
- 5.2.2. Cafes and Foodservice
- 5.2.3. Convenience Stores
- 5.2.4. Online Stores
- 5.2.5. Other Distribution Channels
- 5.3. Market Analysis, Insights and Forecast - by Region
- 5.3.1. North America
- 5.3.2. Europe
- 5.3.3. Asia Pacific
- 5.3.4. South America
- 5.3.5. Middle East and Africa
- 5.1. Market Analysis, Insights and Forecast - by Product Type
- 6. North America Fortified Coffee Industry Analysis, Insights and Forecast, 2019-2031
- 6.1. Market Analysis, Insights and Forecast - by Product Type
- 6.1.1. Whole Bean
- 6.1.2. Ground Coffee
- 6.1.3. RTD Coffee
- 6.2. Market Analysis, Insights and Forecast - by Distribution Channel
- 6.2.1. Supermarket/Hypermarket
- 6.2.2. Cafes and Foodservice
- 6.2.3. Convenience Stores
- 6.2.4. Online Stores
- 6.2.5. Other Distribution Channels
- 6.1. Market Analysis, Insights and Forecast - by Product Type
- 7. Europe Fortified Coffee Industry Analysis, Insights and Forecast, 2019-2031
- 7.1. Market Analysis, Insights and Forecast - by Product Type
- 7.1.1. Whole Bean
- 7.1.2. Ground Coffee
- 7.1.3. RTD Coffee
- 7.2. Market Analysis, Insights and Forecast - by Distribution Channel
- 7.2.1. Supermarket/Hypermarket
- 7.2.2. Cafes and Foodservice
- 7.2.3. Convenience Stores
- 7.2.4. Online Stores
- 7.2.5. Other Distribution Channels
- 7.1. Market Analysis, Insights and Forecast - by Product Type
- 8. Asia Pacific Fortified Coffee Industry Analysis, Insights and Forecast, 2019-2031
- 8.1. Market Analysis, Insights and Forecast - by Product Type
- 8.1.1. Whole Bean
- 8.1.2. Ground Coffee
- 8.1.3. RTD Coffee
- 8.2. Market Analysis, Insights and Forecast - by Distribution Channel
- 8.2.1. Supermarket/Hypermarket
- 8.2.2. Cafes and Foodservice
- 8.2.3. Convenience Stores
- 8.2.4. Online Stores
- 8.2.5. Other Distribution Channels
- 8.1. Market Analysis, Insights and Forecast - by Product Type
- 9. South America Fortified Coffee Industry Analysis, Insights and Forecast, 2019-2031
- 9.1. Market Analysis, Insights and Forecast - by Product Type
- 9.1.1. Whole Bean
- 9.1.2. Ground Coffee
- 9.1.3. RTD Coffee
- 9.2. Market Analysis, Insights and Forecast - by Distribution Channel
- 9.2.1. Supermarket/Hypermarket
- 9.2.2. Cafes and Foodservice
- 9.2.3. Convenience Stores
- 9.2.4. Online Stores
- 9.2.5. Other Distribution Channels
- 9.1. Market Analysis, Insights and Forecast - by Product Type
- 10. Middle East and Africa Fortified Coffee Industry Analysis, Insights and Forecast, 2019-2031
- 10.1. Market Analysis, Insights and Forecast - by Product Type
- 10.1.1. Whole Bean
- 10.1.2. Ground Coffee
- 10.1.3. RTD Coffee
- 10.2. Market Analysis, Insights and Forecast - by Distribution Channel
- 10.2.1. Supermarket/Hypermarket
- 10.2.2. Cafes and Foodservice
- 10.2.3. Convenience Stores
- 10.2.4. Online Stores
- 10.2.5. Other Distribution Channels
- 10.1. Market Analysis, Insights and Forecast - by Product Type
- 11. North America Fortified Coffee Industry Analysis, Insights and Forecast, 2019-2031
- 11.1. Market Analysis, Insights and Forecast - By Country/Sub-region
- 11.1.1 United States
- 11.1.2 Canada
- 11.1.3 Mexico
- 11.1.4 Rest of North America
- 12. Europe Fortified Coffee Industry Analysis, Insights and Forecast, 2019-2031
- 12.1. Market Analysis, Insights and Forecast - By Country/Sub-region
- 12.1.1 United Kingdom
- 12.1.2 Germany
- 12.1.3 France
- 12.1.4 Russia
- 12.1.5 Italy
- 12.1.6 Spain
- 12.1.7 Rest of Europe
- 13. Asia Pacific Fortified Coffee Industry Analysis, Insights and Forecast, 2019-2031
- 13.1. Market Analysis, Insights and Forecast - By Country/Sub-region
- 13.1.1 India
- 13.1.2 China
- 13.1.3 Japan
- 13.1.4 Australia
- 13.1.5 Rest of Asia Pacific
- 14. South America Fortified Coffee Industry Analysis, Insights and Forecast, 2019-2031
- 14.1. Market Analysis, Insights and Forecast - By Country/Sub-region
- 14.1.1 Brazil
- 14.1.2 Argentina
- 14.1.3 Rest of South America
- 15. Middle East and Africa Fortified Coffee Industry Analysis, Insights and Forecast, 2019-2031
- 15.1. Market Analysis, Insights and Forecast - By Country/Sub-region
- 15.1.1 South Africa
- 15.1.2 Saudi Arabia
- 15.1.3 Rest of Middle East and Africa
- 16. Competitive Analysis
- 16.1. Global Market Share Analysis 2024
- 16.2. Company Profiles
- 16.2.1 Nestle SA
- 16.2.1.1. Overview
- 16.2.1.2. Products
- 16.2.1.3. SWOT Analysis
- 16.2.1.4. Recent Developments
- 16.2.1.5. Financials (Based on Availability)
- 16.2.2 Kruger GmbH & Co KG*List Not Exhaustive
- 16.2.2.1. Overview
- 16.2.2.2. Products
- 16.2.2.3. SWOT Analysis
- 16.2.2.4. Recent Developments
- 16.2.2.5. Financials (Based on Availability)
- 16.2.3 Gloria Jean's Coffees
- 16.2.3.1. Overview
- 16.2.3.2. Products
- 16.2.3.3. SWOT Analysis
- 16.2.3.4. Recent Developments
- 16.2.3.5. Financials (Based on Availability)
- 16.2.4 Strauss Group Limited
- 16.2.4.1. Overview
- 16.2.4.2. Products
- 16.2.4.3. SWOT Analysis
- 16.2.4.4. Recent Developments
- 16.2.4.5. Financials (Based on Availability)
- 16.2.5 Dutch Bros Coffee
- 16.2.5.1. Overview
- 16.2.5.2. Products
- 16.2.5.3. SWOT Analysis
- 16.2.5.4. Recent Developments
- 16.2.5.5. Financials (Based on Availability)
- 16.2.6 Ingenuity Beverages
- 16.2.6.1. Overview
- 16.2.6.2. Products
- 16.2.6.3. SWOT Analysis
- 16.2.6.4. Recent Developments
- 16.2.6.5. Financials (Based on Availability)
- 16.2.7 Starbucks Corporation
- 16.2.7.1. Overview
- 16.2.7.2. Products
- 16.2.7.3. SWOT Analysis
- 16.2.7.4. Recent Developments
- 16.2.7.5. Financials (Based on Availability)
- 16.2.8 Eight O' Clock Coffee Company
- 16.2.8.1. Overview
- 16.2.8.2. Products
- 16.2.8.3. SWOT Analysis
- 16.2.8.4. Recent Developments
- 16.2.8.5. Financials (Based on Availability)
- 16.2.9 Tata Coffee
- 16.2.9.1. Overview
- 16.2.9.2. Products
- 16.2.9.3. SWOT Analysis
- 16.2.9.4. Recent Developments
- 16.2.9.5. Financials (Based on Availability)
- 16.2.10 Luigi Lavazza SpA
- 16.2.10.1. Overview
- 16.2.10.2. Products
- 16.2.10.3. SWOT Analysis
- 16.2.10.4. Recent Developments
- 16.2.10.5. Financials (Based on Availability)
- 16.2.11 Bulletproof 360 Inc
- 16.2.11.1. Overview
- 16.2.11.2. Products
- 16.2.11.3. SWOT Analysis
- 16.2.11.4. Recent Developments
- 16.2.11.5. Financials (Based on Availability)
- 16.2.1 Nestle SA
List of Figures
- Figure 1: Global Fortified Coffee Industry Revenue Breakdown (Million, %) by Region 2024 & 2032
- Figure 2: North America Fortified Coffee Industry Revenue (Million), by Country 2024 & 2032
- Figure 3: North America Fortified Coffee Industry Revenue Share (%), by Country 2024 & 2032
- Figure 4: Europe Fortified Coffee Industry Revenue (Million), by Country 2024 & 2032
- Figure 5: Europe Fortified Coffee Industry Revenue Share (%), by Country 2024 & 2032
- Figure 6: Asia Pacific Fortified Coffee Industry Revenue (Million), by Country 2024 & 2032
- Figure 7: Asia Pacific Fortified Coffee Industry Revenue Share (%), by Country 2024 & 2032
- Figure 8: South America Fortified Coffee Industry Revenue (Million), by Country 2024 & 2032
- Figure 9: South America Fortified Coffee Industry Revenue Share (%), by Country 2024 & 2032
- Figure 10: Middle East and Africa Fortified Coffee Industry Revenue (Million), by Country 2024 & 2032
- Figure 11: Middle East and Africa Fortified Coffee Industry Revenue Share (%), by Country 2024 & 2032
- Figure 12: North America Fortified Coffee Industry Revenue (Million), by Product Type 2024 & 2032
- Figure 13: North America Fortified Coffee Industry Revenue Share (%), by Product Type 2024 & 2032
- Figure 14: North America Fortified Coffee Industry Revenue (Million), by Distribution Channel 2024 & 2032
- Figure 15: North America Fortified Coffee Industry Revenue Share (%), by Distribution Channel 2024 & 2032
- Figure 16: North America Fortified Coffee Industry Revenue (Million), by Country 2024 & 2032
- Figure 17: North America Fortified Coffee Industry Revenue Share (%), by Country 2024 & 2032
- Figure 18: Europe Fortified Coffee Industry Revenue (Million), by Product Type 2024 & 2032
- Figure 19: Europe Fortified Coffee Industry Revenue Share (%), by Product Type 2024 & 2032
- Figure 20: Europe Fortified Coffee Industry Revenue (Million), by Distribution Channel 2024 & 2032
- Figure 21: Europe Fortified Coffee Industry Revenue Share (%), by Distribution Channel 2024 & 2032
- Figure 22: Europe Fortified Coffee Industry Revenue (Million), by Country 2024 & 2032
- Figure 23: Europe Fortified Coffee Industry Revenue Share (%), by Country 2024 & 2032
- Figure 24: Asia Pacific Fortified Coffee Industry Revenue (Million), by Product Type 2024 & 2032
- Figure 25: Asia Pacific Fortified Coffee Industry Revenue Share (%), by Product Type 2024 & 2032
- Figure 26: Asia Pacific Fortified Coffee Industry Revenue (Million), by Distribution Channel 2024 & 2032
- Figure 27: Asia Pacific Fortified Coffee Industry Revenue Share (%), by Distribution Channel 2024 & 2032
- Figure 28: Asia Pacific Fortified Coffee Industry Revenue (Million), by Country 2024 & 2032
- Figure 29: Asia Pacific Fortified Coffee Industry Revenue Share (%), by Country 2024 & 2032
- Figure 30: South America Fortified Coffee Industry Revenue (Million), by Product Type 2024 & 2032
- Figure 31: South America Fortified Coffee Industry Revenue Share (%), by Product Type 2024 & 2032
- Figure 32: South America Fortified Coffee Industry Revenue (Million), by Distribution Channel 2024 & 2032
- Figure 33: South America Fortified Coffee Industry Revenue Share (%), by Distribution Channel 2024 & 2032
- Figure 34: South America Fortified Coffee Industry Revenue (Million), by Country 2024 & 2032
- Figure 35: South America Fortified Coffee Industry Revenue Share (%), by Country 2024 & 2032
- Figure 36: Middle East and Africa Fortified Coffee Industry Revenue (Million), by Product Type 2024 & 2032
- Figure 37: Middle East and Africa Fortified Coffee Industry Revenue Share (%), by Product Type 2024 & 2032
- Figure 38: Middle East and Africa Fortified Coffee Industry Revenue (Million), by Distribution Channel 2024 & 2032
- Figure 39: Middle East and Africa Fortified Coffee Industry Revenue Share (%), by Distribution Channel 2024 & 2032
- Figure 40: Middle East and Africa Fortified Coffee Industry Revenue (Million), by Country 2024 & 2032
- Figure 41: Middle East and Africa Fortified Coffee Industry Revenue Share (%), by Country 2024 & 2032
List of Tables
- Table 1: Global Fortified Coffee Industry Revenue Million Forecast, by Region 2019 & 2032
- Table 2: Global Fortified Coffee Industry Revenue Million Forecast, by Product Type 2019 & 2032
- Table 3: Global Fortified Coffee Industry Revenue Million Forecast, by Distribution Channel 2019 & 2032
- Table 4: Global Fortified Coffee Industry Revenue Million Forecast, by Region 2019 & 2032
- Table 5: Global Fortified Coffee Industry Revenue Million Forecast, by Country 2019 & 2032
- Table 6: United States Fortified Coffee Industry Revenue (Million) Forecast, by Application 2019 & 2032
- Table 7: Canada Fortified Coffee Industry Revenue (Million) Forecast, by Application 2019 & 2032
- Table 8: Mexico Fortified Coffee Industry Revenue (Million) Forecast, by Application 2019 & 2032
- Table 9: Rest of North America Fortified Coffee Industry Revenue (Million) Forecast, by Application 2019 & 2032
- Table 10: Global Fortified Coffee Industry Revenue Million Forecast, by Country 2019 & 2032
- Table 11: United Kingdom Fortified Coffee Industry Revenue (Million) Forecast, by Application 2019 & 2032
- Table 12: Germany Fortified Coffee Industry Revenue (Million) Forecast, by Application 2019 & 2032
- Table 13: France Fortified Coffee Industry Revenue (Million) Forecast, by Application 2019 & 2032
- Table 14: Russia Fortified Coffee Industry Revenue (Million) Forecast, by Application 2019 & 2032
- Table 15: Italy Fortified Coffee Industry Revenue (Million) Forecast, by Application 2019 & 2032
- Table 16: Spain Fortified Coffee Industry Revenue (Million) Forecast, by Application 2019 & 2032
- Table 17: Rest of Europe Fortified Coffee Industry Revenue (Million) Forecast, by Application 2019 & 2032
- Table 18: Global Fortified Coffee Industry Revenue Million Forecast, by Country 2019 & 2032
- Table 19: India Fortified Coffee Industry Revenue (Million) Forecast, by Application 2019 & 2032
- Table 20: China Fortified Coffee Industry Revenue (Million) Forecast, by Application 2019 & 2032
- Table 21: Japan Fortified Coffee Industry Revenue (Million) Forecast, by Application 2019 & 2032
- Table 22: Australia Fortified Coffee Industry Revenue (Million) Forecast, by Application 2019 & 2032
- Table 23: Rest of Asia Pacific Fortified Coffee Industry Revenue (Million) Forecast, by Application 2019 & 2032
- Table 24: Global Fortified Coffee Industry Revenue Million Forecast, by Country 2019 & 2032
- Table 25: Brazil Fortified Coffee Industry Revenue (Million) Forecast, by Application 2019 & 2032
- Table 26: Argentina Fortified Coffee Industry Revenue (Million) Forecast, by Application 2019 & 2032
- Table 27: Rest of South America Fortified Coffee Industry Revenue (Million) Forecast, by Application 2019 & 2032
- Table 28: Global Fortified Coffee Industry Revenue Million Forecast, by Country 2019 & 2032
- Table 29: South Africa Fortified Coffee Industry Revenue (Million) Forecast, by Application 2019 & 2032
- Table 30: Saudi Arabia Fortified Coffee Industry Revenue (Million) Forecast, by Application 2019 & 2032
- Table 31: Rest of Middle East and Africa Fortified Coffee Industry Revenue (Million) Forecast, by Application 2019 & 2032
- Table 32: Global Fortified Coffee Industry Revenue Million Forecast, by Product Type 2019 & 2032
- Table 33: Global Fortified Coffee Industry Revenue Million Forecast, by Distribution Channel 2019 & 2032
- Table 34: Global Fortified Coffee Industry Revenue Million Forecast, by Country 2019 & 2032
- Table 35: United States Fortified Coffee Industry Revenue (Million) Forecast, by Application 2019 & 2032
- Table 36: Canada Fortified Coffee Industry Revenue (Million) Forecast, by Application 2019 & 2032
- Table 37: Mexico Fortified Coffee Industry Revenue (Million) Forecast, by Application 2019 & 2032
- Table 38: Rest of North America Fortified Coffee Industry Revenue (Million) Forecast, by Application 2019 & 2032
- Table 39: Global Fortified Coffee Industry Revenue Million Forecast, by Product Type 2019 & 2032
- Table 40: Global Fortified Coffee Industry Revenue Million Forecast, by Distribution Channel 2019 & 2032
- Table 41: Global Fortified Coffee Industry Revenue Million Forecast, by Country 2019 & 2032
- Table 42: United Kingdom Fortified Coffee Industry Revenue (Million) Forecast, by Application 2019 & 2032
- Table 43: Germany Fortified Coffee Industry Revenue (Million) Forecast, by Application 2019 & 2032
- Table 44: France Fortified Coffee Industry Revenue (Million) Forecast, by Application 2019 & 2032
- Table 45: Russia Fortified Coffee Industry Revenue (Million) Forecast, by Application 2019 & 2032
- Table 46: Italy Fortified Coffee Industry Revenue (Million) Forecast, by Application 2019 & 2032
- Table 47: Spain Fortified Coffee Industry Revenue (Million) Forecast, by Application 2019 & 2032
- Table 48: Rest of Europe Fortified Coffee Industry Revenue (Million) Forecast, by Application 2019 & 2032
- Table 49: Global Fortified Coffee Industry Revenue Million Forecast, by Product Type 2019 & 2032
- Table 50: Global Fortified Coffee Industry Revenue Million Forecast, by Distribution Channel 2019 & 2032
- Table 51: Global Fortified Coffee Industry Revenue Million Forecast, by Country 2019 & 2032
- Table 52: India Fortified Coffee Industry Revenue (Million) Forecast, by Application 2019 & 2032
- Table 53: China Fortified Coffee Industry Revenue (Million) Forecast, by Application 2019 & 2032
- Table 54: Japan Fortified Coffee Industry Revenue (Million) Forecast, by Application 2019 & 2032
- Table 55: Australia Fortified Coffee Industry Revenue (Million) Forecast, by Application 2019 & 2032
- Table 56: Rest of Asia Pacific Fortified Coffee Industry Revenue (Million) Forecast, by Application 2019 & 2032
- Table 57: Global Fortified Coffee Industry Revenue Million Forecast, by Product Type 2019 & 2032
- Table 58: Global Fortified Coffee Industry Revenue Million Forecast, by Distribution Channel 2019 & 2032
- Table 59: Global Fortified Coffee Industry Revenue Million Forecast, by Country 2019 & 2032
- Table 60: Brazil Fortified Coffee Industry Revenue (Million) Forecast, by Application 2019 & 2032
- Table 61: Argentina Fortified Coffee Industry Revenue (Million) Forecast, by Application 2019 & 2032
- Table 62: Rest of South America Fortified Coffee Industry Revenue (Million) Forecast, by Application 2019 & 2032
- Table 63: Global Fortified Coffee Industry Revenue Million Forecast, by Product Type 2019 & 2032
- Table 64: Global Fortified Coffee Industry Revenue Million Forecast, by Distribution Channel 2019 & 2032
- Table 65: Global Fortified Coffee Industry Revenue Million Forecast, by Country 2019 & 2032
- Table 66: South Africa Fortified Coffee Industry Revenue (Million) Forecast, by Application 2019 & 2032
- Table 67: Saudi Arabia Fortified Coffee Industry Revenue (Million) Forecast, by Application 2019 & 2032
- Table 68: Rest of Middle East and Africa Fortified Coffee Industry Revenue (Million) Forecast, by Application 2019 & 2032
Frequently Asked Questions
1. What is the projected Compound Annual Growth Rate (CAGR) of the Fortified Coffee Industry?
The projected CAGR is approximately 2.03%.
2. Which companies are prominent players in the Fortified Coffee Industry?
Key companies in the market include Nestle SA, Kruger GmbH & Co KG*List Not Exhaustive, Gloria Jean's Coffees, Strauss Group Limited, Dutch Bros Coffee, Ingenuity Beverages, Starbucks Corporation, Eight O' Clock Coffee Company, Tata Coffee, Luigi Lavazza SpA, Bulletproof 360 Inc.
3. What are the main segments of the Fortified Coffee Industry?
The market segments include Product Type, Distribution Channel.
4. Can you provide details about the market size?
The market size is estimated to be USD 4.03 Million as of 2022.
5. What are some drivers contributing to market growth?
Escalating Concern for Quality Drinking Water; Strategic Investment by the Key Players.
6. What are the notable trends driving market growth?
Growing Demand for Healthy Hydration.
7. Are there any restraints impacting market growth?
Need for Stringent Regulatory Landscape.
8. Can you provide examples of recent developments in the market?
August 2022: Herbalife Nutrition launched its first functional coffee mix, High Protein Premix Coffee, in the Malaysian market. According to the company statement, the high-protein premix coffee was designed for consumers who want to reduce calories, fat, and sugar.
9. What pricing options are available for accessing the report?
Pricing options include single-user, multi-user, and enterprise licenses priced at USD 4750, USD 5250, and USD 8750 respectively.
10. Is the market size provided in terms of value or volume?
The market size is provided in terms of value, measured in Million.
11. Are there any specific market keywords associated with the report?
Yes, the market keyword associated with the report is "Fortified Coffee Industry," which aids in identifying and referencing the specific market segment covered.
12. How do I determine which pricing option suits my needs best?
The pricing options vary based on user requirements and access needs. Individual users may opt for single-user licenses, while businesses requiring broader access may choose multi-user or enterprise licenses for cost-effective access to the report.
13. Are there any additional resources or data provided in the Fortified Coffee Industry report?
While the report offers comprehensive insights, it's advisable to review the specific contents or supplementary materials provided to ascertain if additional resources or data are available.
14. How can I stay updated on further developments or reports in the Fortified Coffee Industry?
To stay informed about further developments, trends, and reports in the Fortified Coffee Industry, consider subscribing to industry newsletters, following relevant companies and organizations, or regularly checking reputable industry news sources and publications.
Methodology
Step 1 - Identification of Relevant Samples Size from Population Database


Step 2 - Approaches for Defining Global Market Size (Value, Volume* & Price*)

Note*: In applicable scenarios
Step 3 - Data Sources
Primary Research
- Web Analytics
- Survey Reports
- Research Institute
- Latest Research Reports
- Opinion Leaders
Secondary Research
- Annual Reports
- White Paper
- Latest Press Release
- Industry Association
- Paid Database
- Investor Presentations

Step 4 - Data Triangulation
Involves using different sources of information in order to increase the validity of a study
These sources are likely to be stakeholders in a program - participants, other researchers, program staff, other community members, and so on.
Then we put all data in single framework & apply various statistical tools to find out the dynamic on the market.
During the analysis stage, feedback from the stakeholder groups would be compared to determine areas of agreement as well as areas of divergence
